|
|
|
报告导航:研究报告—
制造业—能源矿产
|
|
2012-2015年中国稀土行业研究报告 |
 |
字数:4.4万 |
页数:120 |
图表数:149 |
|
中文电子版:8500元 |
中文纸版:4250元 |
中文(电子+纸)版:9000元 |
|
英文电子版:2300美元 |
英文纸版:2400美元 |
英文(电子+纸)版:2600美元 |
|
编号:YSJ067
|
发布日期:2013-04 |
附件:下载 |
 |
|
|
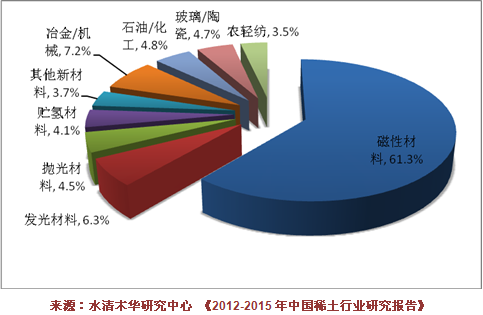
中国是全球稀土大国,资源储量占到全球稀土总储量的50%,同时每年为全球供应90%左右的稀土产品。为了对稀土资源进行保护,近几年中国出台多项政策限制稀土的过度开采及出口,主要政策有采矿许可证控制、开采总量控制、出口配额、专用发票制度等。上述政策的实施使近几年中国稀土产品供给量出现下降,价格上升。 中国的稀土消费可分为传统领域和新材料领域,传统领域包括冶金/机械、石油/化工、玻璃/陶瓷和农业/轻工/纺织等行业,新材料领域主要包括永磁材料、发光材料、抛光材料、贮氢材料等领域。最近几年,受下游需求的带动,新材料领域对稀土的消费量不断上升。预计2015年新材料对稀土的需求量将占到需求总量的79.8%,其中磁性材料的需求量最大,将占到总需求量的61.3%。 图:2015年中国稀土应用结构预测
中科三环是中国最大的磁性材料生产商,主要产品为钕铁硼,其烧结钕铁硼产能约14000 吨,规模居中国第一位;粘结钕铁硼产能约1500 吨。中科三环的钕铁硼产品主要应用于汽车、VCM、节能电机、风电等行业,其中汽车行业的需求占到公司营业收入的40%左右。2012年由于汽车EPS需求大幅增长,促使公司在行业整体低靡的情况下业绩出现增长。 科恒股份是中国最大的稀土发光材料生产企业,该公司的稀土荧光粉产能大约在1500吨左右,其中节能灯用荧光粉约占97%。2012年,由于原材料价格波动导致公司产品价格下调,同时销量减少,业绩出现较大幅度下滑。其中营业收入同比下降51.56%,营业利润同比下降79.87%。2012年上半年,在公司整体业绩下滑的情况下,其新兴领域用稀土发光材料营业收入实现27.1%的增长。未来该公司将继续拓展无极灯、白光LED、平板显示等新兴领域用稀土发光材料市场。 水清木华研究中心《2012-2015年中国稀土行业研究报告》主要包括以下内容:- 全球稀土资源储量、分布、供需以及2013-2015年发展预测;
- 中国稀土资源储量、分布、供需、消费、出口、价格以及2013-2015年发展预测;
- 中国稀土行业主要政策以及发展趋势;
- 中国主要地区稀土行业发展现状,以及发展规划;
- 中国主要新材料行业发展现状、对稀土的需求情况以及发展趋势;
- 中国主要稀土生产企业以及新材料企业的经营情况、产品产能、战略规划等内容。
As the world’s major rare earth country, China occupies 50% of the total
global rare earth reserves, but also provides about 90% of the global
rare earth products every year. In order to protect rare earth
resources, it has promulgated a number of policies over the years to
limit over-exploitation and export of rare earth, including mining
license control, total quantity control, export quotas, special invoice
system, etc., whose implementation has caused supply decrease and price
increase as far as Chinese rare earth products are concerned. In
China, rare earth consumption can be divided into traditional field and
new material field, of which, the former covers metallurgy / machinery,
petroleum / chemicals, glass / ceramics, agriculture / light industry /
textile, etc., and the latter mainly refers to permanent magnet
materials, luminescent materials, polishing materials and hydrogen
storage materials. In recent years, driven by downstream demand, the new
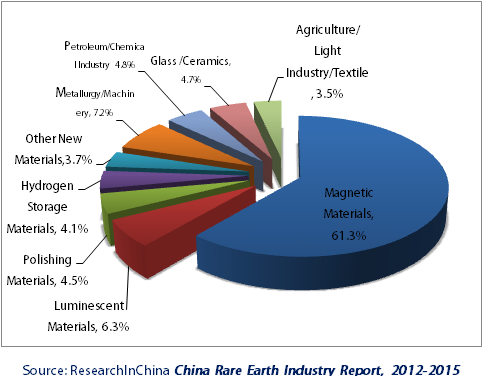
material field has witnessed rising consumption of rare earth. It is
expected that in 2015, the demand for rare earth from new materials will
account for 79.8% of the total, of which, magnetic materials will show
the largest of 61.3%. China Rare Earth Application Structure, 2015E
As
China’s largest manufacturer of magnetic materials especially NdFeB,
Beijing Zhong Ke San Huan Hi-Tech Co., Ltd. has an annual capacity of
about 14,000 tons of sintered NdFeB (ranking first domestically) and
1,500 tons of bonded NdFeB. Its NdFeB products are primarily applied in
automotive, VCM, energy-saving motors, wind power and other industries,
of which, demand from the automotive industry occupies approximately 40%
of the total revenue. In 2012 thanks to the substantial growth in
automotive EPS demand, the company’s performance experienced growth
against the overall industry malaise. Jiangmen KanHoo Industry
Co., Ltd is China’s largest rare earth luminescent materials producer,
with an annual capacity of about 1,500 tons of rare earth phosphor
powder, 97% of which for energy-saving lamp use. In 2012 due to the
price fluctuations in raw materials, the company’s product prices were
reduced, sales volume fell, and performance showed a substantial
decline, of which, revenue and operating income dropped by 51.56% and
79.87% YoY, respectively. In the first half of 2012, the company’s
overall performance declined, but the revenue from rare earth
luminescent materials used in emerging fields achieved 27.1% growth. In
the future, the company will continue to expand the market of rare earth
luminescent materials for induction lamp, white-light LED, flat panel
display, and so on. China Rare Earth Industry Report, 2012-2015 of ResearchInChina mainly covers the followings: Global rare earth resources and reserves, distribution, supply and demand, as well as development forecast for 2013-2015;
China’s rare earth resources and reserves, distribution, supply and
demand, consumption, exports, prices, as well as development forecast
for 2013-2015; Main policies and development trend of rare earth industry in China; Development status and plans for rare earth industry in main areas of China; Development status, demand for rare earth and growth trend of China’s major new materials industries; Operation, product capacity, strategic planning, etc. of China’s leading rare earth producers and new materials enterprises.
第一章 稀土行业概述
1.1 定义及分类
1.2 产业链
第二章 中国稀土行业发展环境
2.1 全球稀土行业发展情况
2.1.1 资源储量及分布
2.1.2 海外稀土矿山开发情况
2.1.3 供给情况
2.1.4 消费情况
2.2 中国稀土产业政策环境
2.2.1 稀土生产政策
2.2.2 稀土外商投资政策
2.2.3 稀土产品出口政策
2.2.4 稀土产业整合政策
2.2.5 稀土专用发票制度
2.2.6 政策发展方向
第三章 中国稀土行业发展现状
3.1中国稀土资源储量及分布
3.1.1 资源分布
3.1.2 离子型稀土矿
3.2 中国主要地区稀土行业发展状况
3.2.1 内蒙古
3.2.2 四川
3.2.3 山东
3.2.4 江西
3.2.5 广西
3.2.6 广东
3.2.7 湖南
3.2.8 福建
3.2.9 云南
第四章 中国稀土行业市场供需情况
4.1 中国稀土供需情况
4.1.1 稀土矿生产情况
4.1.2 稀土产品生产情况
4.1.3 稀土消费情况
4.2 中国稀土出口情况
4.2.1 出口配额
4.2.2 出口规模
4.2.3 出口结构
4.2.4 出口诉讼
4.3 中国稀土市场价格走势
4.3.1 整体价格走势
4.3.2 主要中重稀土金属产品价格
4.3.3 主要轻稀土金属产品价格
第五章 稀土金属应用市场领域
5.1 应用结构
5.2 磁性材料
5.2.1 主要应用领域
5.2.2 消耗情况
5.2.3 主要企业及产能
5.3 储氢材料
5.3.1 消耗情况
5.3.2主要企业及产能
5.4 抛光材料
5.4.1消耗情况
5.4.2主要企业及产能
5.5 发光材料
5.5.1 主要应用领域
5.5.2 生产情况
5.5.3主要企业及产能
第六章 中国稀土行业主要企业
6.1 包钢稀土
6.1.1 公司简介
6.1.2 经营情况
6.1.3 收入结构
6.1.4 毛利率
6.1.5 经营业绩预测
6.2 关铝股份
6.2.1 公司简介
6.2.2 经营情况
6.3 江钨集团
6.3.1 公司简介
6.3.2 经营情况
6.4 中色股份
6.4.1 公司简介
6.4.2 经营情况
6.4.3 稀土业务
6.4.4 发展规划
6.5 广晟有色
6.5.1 公司简介
6.5.2 经营情况
6.5.3 收入结构
6.5.4 毛利率
6.5.5 投资规划
6.6 厦门钨业
6.6.1 公司简介
6.6.2 经营情况
6.6.3 稀土业务
6.6.4 经营业绩预测
6.7 湖南稀土院
6.7.1 企业简介
6.7.2 经营情况
6.8 盛和稀土
6.8.1 公司简介
6.8.2 经营情况
6.8.3 公司建设项目
6.9 中国稀土
6.9.1 公司简介
6.9.2 经营情况
6.9.3 公司建设项目
6.10 有研稀土
6.10.1 企业简介
6.10.2 经营情况
6.11 加华新材
6.11.1 公司简介
6.11.2 经营情况
6.12 赣州晨光
6.12.1 公司简介
6.12.2 经营情况
第七章 中国主要稀土新材料生产企业
7.1 中科三环
7.1.1 公司简介
7.1.2 公司产业链拓展情况
7.1.3 经营情况
7.1.4 收入结构
7.1.5 毛利率
7.1.6 经营业绩预测
7.2 宁波韵升
7.2.1 公司简介
7.2.2 经营情况
7.2.3 收入结构
7.2.4 毛利率
7.2.5 经营业绩预测
7.3 太原刚玉
7.3.1 公司简介
7.3.2 经营情况
7.3.3 收入结构
7.3.4 毛利率
7.3.5 经营业绩预测
7.4 科恒股份
7.4.1 公司简介
7.4.2 经营情况
7.4.3 收入结构
7.4.4 毛利率
7.4.5 产销量
7.4.6 产能建设
7.4.7 经营业绩预测
7.5 彩虹荧光
7.5.1 公司简介
7.5.2 经营情况
7.5.3 发展规划
1. Overview of Rare Earth Industry
1.1 Definition & Classification
1.2 Industry Chain
2. Development Environment of China’s Rare Earth Industry
2.1 Global Rare Earth Industry Development
2.1.1 Reserves and Distribution
2.1.2 Development of Rare Earth Mining Overseas
2.1.3 Supply
2.1.4 Demand
2.2 China’s Rare Earth Industry Policy Adjustment
2.2.1 Production Policy
2.2.2 Foreign Investment Policy
2.2.3 Export Policy
2.2.4 Industrial Integration Policy
2.2.5 Special Invoice System for Rare Earth
2.2.6 Policy Development Direction
3. China’s Rare Earth Industry Development
3.1 Reserves and Distribution
3.1.1 Resource Distribution
3.1.2 Ion-absorbing Type Rare Earth Ore
3.2 Development in Major Regions
3.2.1 Inner Mongolia
3.2.2 Sichuan
3.2.3 Shandong
3.2.4 Jiangxi
3.2.5 Guangxi
3.2.6 Guangdong
3.2.7 Hunan
3.2.8 Fujian
3.2.9 Yunnan
4. China’s Rare Earth Industry Market Supply and Demand
4.1 Supply & Demand
4.1.1 Rare Earth Ore Production
4.1.2 Rare Earth Products Production
4.1.3 Demand
4.2 Export
4.2.1 Export Quota
4.2.2 Export Scale
4.2.3 Export Structure
4.2.4 Export Litigation
4.3 Market Price
4.3.1 Overall Price
4.3.2 Prices of Major Middle & Heavy Rare Earth Metals
4.3.3 Prices of Major Light Rare Earth Metals
5. Application of Rare Earth Metals
5.1 Application Structure
5.2 Magnetic Materials
5.2.1 Major Application
5.2.2 Consumption
5.2.3 Major Enterprises and Capacity
5.3 Hydrogen Storage Material
5.3.1 Consumption
5.3.2 Major Enterprises and Capacity
5.4 Polishing Material
5.4.1 Consumption
5.4.2 Major Enterprises and Capacity
5.5 Luminescent Material
5.5.1 Major Application
5.5.2 Production
5.5.3 Major Enterprises and Capacity
6. Major Rare Earth Enterprises of China
6.1 Inner Mongolia Baotou Steel Rare-Earth(Group) Hi-Tech Co.,Ltd
6.1.1 Profile
6.1.2 Operation
6.1.3 Revenue Structure
6.1.4 Gross Margin
6.1.5 Business Performance Prediction
6.2 Shanxi Guanlu Co.,Ltd.
6.2.1 Profile
6.2.2 Operation
6.3 Jiangxi Tungsten Industry Group Co., Ltd
6.3.1 Profile
6.3.2 Operation
6.4 China Nonferrous Metal Industry's Foreign Engineering and Construction Co.,Ltd.
6.4.1 Profile
6.4.2 Operation
6.4.3 Rare Earth Business
6.4.4 Development Plan
6.5 Rising Nonferrous Metals Share Co., Ltd.
6.5.1 Profile
6.5.2 Operation
6.5.3 Revenue Structure
6.5.4 Gross Margin
6.5.5 Investment Planning
6.6 Xiamen Tungsten Co.,Ltd
6.6.1 Profile
6.6.2 Operation
6.6.3 Rare Earth Business
6.6.4 Business Performance Prediction
6.7 Hunan Rare Earth Metal & Material Institute Co., Ltd.
6.7.1 Profile
6.7.2 Operation
6.8 Leshan Shenghe Rare Earth Technology Co., Ltd.
6.8.1 Profile
6.8.2 Operation
6.8.3 Construction Projects
6.9 China Rare Earth Holdings Ltd.
6.9.1 Profile
6.9.2 Operation
6.9.3 Construction Projects
6.10 Grirem Advanced Materials Co., Ltd.
6.10.1 Profile
6.10.2 Operation
6.11 Jiahua Advanced Material Resources
6.11.1 Profile
6.11.2 Operation
6.12 Gan Zhou Chen Guang Rare Earths New Material Shares Co.,Ltd.
6.12.1 Profile
6.12.2 Operation
7. Major Rare Earth New Material Enterprises of China
7.1 Beijing Zhong Ke San Huan High-Tech Co.,Ltd.
7.1.1 Profile
7.1.2 Extension of Industry Chain
7.1.3 Operation
7.1.4 Revenue Structure
7.1.5 Gross Margin
7.1.6 Business Performance Prediction
7.2 Ningbo Yunsheng Co.,Ltd.
7.2.1 Profile
7.2.2 Operation
7.2.3 Revenue Structure
7.2.4 Gross Margin
7.2.5 Business Performance Prediction
7.3 Taiyuan Twin Tower Alomllum Oxide Co., Ltd.
7.3.1 Profile
7.3.2 Operation
7.3.3 Revenue Structure
7.3.4 Gross Margin
7.3.5 Business Performance Prediction
7.4 Jiangmen Kanhoo Industry Co., Ltd.
7.4.1 Profile
7.4.2 Operation
7.4.3 Revenue Structure
7.4.4 Gross Margin
7.4.5 Output and Sales Volume
7.4.6 Capacity Construction
7.4.7 Business Performance Prediction
7.5 Shannxi IRICO Fluorescent Materials Co., Ltd.
7.5.1 Profile
7.5.2 Operation
7.5.3 Development Plan
表:稀土分类
图:稀土行业产业链
表:稀土矿类型
图:2012年全球稀土资源储量分布
表:2012年国外稀土矿山开发项目
表:海外主要稀土矿山开发项目概况
表:2009-2012年全球主要国家稀土产量
图:2015年全球稀土供应格局
表:2015年全球稀土供给预测
图:2006-2015年全球稀土消费量
图:美国稀土消费结构
图:日本稀土消费结构
图:2015年全球稀土消费结构预测
表:2015年全球下游行业稀土各元素的消费量预测
表:2002-2013年中国公布的主要稀土产业政策
表:2013年中国各地区稀土采矿证数量
表:2013年中国稀土产品出口关税税率
表:2011-2013年中国稀土产业整合政策
图:中国稀土资源分布
表:中国主要矿区稀土矿床利用对比情况
图:中国离子型稀土矿分布
表:中国离子型稀土矿配份
表:全球主要资源静态储采比
表:2013年第一批稀土开采总量控制指标
图:2008-2013年中国稀土矿产量
表:2008-2012年中国稀土矿生产结构
图:2008-2013年中国稀土产品产量
表:2008-2012年中国稀土产品生产结构
表:通过环保审查的稀土企业名单
图:2006-2015年中国新材料领域占稀土消费的比重
图:2012年中国稀土消费结构
表:2008-2013年中国稀土出口配额
表:2012年中国稀土出口配额分配
表:2013年中国稀土出口企业名单及第一批配额
图:2006-2012年中国稀土出口量
图:2012年中国稀土分月度出口量
图:2006-2012年中国稀土出口额
表:2012年中国各类稀土元素出口量占比
表:稀土WTO争端解决基本流程
图:2005年-2012年全球稀土、铜、铁矿石、黄金四大资源产品价格走势
表:2012年中国主要稀土氧化物均价
图:2012-2013年中国氧化镝价格
图:2012-2013年中国金属镝价格
图:2012-2013年中国氧化铒价格
图:2012-2013年中国氧化铕价格
图:2012-2013年中国氧化钆价格
图:2012-2013年中国氧化钐价格
图:2012-2013年中国金属铽价格
图:2012-2013年中国氧化铽价格
图:2012-2013年中国金属钇价格
图:2012-2013年中国氧化钇价格
图:2012-2013年中国氧化铈价格
图:2012-2013年中国氧化钕价格
图:2012-2013年中国氧化镧价格
图:2012-2013年中国氧化镨价格
图:2012-2013年中国金属钕价格
图:2012-2013年中国金属镧价格
图:2012-2013年中国金属镨价格
图:2012-2013年中国金属铈价格
图:2012年中国稀土在传统消费领域中的应用结构
图:2012年中国稀土在新材料领域的应用结构
表:2006-2015年中国稀土在新材料领域的应用结构
图:稀土永磁材料中稀土元素应用比重
表:钕铁硼永磁材料与其他永磁材料磁性能对比
表:中国钕铁硼应用领域
图:2012年中国稀土永磁消费结构
图:2006-2015年中国永磁材料对稀土消耗量
表:2012年中国钕铁硼主要企业产能
图:稀土储氢材料中稀土元素应用比重
图:2006-2015年中国储氢材料对稀土的消耗量
表:2012年中国稀土储氢材料主要企业产能
图:稀土抛光材料中稀土元素应用比重
图:2006-2012年全球稀土抛光粉消费量
表:中国稀土抛光粉的主要应用领域
图:2006-2015年中国抛光材料对稀土的消耗量
表:2012年中国主要抛光材料企业产能
图:稀土发光材料中稀土元素应用比重
表:稀土发光材料应用领域
图:2012年全球稀土发光材料消费结构
图:2012年全球稀土发光材料产量分布
图:2012年中国稀土发光材料产量分布
图:2008-2015年中国稀土发光材料产量
表:2012年中国主要稀土发光材料企业产能
表:包钢稀土主营产品
表:2012年包钢稀土主要产品产能
图:2008-2012年包钢稀土营业收入及净利润
表:2011-2012年包钢稀土营业收入结构(分产品)
表:2010-2012年包钢稀土主营业务收入结构(分地区)
表:2011-2012年包钢稀土毛利率(分产品)
表:2012-2015年包钢稀土营业收入及净利润
表 :关铝股份主要下属企业主导稀土产品及产能
表:2010-2012年五矿赣州稀土资产及负债总额
表:2010-2012年五矿赣州稀土主营业务收入及利润总额
表:江西钨业主要下属稀土企业
图:2009-2015年江西钨业营业收入
图:2008-2012年中色股份营业收入及净利润
图:2008-2012年中色股份稀土业务主要盈利指标
表:广晟有色主要稀土子公司生产规模
图:2008-2012年广晟有色营业收入及净利润
表:2010-2012年广晟有色营业收入结构(分产品)
表:2010-2012年广晟有色毛利率(分产品)
图:2008-2012年厦门钨业营业收入及净利润
表:2012年厦门钨业主要稀土产品产能
表:2011-2012年厦门钨业稀土开采总量控制指标
表:2013-2015年厦门钨业营业收入及净利润
表:湖南稀土院有限责任公司主要运作稀土项目
图:2010-2015年湖南稀土新能源材料有限公司营业收入规划
表:2011-2012年盛和稀土主要产品产量
表:2009-2012年盛和稀土主要财务指标
图:2005-2011年中国稀土营业收入及净利润
图:2005-2011年中国稀土营业收入结构(分业务)
图:2010-2011年中国稀土分地区收入占比
表:有研稀土主营产品
表:2011-2013年有研稀土稀土出口配额
表:江阴加华、淄博加华稀土产品产能
表:2011-2013年江阴加华、淄博加华稀土出口配额
表:2011-2013年赣州晨光稀土产品出口配额
表:中科三环旗下主要钕铁硼生产企业
表:中科三环旗下主要稀土原料生产企业
图:2008-2012年中科三环营业收入及净利润
表:2010-2012年中科三环营业收入结构(分产品)
表:2010-2012年中科三环营业收入结构(分地区)
表:2010-2012年中科三环毛利率(分产品)
表:2012年中科三环主要稀土永磁材料技术改造项目
表:2012-2015年中科三环营业收入及净利润
图:2008-2012年宁波韵升营业收入及净利润
表:2010-2012年宁波韵升营业收入结构(分产品)
表:2010-2012年宁波韵升营业收入结构(分地区)
表:2010-2012年宁波韵升各类产品毛利率
表:2012-2015年宁波韵升营业收入及净利润
图:2008-2012年太原刚玉营业收入及净利润
表:2012年太原刚玉主要稀土材料生产公司营业收入及净利润
表:2010-2012年太原刚玉营业收入结构(分产品)
表:2010-2012年太原刚玉营业收入结构(分地区)
图:2008-2012年太原刚玉毛利率
表:2010-2012年太原刚玉各类产品毛利率
表:2013-2015年太原刚玉营业收入及净利润
图:2008-2012年科恒股份营业收入及净利润
表:2009-2012年科恒股份营业收入结构(分产品)
表:2012上半年科恒股份各地区营业收入
图:2009-2012年科恒股份毛利率
表:2009-2012年科恒股份各类产品毛利率
表:2009-2011年科恒股份各类产品产销量
表:2009-2011年科恒股份各类产品平均销售单价
图:2009-2012年科恒股份产能及产能利用率
表:科恒股份产能建设规划
表:2013-2015年科恒股份营业收入、净利润及毛利率
表:2010-2012年彩虹荧光营业收入及利润总额
表:2010-2012年彩虹荧光主要产品销量
Rare Earth Classification
Rare Earth Industry Chain
Rare Earth Ore Classification
Global Distribution of Rare Earth Reserves, 2012
Development Projects of Rare Earth Mines Overseas, 2012
Overview of Major Overseas Rare Earth Mine Development Projects
Global Rare Earth Output by Country, 2009-2012
Global Rare Earth Supply Pattern, 2015
Global Rare Earth Supply Prediction, 2015
Global Rare Earth Consumption, 2006-2015
Consumption Structure of Rare Earths in the US
Consumption Structure of Rare Earths in Japan
Consumption Structure of Rare Earths Worldwide, 2015
Global Consumption of Rare Earth Elements in Downstream Sectors, 2015
Major Rare Earth Industrial Policies Released by China, 2002-2011
Quantity of Rare Earth Mining Licences by Region in China, 2013
China’s Export Duties on Rare Earth Products, 2013
Chinese Policies on Rare Earth Industry Integration, 2011-2013
Distribution of Rare Earth Resources in China
Ore Bed Utilization of Leading Rare Earth Mines in China
Distribution of Ion Absorption Type Rare Earth Ore in China
Share of Ion Absorption Type Rare Earth Ore in China
Static Reserves-to-Output Ratio of Major Resources Worldwide
The First Batch of Rare Earth Exploitation Control Indices, 2013
China’s Output of Rare Earth Ore, 2008-2013
China’s Production Structure of Rare Earth Ore, 2008-2012
China’s Output of Rare Earth Products, 2008-2013
China’s Production Structure of Rare Earth Products, 2008-2012
Name List of Rare Earth Companies Having Passed Environmental Protection Examination
Proportion of New Material Field in Rare Earth Consumption in China, 2006-2015
China’s Rare Earth Consumption Structure, 2012
Rare Earth Export Quota of China, 2008-2013
Distribution of China’s Rare Earth Export Quotas, 2012
Name List of Chinese Rare Earth Exporting Companies and the First Batch of Quotas, 2013
China’s Export Volume of Rare Earths, 2006-2012
China’s Export Volume of Rare Earths by Month, 2012
China’s Rare Earth Export Quota, 2006-2012
Proportion of Export Volume of Different Rare Earth Elements in China, 2012
Basic Flows to Address WTO Disputes about Rare Earths
Price Trend of Global Four Major Resources, i.e., Rare Earth, Copper, Iron Ore and Gold, 2005-2012
Average Price of Key Rare Earth Oxides in China, 2012
Price of Dy Oxide of China. 2012-2013
Price of Dy Metal of China, 2012-2013
Price of Er Oxide of China, 2012-2013
Price of Eu Oxide of China, 2012-2013
Price of Gd Oxide of China, 2012-2013
Price of Sm Oxide of China, 2012-2013
Price of Tb Metal of China, 2012-2013
Price of Tb Oxide of China, 2012-2013
Price of Yt Metal of China, 2012-2013
Price of Yt Oxide of China, 2012-2013
Price of Ce Oxide of China, 2012-2013
Price of Nd Oxide of China, 2012-2013
Price of La Oxide of China, 2012-2013
Price of Pr Oxide of China, 2012-2013
Price of Nd Metal of China, 2012-2013
Price of La Metal of China, 2012-2013
Price of Pr Metal of China, 2012-2013
Price of Ce Metal of China, 2012-2013
Structure of Rare Earth Application in Traditional Consumption Fields in China, 2012
Structure of Rare Earth Application in the Field of New Materials in China, 2012
Structure of Rare Earth Application in the Field of New Materials in China, 2006-2015
Application of Rare Earth Elements in Rare-earth Permanent Magnet Material
Performance Comparison between NdFeB Permanent Magnetic Material and Other Permanent Magnetic Materials
Applications of NdFeB in China
Consumption Structure of Rare Earth Permanent Magnets in China, 2012
Demand of Permanent Magnetic Materials for Rare Earth in China, 2006-2015
Production Capacity of Leading NdFeB Companies in China, 2012
Application of Rare Earth Elements in Rare-earth Hydrogen Storage Material
Demand of Hydrogen Storage Materials for Rare Earth in China, 2006-2015
Production Capacities of Key Rare Earth Hydrogen Storage Material Companies in China, 2012
Application of Rare Earth Elements in Rare-earth polishing material
Global Consumption of Rare Earth Polishing Powder, 2006-2012
Major Applications of Rare Earth Polishing Powder in China
Demand of Polishing Materials for Rare Earth in China, 2006-2015
Production Capacities of Leading Polishing Material Companies in China, 2012
Application of Rare Earth Elements in Rare-earth Luminescent Material
Application of Rare-Earth luminescent Material
Global Consumption Structure of Rare Earth Fluorescent Materials, 2012
Global Distribution of Rare Earth Fluorescent Material Output, 2012
China’s Distribution of Rare Earth Fluorescent Material Output, 2012
China’s Output of Rare Earth Fluorescent Materials, 2008-2015
Production Capacities of Key Rare Earth Fluorescent Material Companies in China, 2012
Prime Products of Inner Mongolia Baotou Steel Rare-earth (Group)
Capaciy of Major Products of Inner Mongolia Baotou Steel Rare-Earth(Group), 2012
Revenue and Net Income of Inner Mongolia Baotou Steel Rare-Earth(Group), 2008-2012
Revenue Structure of Inner Mongolia Baotou Steel Rare-Earth(Group) by Product, 2011-2012
Revenue Structure of Inner Mongolia Baotou Steel Rare-Earth(Group) by Region, 2010-2012
Gross Margin of Inner Mongolia Baotou Steel Rare-Earth(Group) by Product, 2011-2012
Revenue and Net Income of of Inner Mongolia Baotou Steel Rare-Earth(Group), 2012-2015
Leading Rare Earth Products and Production Capacities of Key Subsidiaries under Shanxi Guanlu Co.,Ltd.
Assets and Total Liabilities of China Minmetals Rare Earth Co., Ltd, 2010-2012
Operating Revenue and Total Profit of China Minmetals Rare Earth Co., Ltd, 2010-2012
Major Rare Earth Companies under Jiangxi Tungsten Industry Group Co., Ltd
Revenue of Jiangxi Tungsten Industry Group Co., Ltd, 2009-2015
Revenue and Net Income of China Nonferrous Metal Industry's Foreign Engineering and Construction Co.,Ltd., 2008-2012
Profit Indices on Rare Earth Business ofChina Nonferrous Metal Industry's Foreign Engineering and Construction Co.,Ltd., 2008-2012
Production Scale of Major Rare Earth Subsidiaries of Guangdong Rising Nonferrous Metals Group
Revenue and Net Income of Rising Nonferrous Metals Share Co., Ltd., 2008-2012
Revenue Structue of Rising Nonferrous Metals Share Co., Ltd.by Product, 2010-2012
Gross Margin of Rising Nonferrous Metals Share Co., Ltd.by Product, 2010-2012
Revenue and Net Income of Xiamen Tungsten Co.,Ltd, 2008-2012
Capacity of Major Rare Earth Products of Xiamen Tungsten Co.,Ltd, 2012
Rare Earth Exploitation Control Indices of Xiamen Tungsten Co., Ltd., 2011-2012
Revenue and Net Income of Xiamen Tungsten Co.,Ltd, 2013-2015
Major Rare Earth Projects of Hunan Rare Earth Metal & Material Institute
Revenue Planning of Hunan Rare Earth New Energy Material Co., Ltd., 2010-2015
Output of Major Products of Leshan Shenghe Rare Earth Technology Co., Ltd, 2011-2012
Key Financial Indices of Leshan Shenghe Rare Earth Technology Co., Ltd., 2009-2012
Revenue and Net Income of China Rare Earth Holdings Ltd., 2005-2011
Revenue Structure of China Rare Earth Holdings by Business, 2005-2011
Revenue Structure of China Rare Earth Holdings Ltd by Region, 2010-2011
Main Products of Grirem Advanced Materials
Rare Earth Export Quotas of Grirem Advanced Materials Co., Ltd., 2011-2013
Rare Earth Product Capacities of Jiangyin Jiahua Advanced Material Co., Ltd and Zibo Jiahua Advanced Material Resource Co., Ltd
Rare Earth Export Quotas of Jiangyin Jiahua Advanced Material Co., Ltd and Zibo Jiahua Advanced Material Resource Co., Ltd, 2011-2013
Export Quotas of Rare Earth Products of Gan Zhou Chen Guang Rare Earths New Material Shares Co.,Ltd., 2011-2013
Key NdFeB Manufacturers Affiliated to Zhong Ke San Huan
Key Rare Earth Raw Materials Manufacturers Affiliated to Zhong Ke San Huan
Revenue and Net Income of Beijing Zhong Ke San Huan High-Tech, 2008-2012
Revenue Breakdown of Beijing Zhong Ke San Huan High-Tech by Product, 2010-2012
Revenue Breakdown of Beijing Zhong Ke San Huan High-Tech by Region, 2010-2012
Gross Margin of Beijing Zhong Ke San Huan High-Tech by Product, 2010-2012
Key Rare Earth Permanent Magnetic Material Technology Transformation Projects of Beijing Zhong Ke San Huan High-Tech, 2012
Revenue and Net Income of Beijing Zhong Ke San Huan High-Tech, 2012-2015
Revenue and Net Income of Ningbo Yunsheng Co.,Ltd., 2008-2012
Revenue Breakdown of Ningbo Yunsheng Co.,Ltd by Product, 2010-2012
Revenue Breakdown of Ningbo Yunsheng Co.,Ltd by Region, 2010-2012
Gross Margin of Ningbo Yunsheng Co., Ltd by Product, 2010-2012
Revenue and Net Income of Ningbo Yunsheng Co., Ltd., 2012-2015
Revenue and Net Income of Taiyuan Twin Tower Alomllum Oxide Co., Ltd., 2008-2012
Revenue and Net Income of Key Rare Earth Material Production Companies under Taiyuan Twin Tower Alomllum Oxide Co., Ltd., 2012
Revenue Breakdown of Taiyuan Twin Tower Alomllum Oxide Co., Ltd by Product, 2010-2012
Revenue Breakdown of Taiyuan Twin Tower Alomllum Oxide Co., Ltd by Region, 2010-2012
Gross Margin of Taiyuan Twin Tower Alomllum Oxide Co., Ltd, 2008-2012
Gross Margin of Taiyuan Twin Tower Alomllum Oxide Co., Ltd by Product, 2010-2012
Revenue and Net Income of Taiyuan Twin Tower Alomllum Oxide Co., Ltd., 2013-2015
Revenue and Net Income of Jiangmen Kanhoo Industry Co., Ltd., 2008-2012
Revenue Breakdown of Jiangmen Kanhoo Industry Co., Ltd by Product, 2009-2012
Revenue Breakdown of Jiangmen Kanhoo Industry Co., Ltd by Region, H1 2012
Gross Margin of Jiangmen Kanhoo Industry Co., Ltd, 2009-2012
Gross Margin of Jiangmen Kanhoo Industry Co., Ltd by Product, 2009-2012
Output and Sales Volume of Various Products of Jiangmen Kanhoo Industry Co., Ltd, 2009-2011
Average Selling Price of Various Products of Jiangmen Kanhoo Industry Co., Ltd, 2009-2011
Production Capacity and Capacity Utilization of Jiangmen Kanhoo Industry Co., Ltd, 2009-2012
Capacity Construction Planning of Jiangmen Kanhoo Industry Co., Ltd
Revenue, Net Income and Gross Margin of Jiangmen Kanhoo Industry Co., Ltd, 2013-2015
Revenue and Total Profit of Shannxi IRICO Fluorescent Materials Co., Ltd., 2010-2012
Sales Volume of Major Products of Shannxi IRICO Fluorescent Materials Co., Ltd., 2010-2012
如果这份报告不能满足您的要求,我们还可以为您定制报告,请 留言说明您的详细需求。
|