|
|
|
报告导航:研究报告—
制造业—工业机械
|
|
2012-2013年全球及中国工业气体行业研究报告 |
 |
字数:2.6万 |
页数:110 |
图表数:104 |
|
中文电子版:8000元 |
中文纸版:4000元 |
中文(电子+纸)版:8500元 |
|
英文电子版:2100美元 |
英文纸版:2200美元 |
英文(电子+纸)版:2400美元 |
|
编号:ZYW146
|
发布日期:2013-04 |
附件:下载 |
 |
|
|
《2012-2013年全球及中国工业气体行业研究报告》包括以下内容:- 全球工业气体市场
- 中国工业气体市场
- 全球工业气体产业与中国工业气体产业
- 12家工业气体厂家研究
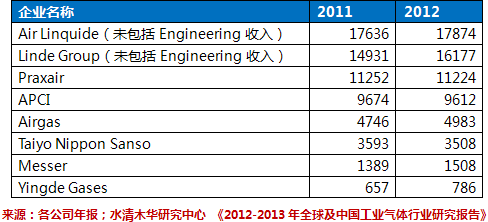
工业气体主要包括oxygen, nitrogen, argon,acetylene,carbon dioxide,hydrogen,carbon monoxide。2012年全球工业气体市场规模大约为698亿美元,这其中不包括大型企业内部生产的工业气体。工业气体的下游客户主要是化工、炼油(Refining)、钢铁、焊接、玻璃、电子、医疗、食品领域。前三者所占比例超过50%,这三者都属于成熟产业,比较稳定。 2012年全球工业气体市场规模同比2011年增长了4.6%,较2011年的增幅有所减少。主要原因是中国钢铁企业普遍亏损,减少了产量,导致工业气体市场需求减弱。2013年以来,中国房地产市场复苏迹象明显,拉动中国经济,尤其是钢铁和重化工领域得以强劲复苏。同时,北美地区shale gas开发规模逐渐增大,依靠廉价天然气也带动了一批化工企业在美国本土建立新工厂。北美和中国是未来工业气体的主要驱动市场,预计2013年全球工业气体市场规模将达746亿美元,同比2012年增长6.9%。 在欧美发达地区,80%的厂家或机构是Outsourcing,只有20%的厂家是Captive。中国工业气体市场比较独特,2012年中国53%的厂家或机构仍然是Captive,只有47%的是Outsourcing,这意味着中国工业气体市场潜力很大。2012年中国工业气体市场规模大约为79.8亿美元,预计2013年将达到86.3亿美元。中国工业气体市场驱动力主要来自钢铁、煤化工和炼油等行业。钢铁企业会越来越多地将工业气体Outsourcing。 煤化工(Coal-Chemicals)在2011年6月被中国政府叫停,但是中国对石油、天然气和烯烃这三种商品的对外依存度越来越高,政府不得不在2013年3月开始重新批准煤化工项目,这些项目将拉动工业气体市场的增长。2013年3月,已经有10个煤化工项目获得政府批准,而2012年申请的煤化工项目高达104个。 近年来中国空气雾霾情况严重,部分原因是汽车用油纯度不够,政府不得不加大投入来提高汽车用油的品质。中国的原油无论是进口还是国产,都是高硫石油(high sulfur crude oil),要降低含硫量,就必须加氢纯化(H2 Deoxo)。目前沿海大型炼油厂基本具备了生产国Ⅳ、国V汽油的能力,内陆地区相对欠缺。中石化旗下大型炼油厂生产国Ⅳ、国V汽油的能力较强,约占其总炼能的64%;中石油进度相对缓慢,只有23%左右的炼能可产国Ⅳ国V。随着国家成品油质量升级的推进,目前西北等内陆地区炼油厂也在加紧筹备加氢装置,为2014年全国置换国IV汽油做准备。这对擅长氢气制造的厂家来说是一个巨大的市场,比如APCI。 工业气体产业两极分化严重,前四大厂家占据了78%的市场规模,而有近万家企业只占据了不到20%的市场规模。这是因为气体比较难运输,很多小厂家的气体需求量很低,大型企业不愿意为其提供工业气体。中国的小型工业气体厂家尤其多,数量大约在3000家左右。近年来中国也有个别工业气体厂家摸索出一条高速发展的道路,这其中以香港上市的盈德气体为代表,2008年其营业收入只有14亿元,而2012年就逼近50亿,预计2013年将超过60亿。还有一家China Gas Industry Investment Holdings也在积极谋求上市。 2011-2012年全球工业气体厂家收入 (百万美元)
The report highlights the followings: Global Industrial Gas Market China Industrial Gas Market Global and China Industrial Gas Industry 12 Industrial Gas Companies Industrial
gases mainly refer to oxygen, nitrogen, argon, acetylene, carbon
dioxide, hydrogen, and carbon monoxide. In 2012, the market size of
industrial gases worldwide approximated USD69.8 billion, of which, it
was exclusive of the gases generated by large enterprises themselves.
The downstream customers of industrial gases concentrate in chemical,
refining, iron & steel, welding, glass, electronics, healthcare and
food industries, with the combined share of the first three surpassing
50% and keeping stable. In 2012, the market size of global
industrial gas industry increased by 4.6% year-on-year, with the growth
rate down somewhat against that in 2011. The reduction mainly came as
the decreased output in China iron & steel industry because of
massive loss-making. Since 2013, due to the reviving real estate market,
China has witnessed robust recovery in economy, especially in iron
& steel and heavy chemical sectors. In the meantime, the North
American region has accelerated its development of shale gas,
encouraging a good many of chemical enterprises to establish new plants
in America given the consideration of low-priced natural gas. North
America and China are expected to become the key engines for the
development of industrial gas. And the estimation shows that the global
industrial gas market scale in 2013 will surge by 6.9% year-on-year to
USD74.6 billion. In the developed Euro-Americas, there are
80% outsourcing businesses or plants, and the rest 20% are Captive. But
it is not true in China, where 53% businesses or plants in 2012 were
still Captive, while only 47% were outsourcing ones. It indicates that
China bears a huge potential in the sector. In 2012, the industrial gas
market scale in China was around USD7.98 billion, with the targeted
figure in 2013 reaching USD8.63 billion. In China, iron & steel,
coal chemical and refining industries are engines of the industrial gas
market. And more and more iron & steel companies are expected to
outsource their industrial gas business. In June, 2011, the
Chinese Government ordered to suspend coal chemical industry, forcing
China to increase its dependence on the import of petroleum, natural gas
and olefin. Given this, the central government called for retrieving
the operation of coal chemical projects which are expected to fuel the
growth of industrial gas market from Mar.2013. As of Mar. 2013, some 10
coal chemical projects had been approved out of the 104 ones in 2012
application. In recent years, China has been frequently engulfed
by haze, contributing in part to the substandard auto gas in purity.
Thus, the Chinese government has to respond with hefty investment in
this regard. In China, either imported or homemade crude oil is high
sulfur crude oil, and H2 Deoxo is the only solution to reduce the sulfur
content. At present, large coastal refining plants are basically
equipped with the capability to produce national-standard Ⅳ and V
gasoline, while their counterparts in landlocked regions fall behind.
Large refining plants under Sinopec are competitive in producing
national-standard Ⅳ and V gasoline, with the capacity making up 64% of
the total compared to the 23% mark of CNPC. With China’s advance in
producing qualified refined oil products, refineries in inland regions
such as Northwest China are also pressing ahead to prepare for
hydrogenation units, laying foundation for the nationwide replacement
for IV gasoline. It is no doubt a huge potential for businesses
specializing in hydrogen production such as APCI. The
industrial gas industry witnessed critical disparity, with the top 4
industrial players dominating 78% market share, while a proximate number
of 10,000 businesses only occupying 20%. The reason attributes to the
fact that the gas transportation is not easy, the demand of many
small-sized industrial players is quite limited, coupled that large
businesses are reluctant to provide industrial gases for these small
ones. In China, small-scaled industrial gas producers amount to as many
as 3,000. In recent years, a few industrial gas companies tried their
luck to find a high-speed development path, represented by Yingde Gases
(listed in HK) whose revenue in 2012 soared to nearly RMB5 billion from
RMB1.4 billion in 2008, with the expected figure in 2013 surpassing RMB6
billion. Another case in point was China Gas Industry Investment
Holdings which was seeking for listing. Revenue of Major Industrial Gas Businesses Worldwide, 2011-2012 (USD mln)
第一章 工业气体简介
1.1 工业气体定义
1.2 工业气体的制造
第二章 全球工业气体市场
2.1 全球工业气体市场规模
2.2 工业气体下游分布
2.3 全球钢铁产业
2.4 中国工业气体市场
2.5 中国钢铁产业
2.6 中国炼油行业
2.7 中国煤化工产业
2.7.1 中国煤化工产业驱动力
2.7.2 中国煤化工投资规模
2.7.3 中国煤化工项目分析
第三章 工业气体产业
3.1 全球工业气体厂家排名
3.2 中国工业气体产业概况
3.3 主要工业气体厂家的中国战略
3.3.1 Air Liquide
3.3.2 Praxair
3.3.3 Linde
3.3.4 APCI
3.4 中国工业气体产业格局
3.5 中国ASU设备产业
第四章 主要工业气体厂家研究
4.1 LINDE GROUP
4.1.1 气体部门
4.1.2 工程部门
4.1.3 医疗保健部门
4.1.4 在华业务
4.2 AIR LINQUIDE
4.2.1 气体和服务部门
4.2.2 大型业务
4.2.3 医疗保健部门
4.2.4 在华业务
4.3 PRAXAIR
4.3.1 在华业务
4.4 APCI
4.4.1 在华业务
4.5 TAIYO NIPPON SANSO
4.5.1 在华业务
4.6 AIRGAS
4.7 MESSER
4.7.1 在华业务
4.8 盈德气体
4.9 杭氧股份
4.10 中国气体投资
4.11 秦风气体
4.12 上海加力气体
1. Introduction to Industrial Gas
1.1 Definition
1.2 Production
2. Global Industrial Gas Market
2.1 Market Scale
2.2 Downstream Distribution
2.3 Global Iron & Steel Industry
2.4 China Industrial Gas Market
2.5 China Iron & Steel Industry
2.6 China Oil Refining Industry
2.7 China Coal Chemical Industry
2.7.1 Engines for Industrial Development
2.7.2 Scale of Industrial Investment
2.7.3 Coal Chemical Projects
3. Industrial Gas Industry
3.1 Ranking of Global Industrial Gas Companies
3.2 Overview of China Industrial Gas Industry
3.3 Strategies of Major Industrial Gas Companies in China
3.3.1 Air Liquide
3.3.2 Praxair
3.3.3 Linde
3.3.4 APCI
3.4 China Industrial Gas Industry Pattern
3.5 China ASU Equipment Industry
4. Major Industrial Gas Companies
4.1 Linde Group
4.1.1 Gases Division
4.1.2 Engineering Division
4.1.3 Healthcare Division
4.1.4 Business In China
4.2 Air Linquide
4.2.1 Gases & Service Division
4.2.2 Large Operations
4.2.3 Healthcare Division
4.2.4 Business in China
4.3 Praxair
4.3.1 Business in China
4.4 APCI
4.4.1 Business in China
4.5 Taiyo Nippon Sanso
4.5.1 Business in China
4.6 Airgas
4.7 Messer
4.7.1 Business in China
4.8 Yingde Gases
4.9 Hangzhou Hangyang
4.10 China Gas Industry Investment Holdings
4.11 Qinfeng Gases
4.12 Chinllenge Gases
图:ASU 工艺流程
图:2009-2015年全球工业气体市场规模
图:2012年全球工业气体市场(按地区)分布
图:2012年全球工业气体(按产品)市场份额
图:2012年工业氧气(按行业)市场份额
图:2013-2022 年在产大型制氧设备(按地区)分布
图:2012年工业氮气(按行业)市场份额
图:2012年工业氩气(按行业)市场份额
图:2012年工业氢气(按行业)市场份额
图:2012年工业二氧化碳(按行业)市场份额
图:2005-2012年全球粗钢产量
图:2008-2015年中国工业气体市场规模
图:2008-2015年中国工业气体(按行业)市场份额
图:2010-2012年中国商业气体价格走势
图:2006-2013年中国粗钢产量
表:2011-2012年中国19家主要钢铁企业产量
表:2012年中国前30大钢铁企业营业收入
表:2010-2012年中石化炼油量
图:煤化工分类
表:2011-2012年全球工业气体厂家营业收入排名
表:2011-2012年全球主要工业气体厂家营业利润率
图:2012 Air Liquide中国区(按终端市场)收入分布
图:2007/2012/2015年中国工业气体(按供应渠道)收入分布
图:2008/2012年中国工业气体现场供气市场主要厂家市场占有率
图:2004年中国ASU设备主要厂家市场占有率
图:2011年中国ASU设备主要厂家市场占有率
图:2007-2013年Linde Group营业收入与营业利润率
图:Linde Group组织结构
图:2008-2012年Linde Group气体部门营业收入与营业利润率
图:2008-2012年Linde Group(按地区)营业收入
图:2011-2012年Linde Group(按产品)营业收入
表:2008-2012年Linde Group气体部门(按地区)营业利润率
图:2008-2012年Linde Group(按业务)营业收入
图:2008-2012年Linde Group工程部门营业收入与营业利润率
图:2009-2012年Linde Group工程部门(按地区)营业收入
图:2009-2012年Linde Group工程部门(按地区)订单量分布
图:2009-2012年Linde Group工程部门(按业务)营业收入
图:2009-2012年Linde Group工程部门(按业务)订单量
图:Linde Group中国地域分布
图:2007-2013年Air Linquide营业收入与营业利润率
图:2012年Air Linquide员工数量(按地区)分布
图:2006-2012年Air Linquide(按业务)营业收入分布
图:2012年Air Linquide (按终端市场)营业收入
图:2012年Air Linquide 气体和服务部门(按地区)营业收入分布
图:2012年Air Linquide 欧洲气体和服务部门(按终端市场)营业收入分布
图:2012年Air Linquide 美洲气体和服务部门(按终端市场)营业收入分布
图:2012年Air Linquide 亚太气体和服务部门(按终端市场)营业收入分布
图:2012年Air Linquide 气体和服务部门(按终端市场)营业收入分布
图:2012年Air Linquide 大型业务(按业务)营业收入分布
图:2012年Air Linquide 大型业务(按终端市场)营业收入分布
图:2012年Air Linquide 医疗保健部门(按终端市场)营业收入分布
图:2012年Air Linquide 电子部门(按终端市场)营业收入分布
图:2012年底Air Linquide 工程建筑部门(按业务)订单储备分布
图:2006-2013年Praxair收入与营业利润率
图:2008、2010、2012年Praxair(按终端市场)营业收入分布
图:2008、2010、2012年Praxair(按地区)营业收入分布
图:2008、2010、2012年Praxair(按业务)营业收入分布
图:2012年Praxair北美市场表现
图:2012年Praxair南美市场表现
图:2012年Praxair欧洲市场表现
图:2012年Praxair亚洲市场表现
图:2012年Praxair中东与俄罗斯市场表现
图:2012年底Praxair(按地区) 订单储备分布
图:2006-2013年APCI营业收入与营业利润率
图:2008-2012年APCI(按地区)营业收入分布
图:20082-2012年APCI(按业务)营业收入分布
图:2008-2012年APCI 商业气体部门营业收入和营业利润率
图:2008-2012年APCI工业用气部门营业收入和营业利润率
图:2008-2012年APCI电子和高性能材料部门营业收入和营业利润率
图:2012年APCI 电子和高性能材料部门(按终端市场)营业收入分布
图:2012年APCI(按地区)营业收入分布
图:2012年APCI(按终端市场)营业收入分布
图:2012年APCI(按产品)营业收入分布
表:2013-2015年APCI 重点工程项目
图:APCI中国区最新工程项目
图:大阳日酸组织结构
图:2007-2013年Taiyo Nippon Sanso营业收入与营业利润率
图:2010-2012年Taiyo Nippon Sanso(按业务)营业收入分布
表:2011-2012财年Taiyo Nippon Sanso(按地区)营业收入
图:2007-2013年Airgas营业收入与营业利润率
图:1988-2012年Airgas收购情况
图:Airgas美国地域分布
图:2012年Airgas(按终端市场)营业收入分布
图:2012年Airgas(按业务)营业收入分布
图:Airgas供应链
图:Messer Group 全球组织结构
表:2008-2011年Messer集团营业收入与EBITDA
图:2008-2011年Messer集团(按地区)营业收入
图:2008-2011年Messer集团(按地区)员工人数
图:2011年Messer集团(按产品)营业收入分布
图:2011年Messer集团(按业务)营业收入分布
图:Messer China 组织结构
图:Messer China(按产品、业务)营业收入分布
图:Messer China 业务地域分布
图:2008-2013年盈德气体营业收入与营业利润率
图:2009-2012年盈德气体(按业务)营业收入分布
图:2011/2012年上半年盈德气体商用气体产量
图:2009-2012年盈德气体产能及设施全国分布
图:2012年盈德气体在建基站分布
图:2008-2013年杭氧股份营业收入与营业利润率
图:2009-2012年杭氧股份(按产品)营业收入分布
表:2009-2012年杭氧股份(按产品)毛利率
图:2009-2012年杭氧股份(按产品)毛利分布
ASU Process Chart
Global Industrial Gas Market Size, 2009-2015E
Global Industrial Gas Market by Region, 2012
Market Share of Global Industrial Gas by Product, 2012
Industrial Oxygen Market Share by Industry, 2012
Distribution of Large-sized Oxygen Generating Plants by Region, 2013-2022E
Industrial Nitrogen Market Share by Industry, 2012
Industrial Argon Market Share by Industry, 2012
Industrial Hydrogen Market Share by Industry, 2012
Industrial Carbon Dioxide Market Share by Industry, 2012
Global Crude Steel Output, 2005-2012
Market Scale of Chinese Industrial Gas Industry, 2008-2015E
Market Share of Chinese Industrial Gas by Industry, 2008-2015E
Price Trend of Commercial Gases in China, 2010-2012
China Crude Steel Output, 2006-2013
Output of China’s Major 19 Iron & Steel Companies, 2011-2012
Revenue of China’s Top 30 Iron & Steel Companies, 2012
Oil Refining Amount of Sinopec, 2010-2012
Classification of Coal Chemicals
Ranking of World’s Industrial Gas Businesses by Revenue, 2011-2012
Operating Margin of World’s Major Industrial Gas Businesses, 2011-2012
Revenue of Air Liquide in China by Terminal Market, 2012
Revenue of Industrial Gas in China by Supply Channel, 2007/2012/2015
Market Share of Major Busineses in China Industrial Gas On-Site Supply Market, 2008/2012
Market Share of Major ASU Producers in China, 2004
Market Share of Major ASU Producers in China, 2011
Revenue and Operating Margin of Linde Group, 2007-2013
Organization of Linde Group
Revenue and Operating Margin of Linde Group from Gas Business Division, 2008-2012
Revenue of Linde Group by Region, 2008-2012
Revenue of Linde Group by Product, 2011-2012
Operating Margin of Linde Group from Engineering Business Division by Region, 2008-2012
Revenue of Linde Group by Business, 2008-2012
Revenue and Operating Margin of Linde Group from Engineering Business Division, 2008-2012
Revenue of Linde Group from Engineering Business Division by Region, 2009-2012
Order Backlog of Linde Group from Engineering Business Division by Region, 2009-2012
Revenue of Linde Group from Engineering Business Division by Business, 2009-2012
Order Backlog of Linde Group from Engineering Business Division by Business, 2009-2012
Regional Presence of Linde Group in China
Revenue and Operating Margin of Air Linquide, 2007-2013
Distribution of Employees of Air Linquide by Region, 2012
Revenue of Air Linquide by Business, 2006-2012
Revenue of Air Linquide by Terminal Market, 2012
Revenue of Air Linquide from Gases & Service Business Division by Region, 2012
Revenue of Air Linquide from European Gases & Service Business Division by Terminal Market, 2012
Revenue of Air Linquide from American Gases & Service Business Division by Terminal Market, 2012
Revenue of Air Linquide from Asia-Pacific Gases & Service Business Division by Terminal Market, 2012
Revenue of Air Linquide from Gases & Service Business Division by Terminal Market, 2012
Revenue of Air Linquide from Large-scale Business by Business, 2012
Revenue of Air Linquide from Large-scale Business by Terminal Market, 2012
Revenue of Air Linquide from Healthcare Business Division by Terminal Market, 2012
Revenue of Air Linquide from Electronic Business Division by Terminal Market, 2012
Order Backlog of Air Linquide from Engineering Construction Business Division by Business, Year-End 2012
Revenue and Operating Margin of Praxair, 2006-2013
Revenue of Praxair by Terminal Market , 2008/2010/2012
Revenue of Praxair by Region, 2008/2010/2012
Revenue of Praxair by Business, 2008/2010/2012
Business Performance of Praxair in North America, 2012
Business Performance of Praxair South America, 2012
Business Performance of Praxair in Europe, 2012
Business Performance of Praxair in Asia, 2012
Business Performance of Praxair in the Middle East and Russia, 2012
Order Backlog of Praxair by Region, Year-End 2012
Revenue and Operating Margin of APCI, 2006-2013
Revenue of APCI by Region, 2008-2012
Revenue of APCI by Business, 2008-2012
Revenue and Operating Margin of APCI from Commerical Gases, 2008-2012
Revenue and Operating Margin of APCI from Industrial Gases, 2008-2012
Revenue and Operating Margin of APCI from Electronic & High-Performance Material Business, 2008-2012
Revenue from Electronic & High-Performance Material Business of APCI by Terminal Market, 2012
Revenue of APCI by Region, 2012
Revenue of APCI by Terminal Market, 2012
Revenue of APCI by Product, 2012
Major Projects of APCI, 2013-2015E
New Projects of APCI in China
Organization of Taiyo Nippon Sanso
Revenue and Operating Margin of Taiyo Nippon Sanso, 2007-2013
Revenue of Taiyo Nippon Sanso by Business, 2011-2012
Revenue of Taiyo Nippon Sanso by Region, FY2011-FY2012
Revenue and Operating Margin of Airgas, 2007-2013
Acquisition Cases of Airgas, 1988-2012
Geographical Distribution of Airgas in America
Revenue of Airgas byTerminal Market, 2012
Revenue of Airgas by Business, 2012
Supply Chain of Airgas
Organization of Messer Group
Revenue and EBITDA of Messer, 2008-2011
Revenue of Messer by Region, 2008-2011
Workforce of Messer by Region, 2008-2011
Revenue of Messer by Product, 2011
Revenue of Messer by Business, 2011
Organization of Messer China
Revenue of Messer China by Product/Business
Business Performance of Messer China by Region
Revenue and Operating Margin of Yingde Gases, 2008-2013
Revenue of Yingde Gases by Business, 2009-2012
Commerical Gas Output of Yingde Gases, 2011-2012H1
Capacity and Equipment Distribution of Yingde Gases Nationwide, 2009-2012
Base Stations under Construction of Yingde Gases, 2012
Revenue and Operating Margin of Hangzhou Hangyang, 2008-2013
Revenue of Hangzhou Hangyang by Product, 2009-2012
Gross Margin of Hangzhou Hangyang by Product, 2009-2012
Gross Profit of Hangzhou Hangyang by Product, 2009-2012
如果这份报告不能满足您的要求,我们还可以为您定制报告,请 留言说明您的详细需求。
|