|
|
|
报告导航:研究报告—
生命科学—制药医疗
|
|
2012-2015年中国中成药产业研究报告 |
 |
字数:3.5万 |
页数:87 |
图表数:117 |
|
中文电子版:8000元 |
中文纸版:4000元 |
中文(电子+纸)版:8500元 |
|
英文电子版:2100美元 |
英文纸版:2200美元 |
英文(电子+纸)版:2400美元 |
|
编号:WLQ001
|
发布日期:2013-04 |
附件:下载 |
 |
|
|
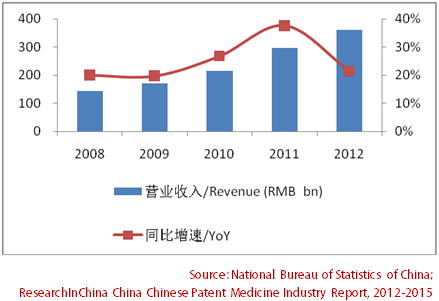
近几年,中国中成药行业运行情况良好。2008-2012年,中成药行业营业收入从1420亿增加到3600亿,年均复合增长率为26.2%。同期,中成药行业利润总额的年均复合增长率为26.6%;其毛利率均高于医药制造业的平均水平。 既《关于促进中医药服务贸易发展的若干意见》、《中医药事业发展“十二五”规划》等多项利好中医药发展政策的出台,2013年3月新版《国家基本药物目录》又将中成药的数目从2009年的102种增加到203种,数量占比从33%增加到39%,因此,预计未来5年中国中成药市场需求有望继续快速成长。 图:2008-2012年中国中成药行业营业收入及同比增速
心血管类中成药、抗肿瘤类中成药、呼吸系统类中成药、肌肉骨骼类中成药、消化系统疾病类中成药是中国医院终端中成药市场的前五大用药。其中,心血管疾病类中成药的市场份额最大,2006-2012年保持37%左右份额。心脑血管疾病用中药的优秀企业有山东步长制药股份有限公司(有冠心舒通胶囊、脑心舒口服液等产品)、天津天士力集团有限公司(有复方丹参滴丸、养血清脑颗粒等产品)、金陵药业股份有限公司(有脉络宁注射液、脉络宁口服液等产品)、石家庄以岭药业股份有限公司(有通心络胶囊、参松养心胶囊等产品)等。 随着中国中成药日益获得国际认可,加之中成药行业高利润刺激(一般营业利润率在70%以上)和化学制药行业本身发展瓶颈所限,国外相关企业和机构如诺华、默沙东、强生、葛兰素史克等开始纷纷以合资、独资等方式涉足中成药相关市场。如2013年初,葛兰素史克宣布在中国尝试用中药成分进行药物研发。 水清木华研究中心《2012-2015年中国中成药产业研究报告》主要包括以下几个内容:- 中国中成药产业政策、发展现状、区域市场、进出口、发展趋势等;
- 中国中成药上游原料市场发展现状及中国植物提取物现状、进出口等;
- 中国中成药细分市场,包括心脑血管疾病中成药、抗肿瘤疾病中成药、呼吸系统疾病中成药等;
- 中国10家主要中成药生产企业的经营情况、营收构成、毛利率及盈利预测等。
In recent years, China’s Chinese patent medicine industry has been
running in good condition, with the revenue increasing from RMB 142
billion in 2008 to RMB 360 billion in 2012 at a CAGR of 26.2%. Over the
same period, the total profit maintained a CAGR of 26.6%, and the gross
margin remained higher than the average level of the overall
pharmaceutical industry. In succession to the Opinions on
Promoting the Development of Traditional Chinese Medicine Services and
Trade, the Twelfth Five-Year Plan on the Development of Traditional
Chinese Medicine and other favorable policies, the new National
Essential Drugs List published in March 2013 increased the number of
Chinese patent medicine from 102 in 2009 to 203, and the proportion in
total quantity from 33% to 39%. As a result, China’s Chinese patent
medicine market demand is expected to grow rapidly in the next five
years. Revenue and YoY Growth Rate of China’s Chinese Patent Medicine Industry, 2008-2012
Chinese
patent medicine for the treatment of cardiovascular and cerebrovascular
diseases, tumor diseases, respiratory system diseases, musculoskeletal
diseases and digestive system diseases are top five categories of
Chinese patent medicine for hospitals in China. The Chinese patent
medicine for the treatment of cardiovascular and cerebrovascular
diseases occupies the largest market share, which remained at around 37%
in 2006-2012. Outstanding enterprises producing Chinese patent medicine
for the treatment of cardiovascular and cerebrovascular diseases
include Shandong Buchang Pharma (products include Guanxin Shutong
Capsule and Naoxinshu Oral Solution), Tianjin Tasly Group (products
include Compound Danshen Dripping Pills and Yangxue Qingnao Granule),
Jinling Pharmaceutical (products include Mailuoning Injection and
Mailuoning Oral Solution), Shijiazhuang Yiling Pharmaceutical (products
include Tongxinluo Capsule and Shensong Yangxin Capsule), etc. As
China's Chinese patent medicine is gaining international recognition,
coupled with the incentive from high profit (the operating margin is
generally above 70%) and the development bottleneck of the chemical
pharmaceutical industry, foreign enterprises and institutions such as
Novartis, Merck, Johnson & Johnson, GSK have set foot in the Chinese
patent medicine market through joint ventures and wholly-owned
subsidiaries. For example, in early 2013, GSK announced to carry out
drug development trying to use traditional Chinese medicinal ingredients
in China. China Chinese Patent Medicine Industry Report, 2012-2015 of ResearchInChina mainly includes the following contents:
Industrial policies, development status, regional market, import and
export, development trend of China’s Chinese patent medicine industry;
Development status of the raw material market of China’s Chinese patent
medicine industry as well as the development status and import &
export of China’s plant extracts;
China’s Chinese patent medicine market segments, including Chinese
patent medicine for the treatment of cardiovascular and cerebrovascular
diseases, tumor diseases, respiratory system diseases, etc.;
Operation, revenue structure, gross margin and profit forecast of
China's 10 major Chinese patent medicine production enterprises.
第一章 中成药概述
1.1定义及特征
1.2分类
1.2.1 按剂型分类
1.2.2 按药理分类
1.2.3 中成药产业链
第二章 中成药产业运行环境分析
2.1相关政策
2.1.1 国内相关政策
2.1.2国外相关政策
2.2 消费趋势
2.3产业趋势
第三章 中成药产业市场分析
3.1发展现状
3.2 市场供需
3.2.1市场供给
3.2.2 市场需求
3.3 区域市场分析
3.4 进出口分析
3.4.1 出口分析
3.4.2 进口分析
3.5 需求趋势
3.5.1 医药需求总体情况
3.5.2 老龄化推动医药行业市场需求
3.5.3 城镇化加大医疗市场需求
3.5.4 疾病发展趋势
3.6中药材
3.6.1中药材资源现状
3.6.2 中药材价格走势
3.7植物提取物
3.7.1 发展现状
3.7.2 进出口分析
第四章 中国中成药细分市场
4.1 总体情况
4.2心脑血管疾病类中成药
4.3抗肿瘤疾病类中成药
4.4呼吸系统疾病类中成药
4.5 肌肉骨骼疾病类中成药
第五章 中成药重点生产企业
5.1天士力
5.1.1企业简介
5.1.2 经营情况
5.1.3 营收构成
5.1.4 毛利率
5.1.5 发展前景
5.2 益佰制药
5.2.1 企业简介
5.2.2 经营情况
5.2.3 营收构成
5.2.4 毛利率
5.2.5 发展前景
5.3 云南白药
5.3.1 企业简介
5.3.2 经营情况
5.3.3 营收构成
5.3.4 毛利率
5.3.5 发展前景
5.4 片仔癀
5.4.1 企业简介
5.4.2 经营情况
5.4.3 营收构成
5.4.4 毛利率
5.4.5 发展前景
5.5 东阿阿胶
5.5.1 企业简介
5.5.2 经营情况
5.5.3 营收构成
5.5.4 毛利率
5.5.5 发展前景
5.6华润三九
5.6.1 企业简介
5.6.2 经营情况
5.6.3 营收构成
5.6.4 毛利率
5.6.5 发展前景
5.7 上海凯宝
5.7.1 企业简介
5.7.2 经营情况
5.7.3 营收构成
5.7.4 毛利率
5.7.5 发展前景
5.8 康美药业
5.8.1 企业简介
5.8.2 经营情况
5.8.3 营收构成
5.8.4 毛利率
5.8.5 发展前景
5.9 西藏药业
5.9.1 企业简介
5.9.2 经营情况
5.9.3 营收构成
5.9.4 毛利率
5.9.5 发展前景
5.10同仁堂
5.10.1 企业简介
5.10.2 经营情况
5.10.3 营收构成
5.10.4 毛利率
5.10.5 发展前景
1. Overview of Chinese Patent Medicine
1.1 Definition and Features
1.2 Classification
1.2.1 Classification by Dosage Form
1.2.2 Classification by Pharmacology
1.2.3 Industry Chain
2. Operating Environment for Chinese Patent Medicine Industry
2.1 Policies
2.1.1 Domestic Policies
2.1.2 Foreign Policies
2.2 Consumption Trend
2.3 Industry Trend
3. Market of Chinese Patent Medicine Industry
3.1 Development Status
3.2 Supply and Demand
3.2.1 Supply
3.2.2 Demand
3.3 Regional Market
3.4 Import and Export
3.4.1 Export
3.4.2 Import
3.5 Demand Trend
3.5.1 Overview of Pharmaceutical Demand
3.5.2 Population Aging Promotes Market Demand of Pharmaceutical Industry
3.5.3 Urbanization Increases Healthcare Market Demand
3.5.4 Disease Trend
3.6 Traditional Chinese Medicinal Materials
3.6.1 Resources
3.6.2 Price Trend
3.7 Plant Extract
3.7.1 Development Status
3.7.2 Import and Export
4. Chinese Patent Medicine Market Segments in China
4.1 Overview
4.2 Chinese Patent Medicine for Cardiovascular and Cerebrovascular Diseases
4.3 Chinese Patent Medicine for Tumor Diseases
4.4 Chinese Patent Medicine for Respiratory System Diseases
4.5 Chinese Patent Medicine for Musculoskeletal Diseases
5. Key Producers of Chinese Patent Medicine
5.1 Tianjin Tasly Pharmaceutical Co., Ltd.
5.1.1 Profile
5.1.2 Operation
5.1.3 Revenue Structure
5.1.4 Gross Margin
5.1.5 Development Prospect
5.2 Guizhou Yibai Pharmaceutical Co., Ltd.
5.2.1 Profile
5.2.2 Operation
5.2.3 Revenue Structure
5.2.4 Gross Margin
5.2.5 Development Prospect
5.3 Yunnan Baiyao Group Co., Ltd.
5.3.1 Profile
5.3.2 Operation
5.3.3 Revenue Structure
5.3.4 Gross Margin
5.3.5 Development Prospect
5.4 Zhangzhou Pientzehuang Pharmaceutical Co., Ltd.
5.4.1 Profile
5.4.2 Operation
5.4.3 Revenue Structure
5.4.4 Gross Margin
5.4.5 Development Prospect
5.5 Shandong Dong-E E-Jiao Co., Ltd.
5.5.1 Profile
5.5.2 Operation
5.5.3 Revenue Structure
5.5.4 Gross Margin
5.5.5 Development Prospect
5.6 China Resources Sanjiu Medical & Pharmaceutical Co., Ltd. (CR Sanjiu)
5.6.1 Profile
5.6.2 Operation
5.6.3 Revenue Structure
5.6.4 Gross Margin
5.6.5 Development Prospect
5.7 Shanghai Kaibao Pharmaceutical Co., Ltd.
5.7.1 Profile
5.7.2 Operation
5.7.3 Revenue Structure
5.7.4 Gross Margin
5.7.5 Development Prospect
5.8 Kangmei Pharmaceutical Co., Ltd.
5.8.1 Profile
5.8.2 Operation
5.8.3 Revenue Structure
5.8.4 Gross Margin
5.8.5 Development Prospect
5.9 Tibet Rhodiola Pharmaceutical Holding Co., Ltd.
5.9.1 Profile
5.9.2 Operation
5.9.3 Revenue Structure
5.9.4 Gross Margin
5.9.5 Development Prospect
5.10 Beijing Tongrentang Co., Ltd. (TRT)
5.10.1 Profile
5.10.2 Operation
5.10.3 Revenue Structure
5.10.4 Gross Margin
5.10.5 Development Prospect
表:中成药优缺点
表:中成药主要剂型分类
表:中成药按药理作用主要分类
图:中成药产业链示意图
表:与中成药相关的国家政策
图:2008-2012年中国中成药企业数
图:2008-2012年中国中成药行业营业收入及同比增速
图:2008-2012年中国中成药行业利润总额及同比增速
图:2011-2012年中国中成药企业毛利率
图:2008-2012年中国中成药产量及同比增速
图:2012年中国中成药产量排名前十的地区产量
图:2011年中国中成药销售额排名前十的地区销售额
图:2011年中国中成药销售额排名前十的地区销售占比
图:2012年中国规模以上中成药企业数量前十的省市
图:2012年中国中成药企业销售收入排名前十的省市
图:2012年中国中成药企业利润总额排名前十的省市
图:2012年中国中成药企业毛利率在40%以上的省市
表:2012年中国中成药市场(分区域)企业数量、销售收入和利润总额
图:2008-2012年中国中成药出口量及同比增速
图:2008-2012年中国中成药出口额及同比增速
表:2012年中国中成药主要出口国家及其出口额和产品
图:2012年中国中成药主要出口国家和地区占比(按出口额)
表:2012年中国中成药主要出口产品及其出口量和出口地区
表:2011年中国中成药出口企业10强
表:2012年中国中成药出口企业5强
图:2008-2012年中国中成药进口额及同比增速
图:2008-2012年中国中成药行业营业收入及其在医药行业中的占比
图:2002-2012年中国65岁及以上的人口数
图:2001-2011年中国城镇居民和农村居民人均医疗保健费用支出
表:2001-2011年中国医院数量及年均复合增长率
图:2008-2012年中国三七价格
图:2007-2012年中药材综合200指数趋势图
图:2010-2012年中国成都中药材价格指数
表:2012年中国中药材GAP主要企业名单
表:2008-2012年中国植物提取物进出口额
图:2012年中国植物提取物出口地区占比(按出口额)
图:2011年中国中成药医院终端市场份额(按治疗疾病类型)
表:心脑血管疾病类中成药四大系列
图:2007-2011年中国心脑血管疾病用中成药在医院终端中成药市场的比重
表:2012年中国心脑血管疾病用中药优秀品牌
图:2007-2011年中国抗肿瘤疾病用中成药在医院终端中成药市场的比重
表:2012年中国抗肿瘤疾病用中药优秀品牌十强
图:2007-2011年呼吸系统疾病用中成药在医院终端中成药市场的比重
图:2009年样本医院呼吸系统类中成药各类别占比
表:2012年呼吸系统类疾病用中药优秀品牌
图:2007-2011年肌肉骨骼类疾病用中成药在医院终端中成药市场的比重
表:2012年中国肌肉骨骼类疾病用中药优秀品牌十强
图:2008-2012年天士力营业收入及同比增速
图:2008-2012年天士力净利润及同比增速
图:2008-2012年天士力(分行业)营业收入
表:2008-2012年天士力(分地区)营业收入
图:2008-2012年天士力(分行业)毛利率
表:2009-2012年天士力(分地区)毛利率
图:2011-2015年天士力营业收入和净利润
图:2008-2012年益佰制药营业收入及同比增速
图:2008-2012年益佰制药净利润及同比增速
表:2009-2012年益佰制药(分行业)营业收入
表:2008-2012年益佰制药(分产品)营业收入
表:2008-2012年益佰制药(分地区)营业收入
表:2009-2012年益佰制药(分行业)毛利率
图:2008-2012年益佰制药(分产品)毛利率
表:2008-2012年益佰制药(分地区)毛利率
图:2011-2015年益佰制药营业收入和净利润
图:2008-2012年云南白药营业收入及同比增速
图:2008-2012年云南白药净利润及同比增速
图:2008-2012年云南白药(分行业)营业收入
图:2009-2012年云南白药(分产品)营业收入
表:2008-2012云南白药(分地区)营业收入
图:2008-2012年云南白药(分行业)毛利率
图:2009-2012年云南白药(分产品)毛利率
表:2008-2012年云南白药(分地区)毛利率
图:2011-2015年云南白药营业收入和净利润
图:2008-2012年片仔癀营业收入及同比增速
图:2008-2012年片仔癀净利润及同比增速
图:2008-2012年片仔癀(分行业)营业收入
图:2008-2012年片仔癀(分地区)营业收入
图:2008-2012年片仔癀(分行业)毛利率
表:2008-2012年片仔癀(分产品)毛利率
图:2008-2012年片仔癀(分地区)毛利率
图:2011-2015年片仔癀营业收入和净利润
图:2008-2012年东阿阿胶营业收入及同比增速
图:2008-2012年片仔癀净利润及同比增速
表:2008-2012年东阿阿胶(分产品)营业收入
表:2008-2012年东阿阿胶(分地区)营业收入
表:2008-2012年东阿阿胶(分产品)毛利率
表:2009-2012年东阿阿胶(分地区)毛利率
图:2011-2015年东阿阿胶营业收入和净利润
图:2008-2012年华润三九营业收入及同比增速
图:2008-2012年华润三九净利润及同比增速
图:2008-2012年华润三九(分行业)营业收入
图:2008-2012年华润三九(分地区)营业收入
表:2008-2012年华润三九(分行业)毛利率
图:2011-2015年华润三九营业收入和净利润
图:2008-2012年上海凯宝营业收入及同比增速
图:2008-2012年上海凯宝净利润及同比增速
表:2008-2012年上海凯宝(分产品)营业收入
图:2008-2012年上海凯宝(分地区)营业收入
表:2008-2012年上海凯宝(分产品)毛利率
图:2011-2015年上海凯宝营业收入和净利润
图:2008-2012年康美药业营业收入及同比增速
图:2008-2012年康美药业净利润及同比增速
表:2008-2012年康美药业(分地区)营业收入
表:2008-2012年康美药业(分地区)毛利率
图:2011-2015年康美药业营业收入和净利润
图:2008-2012年西藏药业营业收入及同比增速
图:2008-2012年西藏药业净利润及同比增速
表:2008-2012年西藏药业(分产品)营业收入
表:2008-2012年西藏药业(分地区)营业收入
表:2008-2012年西藏药业(分行业)毛利率
图:2008-2012年西藏药业(分产品)毛利率
图:2008-2012年西藏药业(分地区)毛利率
图:2011-2015年西藏药业营业收入和净利润
图:2008-2012年同仁堂营业收入及同比增速
图:2008-2012年同仁堂净利润及同比增速
图:2008-2012年同仁堂(分地区)营业收入
图:2009-2012年同仁堂(分地区)毛利率
图:2011-2015年同仁堂营业收入和净利润
Advantages and Disadvantages of Chinese Patent Medicine
Classification of Chinese Patent Medicine by Dosage Form
Classification of Chinese Patent Medicine by Pharmacology
Chinese Patent Medicine Industry Chain
Chinese Patent Medicine-related National Policies
Number of Chinese Patent Medicine Enterprises in China, 2008-2012
Revenue and YoY Growth Rate of Chinese Patent Medicine Industry in China, 2008-2012
Total Profit and YoY Growth Rate of Chinese Patent Medicine Industry in China, 2008-2012
Gross Margin of Chinese Patent Medicine Enterprises in China, 2011-2012
Output and YoY Growth Rate of Chinese Patent Medicine in China, 2008-2012
Output of Top 10 Chinese Patent Medicine Producing Regions in China, 2012
Sales of Top 10 Chinese Patent Medicine Sales Regions in China, 2011
Sales Structure of Top 10 Chinese Patent Medicine Sales Regions in China, 2011
Top 10 Chinese Provinces/Municipalities by Number of Above-scale Chinese Patent Medicine Enterprises, 2012
Top 10 Chinese Provinces/Municipalities by Sales of Chinese Patent Medicine Enterprises, 2012
Top 10 Chinese Provinces/Municipalities by Total Profit of Chinese Patent Medicine Enterprises, 2012
Chinese Provinces/Municipalities with Gross Margin of Chinese Patent Medicine Enterprises Above 40%, 2012
Number of Enterprises, Sales and Total Profit of China’s Chinese Patent Medicine Market by Region, 2012
China’s Chinese Patent Medicine Export Volume and YoY Growth Rate, 2008-2012
China’s Chinese Patent Medicine Export Value and YoY Growth Rate, 2008-2012
China’s Chinese Patent Medicine Export Destinations, Export Value and Products, 2012
China’s Chinese Patent Medicine Export Destination Structure by Export Value, 2012
China’s Chinese Patent Medicine Export Products, Export Volume and Export Destinations, 2012
China’s Top 10 Chinese Patent Medicine Export Enterprises, 2011
China’s Top 5 Chinese Patent Medicine Export Enterprises, 2012
China’s Chinese Patent Medicine Import Value and YoY Growth Rate, 2008-2012
Revenue and Share in Pharmaceutical Industry of China’s Chinese Patent Medicine Industry, 2008-2012
China’s Population Aged 65 and Above, 2002-2012
Per Capita Healthcare Expenditure of China’s Urban and Rural Residents, 2001-2011
China’s Number of Hospitals and CAGR, 2001-2011
China’s Panax Notoginseng Price, 2008-2012
Trend Chart of Traditional Chinese Medicinal Material Comprehensive 200 Index, 2007-2012
Price Index of Traditional Chinese Medicinal Materials in Chengdu, China, 2010-2012
Major Traditional Chinese Medicinal Material GAP Enterprises in China, 2012
China’s Plant Extract Import and Export Value, 2008-2012
China’s Plant Extract Export Destination Structure by Export Value, 2012
Share of Chinese Patent Medicine in the Medicine Sold to Hospitals in China by Disease, 2011
Four Major Types of Chinese Patent Medicine for Cardiovascular and Cerebrovascular Diseases
Share of Chinese Patent Medicine for Cardiovascular and Cerebrovascular Diseases in the Chinese Patent Medicine Sold to Hospitals in China, 2007-2011
Excellent Brands of Chinese Patent Medicine for Cardiovascular and Cerebrovascular Diseases, 2012
Share of Chinese Patent Medicine for Tumor Diseases in the Chinese Patent Medicine Sold to Hospitals in China, 2007-2011
Top 10 Excellent Brands of Chinese Patent Medicine for Tumor Diseases in China, 2012
Share of Chinese Patent Medicine for Respiratory System Diseases in the Chinese Patent Medicine Sold to Hospitals in China, 2007-2011
Chinese Patent Medicine for Respiratory System Diseases in Sample Hospital by Type, 2009
Excellent Brands of Chinese Patent Medicine for Respiratory System Diseases, 2012
Share of Chinese Patent Medicine for Musculoskeletal Diseases in the Chinese Patent Medicine Sold to Hospitals in China, 2007-2011
China’s Top 10 Excellent Brands of Traditional Chinese Medicine for Musculoskeletal Diseases, 2012
Revenue and YoY Growth Rate of Tasly, 2008-2012
Net Income and YoY Growth Rate of Tasly, 2008-2012
Revenue of Tasly by Sector, 2008-2012
Revenue of Tasly by Region, 2008-2012
Gross Margin of Tasly by Sector, 2008-2012
Gross Margin of Tasly by Region, 2009-2012
Revenue and Net Income of Tasly, 2011-2015
Revenue and YoY Growth Rate of Yibai Pharmaceutical, 2008-2012
Net Income and YoY Growth Rate of Yibai Pharmaceutical, 2008-2012
Revenue of Yibai Pharmaceutical by Sector, 2009-2012
Revenue of Yibai Pharmaceutical by Product, 2008-2012
Revenue of Yibai Pharmaceutical by Region, 2008-2012
Gross Margin of Yibai Pharmaceutical by Sector, 2009-2012
Gross Margin of Yibai Pharmaceutical by Product, 2008-2012
Gross Margin of Yibai Pharmaceutical by Region, 2008-2012
Revenue and Net Income of Yibai Pharmaceutical, 2011-2015
Revenue and YoY Growth Rate of Yunnan Baiyao, 2008-2012
Net Income and YoY Growth Rate of Yunnan Baiyao, 2008-2012
Revenue of Yunnan Baiyao by Sector, 2008-2012
Revenue of Yunnan Baiyao by Product, 2009-2012
Revenue of Yunnan Baiyao by Region, 2008-2012
Gross Margin of Yunnan Baiyao by Sector, 2008-2012
Gross Margin of Yunnan Baiyao by Product, 2009-2012
Gross Margin of Yunnan Baiyao by Region, 2008-2012
Revenue and Net Income of Yunnan Baiyao, 2011-2015
Revenue and YoY Growth Rate of Pientzehuang, 2008-2012
Net Income and YoY Growth Rate of Pientzehuang, 2008-2012
Revenue of Pientzehuang by Sector, 2008-2012
Revenue of Pientzehuang by Region, 2008-2012
Gross Margin of Pientzehuang by Sector, 2008-2012
Gross Margin of Pientzehuang by Product, 2008-2012
Gross Margin of Pientzehuang by Region, 2008-2012
Revenue and Net Income of Pientzehuang, 2011-2015
Revenue and YoY Growth Rate of Dong-E E-Jiao, 2008-2012
Net Income and YoY Growth Rate of Dong-E E-Jiao, 2008-2012
Revenue of Dong-E E-Jiao by Product, 2008-2012
Revenue of Dong-E E-Jiao by Region, 2008-2012
Gross Margin of Dong-E E-Jiao by Product, 2008-2012
Gross Margin of Dong-E E-Jiao by Region, 2009-2012
Revenue and Net Income of Dong-E E-Jiao, 2011-2015
Revenue and YoY Growth Rate of CR Sanjiu, 2008-2012
Net Income and YoY Growth Rate of CR Sanjiu, 2008-2012
Revenue of CR Sanjiu by Sector, 2008-2012
Revenue of CR Sanjiu by Region, 2008-2012
Gross Margin of CR Sanjiu by Sector, 2008-2012
Revenue and Net Income of CR Sanjiu, 2011-2015
Revenue and YoY Growth Rate of Shanghai Kaibao, 2008-2012
Net Income and YoY Growth Rate of Shanghai Kaibao, 2008-2012
Revenue of Shanghai Kaibao by Product, 2008-2012
Revenue of Shanghai Kaibao by Region, 2008-2012
Gross Margin of Shanghai Kaibao by Product, 2008-2012
Revenue and Net Income of Shanghai Kaibao, 2011-2015
Revenue and YoY Growth Rate of Kangmei Pharmaceutical, 2008-2012
Net Income and YoY Growth Rate of Kangmei Pharmaceutical, 2008-2012
Revenue of Kangmei Pharmaceutical by Region, 2008-2012
Gross Margin of Kangmei Pharmaceutical by Region, 2008-2012
Revenue and Net Income of Kangmei Pharmaceutical, 2011-2015
Revenue and YoY Growth Rate of Tibet Rhodiola Pharmaceutical, 2008-2012
Net Income and YoY Growth Rate of Tibet Rhodiola Pharmaceutical, 2008-2012
Revenue of Tibet Rhodiola Pharmaceutical by Product, 2008-2012
Revenue of Tibet Rhodiola Pharmaceutical by Region, 2008-2012
Gross Margin of Tibet Rhodiola Pharmaceutical by Sector, 2008-2012
Gross Margin of Tibet Rhodiola Pharmaceutical by Product, 2008-2012
Gross Margin of Tibet Rhodiola Pharmaceutical by Region, 2008-2012
Revenue and Net Income of Tibet Rhodiola Pharmaceutical, 2011-2015
Revenue and YoY Growth Rate of Tongrentang, 2008-2012
Net Income and YoY Growth Rate of Tongrentang, 2008-2012
Revenue of Tongrentang by Region, 2008-2012
Gross Margin of Tongrentang by Region, 2009-2012
Revenue and Net Income of Tongrentang, 2011-2015
如果这份报告不能满足您的要求,我们还可以为您定制报告,请 留言说明您的详细需求。
|