|
|
|
报告导航:研究报告—
制造业—化工
|
|
2012-2015年全球及中国己内酰胺产业链研究报告 |
 |
字数:2.8万 |
页数:83 |
图表数:97 |
|
中文电子版:8000元 |
中文纸版:4000元 |
中文(电子+纸)版:8500元 |
|
英文电子版:1950美元 |
英文纸版:2050美元 |
英文(电子+纸)版:2250美元 |
|
编号:HK031
|
发布日期:2013-04 |
附件:下载 |
 |
|
|
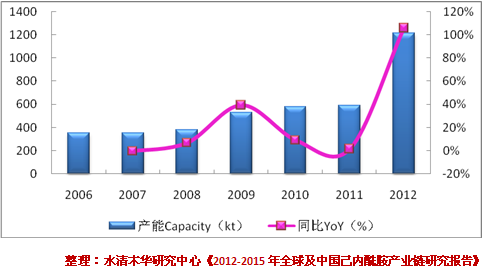
己内酰胺(CPL)是重要的有机化工原料之一,主要用于生产聚酰胺6,并进一步制作成锦纶6纤维和尼龙6工程塑料等,广泛应用在纺织、渔业、轮胎、工程塑料、薄膜以及复合材料等领域。 2006-2012年,全球己内酰胺产能保持稳定增长,年均复合增长率在4.9%左右。由于欧美己内酰胺市场基本饱和,产能陷入停滞甚至负增长,全球己内酰胺新增产能主要集中于亚洲尤其是中国。2012年,全球己内酰胺产能达568万吨,其中亚洲地区产能占比达46.3%。 2012年中国己内酰胺产能为121.5万吨,占全球总产能的21.4%。但是中国己内酰胺仍然供不应求,自给率仅50%左右,是全球最大的己内酰胺进口国。根据企业公开信息,2013-2016中国已内酰胺产能有望以20%以上的年均速度增长,预计2016年可达299万吨,供需基本平衡。 图:2006-2012年中国己内酰胺产能及增长率
己内酰胺下游消费领域主要为锦纶纤维和工程塑料。2012年,中国己内酰胺消费仍局限在传统的锦纶纤维领域,所占比例达73.3%;而工程塑料领域消费量占比仅为19.5%,远低于全球38.1%的水平。未来随着中国汽车、军工、运动器材等行业的快速发展,己内酰胺在工程塑料领域的应用比例将持续增加。 全球己内酰胺行业集中度较高,2012年前五名企业产能之和占总产能的比例达52.2%。德国巴斯夫和荷兰帝斯曼是全球己内酰胺行业龙头,产能分别为78.5万吨和71万吨,其中帝斯曼在中国南京建有己内酰胺生产基地。 2012年中国己内酰胺生产企业仅有7家,主要为中石化子公司或合资公司,包括巴陵分公司、石家庄炼化、中石化和恒逸石化合资公司等。近年来,由于政策的支持以及己内酰胺市场巨大的进口替代空间吸引,中国多家大型企业涉足己内酰胺领域,如海利化工、方明化工、鲁西化工、兰花科创、中国化学等,其中海力化工和方明化工2012年分别有20万吨和10万吨己内酰胺产能投产。 水清木华研究中心《2012-2015年全球及中国己内酰胺产业链研究报告》主要包括以下几个内容:- 全球己内酰胺行业供需分析、竞争格局、价格分析及发展预测等;
- 中国己内酰胺行业供需分析、竞争格局、进出口分析、价格分析及发展预测等;
- 中国己内酰胺上游苯、甲苯及苯酚行业供需分析、进出口分析及价格分析等;
- 中国己内酰胺下游PA6、锦纶纤维及尼龙工程塑料行业供需分析、进出口分析及价格分析等;
- 全球及中国8家己内酰胺生产企业的经营状况、己内酰胺业务分析、发展预测以及中国8家企业的己内酰胺在建项目情况等。
As one of the key organic chemical materials, caprolactam (CPL) is
mainly used to produce polyamide-6, and further fabricated into nylon 6
fiber, nylon 6 engineering plastics, etc.. It is widely applied in the
fields such as textile, fishery, tire, engineering plastics, film and
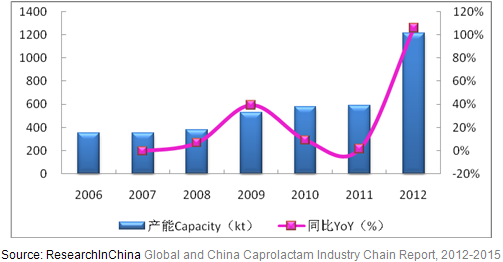
composite material. During 2006-2012, the CPL capacity around
the globe maintained steady growth, with a CAGR around 4.9%. Since the
CPL market in Europe and America has been saturated basically and the
capacity suffers stagnation or even negative growth, the newly added
capacity of CPL worldwide mainly concentrates in Asia, especially China.
In 2012, the CPL capacity around the globe reached 5.68 million tons,
in particular, the capacity ratio of Asia registered 46.3%. In
2012, the CPL capacity in China amounted to 1.215 million tons, sharing
21.4% of globe’s total capacity. Nevertheless, CPL is still
undersupplied in China. Currently, China is the largest CPL importer in
the world, with a self-sufficiency rate of around 50% only. According to
enterprises’ public information, the CPL capacity in China is expected
to witness an AAGR of over 20% during 2013-2016, and is estimated to
reach 2.99 million tons by 2016, with supply and demand achieving
balance basically. CPL Capacity and Growth Rate in China, 2006-2012
The
downstream consumption fields of CPL mainly involve nylon fiber and
engineering plastics. In 2012, the CPL consumption in China was still
restricted in traditional nylon fiber, with proportion achieving 73.3%;
the consumption of engineering plastics only shared 19.5% of total, much
lower than 38.1% globally. In future, along with the rapid development
of such industries as automotive, military and sports equipment in
China, the application ratio of CPL in engineering plastics will witness
continuous increase. The industrial concentration of CPL is on
the high side around the globe, and the capacity of top five enterprises
in 2012 shared 52.2% of total capacity. BASF and DSM are the leading
enterprises in CPL industry around the globe, with capacity respectively
hitting 785 kilotons and 710 kilotons. In particular, DSM has a CPL
production base in Nanjing. There were only 7 CPL manufacturers
in China in 2012, mainly the subsidiaries or joint ventures of Sinopec,
including Baling Petrochemical, Shijiazhuang Refinery and Petrochemical,
joint venture of Sinopec and Hengyi Petrochemical, etc.. In recent
years, due to the policy support and the huge import substitution space
of CPL market, a number of large scale enterprises in China have been
involved in the field of CPL, including Haili Chemical, Fangming
Chemical, Luxi Chemical, Lanhua Sci-Tech, China National Chemical, etc..
In particular, Haili Chemical and Fangming Chemical respectively
released CPL capacity of 200 kilotons and 100 kilotons in 2012. Global and China Caprolactam Industry Chain Report, 2012-2015 mainly involves the following contents:  Supply & demand, competition pattern, price, development forecast, etc. of CPL industry around the globe; Supply & demand, competition pattern, import & export, price, development forecast, etc. of CPL industry in China; Supply & demand, import & export, price, etc. of upstream industries as benzene, methylbenzene and phenol;
Supply & demand, import & export, price, etc. of downstream
industries as PA6, polyamide fiber and nylon engineering plastics;
Operation, CPL business and development forecast of 8 CPL manufacturers
around the globe and in China, and CPL projects under construction of 8
enterprises in China, etc..
第一章 己内酰胺行业概述
1.1 定义及作用
1.2 生产工艺
1.3 产业链
第二章 全球己内酰胺行业分析
2.1 发展历程
2.2 供给分析
2.3 需求分析
2.4 竞争格局
2.5 价格分析
2.6 发展及预测
第三章 中国己内酰胺行业分析
2.1 发展历程
2.2 供给分析
2.3 需求分析
2.4 竞争格局
2.5 进出口分析
2.6 价格分析
2.7 发展及预测
2.7.1 发展趋势
2.7.2 供需预测
第四章 中国己内酰胺上游行业分析
4.1 纯苯
4.1.1 市场供给
4.1.2 市场需求
4.1.3 进出口分析
4.1.4 价格分析
4.2 甲苯
4.2.1 供需分析
4.2.2 进出口分析
4.2.3 价格分析
4.3 苯酚
4.3.1 供需分析
4.3.2 进出口分析
4.3.3 价格分析
第五章 中国己内酰胺下游行业分析
5.1 PA6
5.1.1 概述
5.1.2 供给分析
5.1.3 需求分析
5.1.4 进出口分析
5.1.5 价格分析
5.2 锦纶纤维
5.2.1 概述
5.2.2 运营分析
5.2.3 供给分析
5.2.4 价格分析
5.3 尼龙6工程塑料
第六章 海外主要企业分析
6.1 巴斯夫
6.1.1 公司简介
6.1.2 经营情况
6.1.3 塑料部门经营情况
6.1.4 己内酰胺业务
6.1.5 在华业务
6.2 帝斯曼
6.2.1 公司简介
6.2.2 经营情况
6.2.3 聚合物中间体部门经营情况
6.2.4 己内酰胺业务
6.2.5 在华业务
6.3 台湾石化
6.3.1 公司简介
6.3.2 经营情况
6.3.3 营收构成
6.3.4 己内酰胺业务
第七章 中国大陆主要企业分析
7.1 中石化
7.1.1 公司简介
7.1.2 巴陵石化
7.1.3 石家庄炼化
7.2 恒逸石化
7.2.1 公司简介
7.2.2 经营情况
7.2.3 己内酰胺业务
7.2.4 预测与展望
7.3 巨化股份
7.3.1 公司简介
7.3.2 经营情况
7.3.3 己内酰胺业务
7.3.4 预测与展望
7.4 海力化工
7.4.1 公司简介
7.4.2 经营情况
7.4.3 营收构成
7.4.4 毛利率
7.4.5 己内酰胺业务
7.4.6 己内酰胺在建项目
7.5 方明化工
7.5.1 公司简介
7.5.2 己内酰胺业务
7.6 其他拟在建己内酰胺项目
7.6.1 兰花科创
7.6.2 鲁西化工
7.6.3 中国化学
7.6.4 庆华集团
7.6.5 旭阳集团
7.6.6 三鼎集团
7.6.7 铜化集团
7.6.8 三宁化工
1. Overview of CPL Industry
1.1 Definition and Function
1.2 Production Process
1.3 Industrial Chain
2. Global CPL Industry
2.1 Development Progress
2.2 Supply
2.3 Demand
2.4 Competition Pattern
2.5 Price
2.6 Development and Forecast
3. CPL Industry in China
3.1 Development Progress
3.2 Supply
3.3 Demand
3.4 Competition Pattern
3.5 Import and Export
3.6 Price
3.7 Development and Forecast
3.7.1 Development Trend
3.7.2 Supply and Demand Forecast
4. Upstream Industries of CPL in China
4.1 Pure Benzene
4.1.1 Market Supply
4.1.2 Market Demand
4.1.3 Import and Export
4.1.4 Price
4.2 Methylbenzene
4.2.1 Supply and Demand
4.2.2 Import and Export
4.2.3 Price
4.3 Phenol
4.3.1 Supply and Demand
4.3.2 Import and Export
4.3.3 Price
5. Downstream Industries of CPL in China
5.1 PA6
5.1.1 Overview
5.1.2 Supply
5.1.3 Demand
5.1.4 Import and Export
5.1.5 Price
5.2 Polyamide Fiber
5.2.1 Overview
5.2.2 Operation
5.2.3 Supply
5.2.4 Price
5.3 Nylon 6 Engineering Plastics
6. Major Overseas Enterprises
6.1 BASF
6.1.1 Profile
6.1.2 Operation
6.1.3 Operation of Plastics Division
6.1.4 CPL Business
6.1.5 Business in China
6.2 DSM
6.2.1 Profile
6.2.2 Operation
6.2.3 Operation of Polymer Intermediate Division
6.2.4 CPL Business
6.2.5 Business in China
6.3 Chemax International Corporation
6.3.1 Profile
6.3.2 Operation
6.3.3 Revenue Structure
6.3.4 CPL Business
7. Major Enterprises in Chinese Mainland
7.1 Sinopec
7.1.1 Profile
7.1.2 Baling Petrochemical
7.1.3 Shijiazhuang Refinery and Petrochemical
7.2 Hengyi Petrochemical
7.2.1 Profile
7.2.2 Operation
7.2.3 CPL Business
7.2.4 Forecast and Prospect
7.3 Juhua Co., Ltd.
7.3.1 Profile
7.3.2 Operation
7.3.3 CPL Business
7.3.4 Forecast and Prospect
7.4 Haili Chemical
7.4.1 Profile
7.4.2 Operation
7.4.3 Revenue Structure
7.4.4 Gross Margin
7.4.5 CPL Business
7.4.6 CPL Projects under Construction
7.5 Fangming Chemical
7.5.1 Profile
7.5.2 CPL Business
7.6 Other CPL Projects under Planning/Construction
7.6.1 Lanhua Sci-Tech
7.6.2 Luxi Chemical
7.6.3 China National Chemical Engineering
7.6.4 Qinghua Group
7.6.5 Xuyang Group
7.6.6 Sanding Group
7.6.7 Tongling Chemical Industry Group
7.6.8 Sanning Chemical
表:己内酰胺主要的生产工艺
图:苯法制己内酰胺工艺路线图
图:己内酰胺产业链
表:世界己内酰胺发展历程
图:2006-2012年全球己内酰胺产能及增长率
图:2011-2012年全球己内酰胺产能地区分布
图:2006-2012年全球己内酰胺产量及增长率
图:2006-2012年全球己内酰胺装置开工率
图:2012年全球己内酰胺下游消费结构
表:2012年全球己内酰胺主要生产企业及其产能
图:2012年全球己内酰胺竞争格局(按产能)
图:2010-2013年世界己内酰胺价格走势
图:2012-2016年全球己内酰胺产能、产量及开工率预测
图:2006-2012年中国己内酰胺产能及增长率
图:2006-2012年中国己内酰胺产量及开工率
图:2006-2012年中国己内酰胺表观消费量及自给率
图:2012年中国己内酰胺下游消费结构
表:2011-2012年中国己内酰胺生产企业及其产能
图:2012年中国己内酰胺竞争格局(按产能)
表:2013-2018年中国己内酰胺拟/在建项目
图:2008-2012年中国己内酰胺进出口量
图:2008-2012年中国己内酰胺进出口平均价格
图:2012年中国己内酰胺进口来源结构(按进口量)
图:2012年中国己内酰胺出口目的地分布(按出口量)
图:2012年中国己内酰胺主要进口城市及其进口量占比
图:2012年中国己内酰胺主要出口城市及其出口量占比
图:2006-2013年巴陵石化及南京帝斯曼的己内酰胺出厂价格
表:2012-2016年中国己内酰胺产能、产量及开工率预测
表:2012-2016年中国己内酰胺表观消费量及自给率预测
图:2006-2012年中国纯苯产量及增长率
图:2012年中国纯苯(分地区)产量占比
图:2008-2012年中国纯苯表观消费量及自给率
图:2008-2012年中国纯苯进出口量
图:2008-2012年中国纯苯进出口平均价格
图:2012年中国纯苯进口来源结构(按进口量)
图:2012年中国纯苯出口目的地分布(按出口量)
图:2003-2013年中国纯苯市场价格走势
表:2013年4月5日中国纯苯(分地区)市场价格
表:2012-2013年中国纯苯主要厂商出厂价格
图:2006-2012年中国甲苯产量及增长率
图:2006-2012年中国甲苯表观消费量及自给率
图:2008-2012年中国甲苯进出口量
图:2012年中国甲苯进口来源结构(按进口量)
图:2012年中国甲苯出口目的地分布(按出口量)
图:2003-2013年中国甲苯市场价格走势
表:2013年4月5日中国甲苯(分地区)市场价格
表:2012-2013年中国甲苯主要厂商出厂价格
图:2008-2012年中国苯酚产量及增长率
图:2008-2012年中国苯酚表观消费量及自给率
表:2013年中国主要的计划投产的苯酚项目
图:2008-2012年中国苯酚进出口量
图:2012年中国苯酚进口来源结构(按进口量)
图:2012年中国苯酚出口目的地分布(按出口量)
图:2003-2013年中国苯酚市场价格走势
表:2013年4月12日中国苯酚(分地区)市场价格
表:2012-2013年中国苯酚主要厂商出厂价格
图:2008-2012年中国PA6切片产能、产量及开工率
图:2012年中国PA6产能地区分布
图:2008-2012年中国PA6表观消费量及自给率
图:2008-2012年中国PA6切片进出口量
图:2012年中国PA6切片进口来源结构(按进口量)
图:2012年中国PA6切片出口目的地分布(按出口量)
图:2012年中国PA6切片主要进口城市及其进口量占比
图:2012年中国PA6切片主要出口城市及其出口量占比
图:2003-2013年中国上海中山化工市场PA6市场价格
表:2013年3月22日中国华东地区PA6主要供应商、产品及价格
图:2006-2012年中国锦纶纤维行业主营业务收入及增长率
图:2006-2012年中国锦纶纤维行业利润总额及增长率
图:2006-2012年中国锦纶纤维产量及增长率
图:2012年中国锦纶纤维(分地区)产量占比
图:2008-2012年中国锦纶6切片(长丝常规纺)市场价格
表:2006-2012年中国尼龙6工程塑料需求量及增长率
图:2010-2012年巴斯夫塑料部门销售收入及EBITDA
图:2010-2012年巴斯夫塑料部门(分产品)销售收入占比
图:2010-2012年巴斯夫塑料部门高性能聚合物业务(分地区)销售收入占比
图:2009-2012年台湾石化营业收入及净利润
表:2009-2011年台湾石化(分产品)营业收入
图:2009-2011年台湾石化(分产品)营业收入占比
表:2009-2011年台湾石化(分地区)营业收入
图:2009-2011年台湾石化(分地区)营业收入占比
图:2009-2011年台湾石化己内酰胺及尼龙粒产能、产量及开工率
图:2009-2011年台湾石化己内酰胺及尼龙粒(分地区)销量
表:2011-2012年巴陵石化产品总量及营业收入
表:巴陵石化己内酰胺业务发展历程
表:2013-2020年巴陵石化己内酰胺发展规划
图:2010-2012年恒逸石化营业收入及净利润
图:2011-2015年恒逸石化营业收入及净利润预测
图:2010-2012年巨化股份营业收入和净利润
图:2011-2015年巨化股份营业收入及净利润预测
图:2009-2012年海力化工主营业务收入及净利润
表:2009-2012年海力化工(分产品)主营业务收入
表:2009-2012年海力化工(分产品)主营业务收入占比
表:2009-2012年海力化工(分地区)主营业务收入
表:2009-2012年海力化工(分地区)主营业务收入占比
表:2009-2012年海力化工主营产品毛利率
表:2012年海力化工己内酰胺产能、产量、销量及销售价格
表:2012年海力化工己内酰胺产品系列收入情况
Main Production Processes of CPL
Process Roadmap of Preparing CPL by Benzene
Industrial Chain of CPL
CPL Development Progress Worldwide
CPL Capacity and Growth rate Around the Globe, 2006-2012
Global CPL Capacity Distribution by Region, 2011-2012
CPL Output and Growth Rate Around the Globe, 2006-2012
Operation Rate of Global CPL Installations, 2006-2012
Downstream Consumption Structure of CPL Around the Globe, 2012
Global Major CPL Manufacturers and Their Capacities, 2012
Competition Pattern of CPL Around the Globe (by Capacity), 2012
Price Trend of CPL Worldwide, 2010-2013
CPL Capacity, Output and Operation Rate Worldwide, 2012-2016E
CPL Capacity and Growth Rate in China, 2006-2012
CPL Output and Operation Rate in China, 2006-2012
Apparent Consumption and Self-Sufficiency of CPL in China, 2006-2012
Downstream Consumption Structure of CPL in China, 2012
CPL Manufacturers in China and Their Capacities, 2011-2012
Competition Pattern of CPL in China (by Capacity), 2012
CPL Projects Under Planning/Construction in China, 2013-2018
Import and Export Volume of CPL in China, 2008-2012
Import and Export Average Price of CPL in China, 2008-2012
Import Source Structure of CPL in China (by Import Volume), 2012
Export Destination Structure of China’s CPL (by Export Volume), 2012
Major Import Cities of CPL in China and Their Import Volume Proportion, 2012
Major Export Cities of CPL in China and Their Export Volume Proportion, 2012
CPL Ex-factory Prices of Baling Petrochemical and Nanjing DSM, 2006-2013
CPL Capacity, Output and Operation Rate in China, 2012-2016E
Apparent Consumption and Self-Sufficiency of CPL in China, 2012-2016E
Pure Benzene Output and Growth Rate in China, 2006-2012
Pure Benzene Output Structure (by Region) in China, 2012
Apparent Consumption and Self-Sufficiency of Pure Benzene in China, 2008-2012
Import Volume and Export Volume of Pure Benzene in China, 2008-2012
Import and Export Average Price of Pure Benzene in China, 2008-2012
Import Source Structure of Pure Benzene in China (by Import Volume), 2012
Export Destination Structure of China’s Pure Benzene (by Export Volume), 2012
Price Trend of Pure Benzene in China, 2003-2013
Market Price of Pure Benzene in China (by Region), Apr.5th 2013
Ex-factory Prices of Major Pure Benzene Manufacturers in China, 2012-2013
Methylbenzene Output and Growth Rate in China, 2006-2012
Apparent Consumption and Self-Sufficiency of Methylbenzene in China, 2006-2012
Import Volume and Export Volume of Methylbenzene in China, 2008-2012
Import Source Structure of Methylbenzene in China (by Import Volume), 2012
Export Destination Structure of China’s Methylbenzene (by Export Volume), 2012
Price Trend of Methylbenzene in China, 2003-2013
Market Price of Methylbenzene (by Region) in China, Apr.5th 2013
Ex-factory Price of Major Methylbenzene Manufactures in China, 2012-2013
Phenol Output and Growth Rate in China, 2008-2012
Apparent Consumption and Self-Sufficiency of Phenol in China, 2008-2012
Major Phenol Projects to Production in China, 2013
Import Volume and Export Volume of Phenol in China, 2008-2012
Import Source Structure of Phenol in China (by Import Volume), 2012
Export Destination Structure of China’s Phenol (by Export Volume), 2012
Price Trend of Phenol in China, 2003-2013
Market Price of Phenol in China (by Region), Apr.12th 2013
Ex-factory Prices of Major Phenol Manufacturers in China, 2012-2013
Capacity, Output and Operation Rate of PA6 Slice in China, 2008-2012
Regional Distribution of PA6 Capacity in China, 2012
Apparent Consumption and Self-Sufficiency of PA6 in China, 2008-2012
Import Volume and Export Volume of PA6 Slice in China, 2008-2012
Import Source Structure of PA6 Slice in China (by Import Volume), 2012
Export Destination Structure of China’s PA6 Slice (by Export Volume), 2012
Major Import Cities of PA6 Slice in China and Their Import Volume proportion, 2012
Major Export Cities of PA6 Slice in China and Their Export Volume proportion, 2012
PA6 Market Price at Shanghai Zhongshan Chemical Market in China, 2003-2013
Major Suppliers, Products and Prices of PA6 in East China, Mar.22nd 2013
Operating Revenue and Growth Rate of Polyamide Fiber Industry in China, 2006-2012
Total Profits and Growth Rate of Polyamide Fiber Industry in China, 2006-2012
Polyamide Fiber Output and Growth Rate in China, 2006-2012
Polyamide Fiber Output Structure in China (by Region), 2012
Market Price of Nylon 6 Slice (Conventional Spun Filament) in China, 2008-2012
Demand and Growth Rate of Nylon 6 Engineering Plastics in China, 2006-2012
Sales and EBITDA of BASF’s Plastics Division, 2010-2012
Revenue Structure of BASF’s Plastics Division (by Product), 2010-2012
Revenue Structure of Plastics Division’s High Performance Polymer Business (by Region), 2010-2012
Revenue and Net Income of Chemax International Corporation, 2009-2012
Revenue of Chemax International Corporation (by Product), 2009-2011
Revenue Structure of Chemax International Corporation (by Product), 2009-2011
Revenue of Chemax International Corporation (by Region), 2009-2011
Revenue Structure of Chemax International Corporation (by Region), 2009-2011
CPL and Nylon Particle Capacity, Output and Operation Rate of Chemax International Corporation, 2009-2011
Sales Volume of Chemax International Corporation’s CPL and Nylon Particle (by Region), 2009-2011
Output and Revenue of Baling Petrochemical, 2011-2012
Development Progress of Baling Petrochemical’s CPL Business
Development Planning of Baling Petrochemical’s CPL Business, 2013-2020
Revenue and Net Income of Hengyi Petrochemical, 2010-2012
Revenue and Net Income of Hengyi Petrochemical, 2011-2015E
Revenue and Net Income of Juhua, 2010-2012
Revenue and Net Income of Juhua, 2011-2015E
Operating Revenue and Net Income of Haili Chemical, 2009-2012
Operating Revenue of Haili Chemical (by Product), 2009-2012
Operating Revenue Structure of Haili Chemical (by Product), 2009-2012
Operating Revenue of Haili Chemical (by Region), 2009-2012
Operating Revenue Structure of Haili Chemical (by Region), 2009-2012
Gross Margin of Haili Chemical by Product, 2009-2012
CPL Capacity, Output, Sales Volume and Sales Price of Haili Chemical, 2012
Revenue of Haili Chemical’s CPL Products, 2012
如果这份报告不能满足您的要求,我们还可以为您定制报告,请 留言说明您的详细需求。
|