|
|
|
报告导航:研究报告—
TMT产业—电信
|
|
2012-2013年全球及中国手机整机行业研究报告 |
 |
字数:2.8万 |
页数:112 |
图表数:108 |
|
中文电子版:8000元 |
中文纸版:4000元 |
中文(电子+纸)版:8500元 |
|
英文电子版:2300美元 |
英文纸版:2400美元 |
英文(电子+纸)版:2600美元 |
|
编号:ZYW148
|
发布日期:2013-05 |
附件:下载 |
 |
|
|
《2012-2013年全球及中国手机整机行业研究报告》包括以下内容: 1、全球手机市场与产业 2、中国手机市场与产业 3、中国手机出口数据分析 4、30家手机厂家研究 2012年全球手机出货量大约1606百万部,比2011年微幅增长1.9%。2013年手机市场也不容乐观,全球新兴经济体增长乏力,欧洲依然看不到复苏迹象。预计2013年手机出货量大约1638百万部,微幅增长2.0%。智能手机仍然是大热门,但是成长力度已经不如2012年,2013年智能手机出货量也将第一次超过普通手机。展望2014年,新兴市场仍然不容乐观,极有可能进一步下滑,而发达经济体如日本和美国预计能呈现稳定增长态势,欧洲预计也会好转。预计2014年手机出货量达1688百万部。 2012年全球智能手机出货量大约787百万部,比2011年增长51.3%,预计2013年全球智能手机出货量达950百万部,比2012年增长20.7%。智能手机占整个手机市场的比例将达58%。 2012年中国大陆手机产量大约1210百万部,比2011年增加9.2%,全球75%的手机都由中国大陆制造,而2011年的比例是70%。预计2013年中国手机产量达1280百万部,比2012年增加5.8%。2012年中国大陆手机出口1015百万部,其中至少10%返销回中国大陆。中国手机出口目的地主要是香港、韩国、美国、欧盟、东盟、印度和墨西哥。2012年对日本出口涨幅最高,达63%;其次是韩国,增长39%,再次是香港,增幅30%,再次是美国,增幅25%。对欧盟的出口还有3.6%的增幅,下滑比较大的是印度,下滑了18%。
2013年1季度中国Top18手机制造商出货量(单位:千部)
供应链厂家依然大放异彩,2012年供应链厂家出口量达1.92亿部,比2011年增加约90%。朗华供应链、年富实业、旗丰供应链、信利康供应链、普路通供应链出口都超过1000万部,其中信利康供应链高达6225万部,而2011年该公司出口才424万部。
The report highlights: 1. Global Mobile Phone Market and Industry 2. China Mobile Phone Market and Industry 3. China Mobile Phone Export 4. 29 Mobile Phone Vendors In
2012, the mobile phone shipment worldwide approximated 1.606 billion, a
meager rise of 1.9% compared to 2011. Against the backdrop of sluggish
emerging economies as well as the tenuous economic growth in Europe in
2013, the global mobile phone market is not optimistic, with the
expected shipment slightly surging by 2.0% to 1.638 billion sets.
Despite the fact that the growth dynamic of smartphone cannot compete
with that in 2012, the smartphone shipment in 2013 is expected to exceed
that of normal phones for the first time. Looking into 2014, emerging
markets are still sluggish and, are greatly likely to see further
downward mobility. By contrast, developed economies such as Japan and
America are projected to witness stable growth momentum. And it is the
same case for Europe whose mobile phone shipment is estimated to hit
1.688 billion sets by 2014. In 2012, the smartphone shipment
worldwide approximated 787 million sets, up 51.3% over 2011. The
estimate shows that the figure in 2013 will be 950 million sets, up
20.7% over 2012. In 2013, smartphone is expected to make up 58% of the
overall mobile phone market. In 2012, the mobile phone output on
Chinese mainland claimed around 1.210 billion, up 9.2% over 2011.
Worldwide, 75% mobile phones are made in the mainland China, in 2011,
the figure recorded 70%. It is projected that China’s mobile phone
output in 2013 will reach 1.28 billion sets, up 5.8% over 2012. In 2012,
the mobile phone export volume on Chinese mainland amounted to 1.015
billion sets, of which, at least 10% were resold to mainland China. In
China, mobile phone export destinations concentrate in Hong Kong, South
Korea, America, EU, ASEAN, India and Mexico. In 2012, the export to
Japan came out top in terms of growth, rising by 63%, followed by South
Korea (by 39%), Hong Kong (by 30%), and America (by 25%). In particular,
China’s mobile phone export to the EU grew by 3.6%, while the export to
India dived by 18%. Shipment of Top 18 Mobile Phone Companies in China, 2013Q1(Unit: 1,000 sets)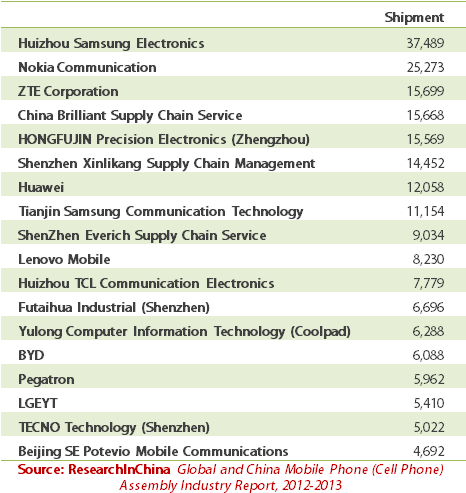 Supply
chain companies maintained robust growth momentum, with the export
volume in 2012 increased by around 90% over 2011 to 192 million. And the
export volume of China Brilliant Supply Chain Service, ShenZhen Everich
Supply Chain Service, First Flag, Shenzhen Xinlikang Supply Chain
Management and Shenzhen Prolto Supply Chain Management all exceeded 10
million sets. In particular, Shenzhen Xinlikang Supply Chain Management
realized the export volume as high as 62.25 million sets in 2012,
compared to 4.24 million sets in 2011.
第一章、全球手机市场
1.1、全球手机市场规模
1.2、手机品牌市场占有率
1.3、智能手机市场与产业
第二章、中国手机产业
2.1、中国手机产业地域分布
2.2、中国手机企业产量排名
2.3、中国手机生产厂家业务模式
2.4、供应链外包模式下的手机生产
2.4.1、郎华供应链
2.4.2、旗丰供应链
第三章、中国手机出口
3.1、中国手机出口规模
3.2、中国手机出口特点
3.3、中国手机出口地域分布
第四章、手机厂家研究
4.1、诺基亚
4.2、摩托罗拉
4.3、三星
4.4、索尼
4.5、LG
4.6、RIM
4.7、APPLE
4.8、HTC
4.9、TCL通讯科技
4.10、华宝
4.11、华冠
4.12、富士康国际控股(FIH)
4.13、比亚迪
4.14、伟创力
4.15、中兴通讯
4.16、华为
4.17、联成文
4.18、东莞航天
4.19、西可通信
4.20、基伍国际
4.21、百纳威尔
4.22、龙旗
4.23、康佳
4.24、华贝科技(华勤)
4.25、统庆通信(Z-OBEE)
4.26、深圳新中桥
4.27、宇龙通信
4.28、振华通信
4.29、天珑移动技术
1. Global Mobile Phone Market
1.1 Global Mobile Phone Market Scale
1.2 Mobile Phone Market Occupancy by Brand
1.3 Smartphone Market and Industry
2. China Mobile Phone Industry
2.1 China Mobile Phone Industry by Region
2.2 Ranking of Chinese Mobile Phone Companies by Output
2.3 Business Model of Chinese Mobile Phone Vendors
2.4 Mobile Phone Manufacturing Under the Supply Chain Outsourcing Model
2.4.1 China Brilliant Supply Chain Service Co., Ltd.
2.4.2 First Flag
3. China Mobile Phone Export
3.1 China Mobile Phone Export Scale
3.2 China Mobile Phone Export Features
3.3 China Mobile Phone Export by Region
4. Mobile Phone Vendors
4.1 Nokia
4.2 Motorola
4.3 Samsung
4.4 Sony
4.5 LG
4.6 RIM
4.7 Apple
4.8 HTC
4.9 TCL Communication Technology
4.10 Compal Communications Inc
4.11 Arima Communications
4.12 FIH
4.13 BYD
4.14 Flextronics
4.15 ZTE
4.16 Huawei
4.17 Lianchengwen Technology
4.18 Dongguan Inflight Electronic
4.19 CK Telecom
4.20 G’Five International
4.21 Beny Wave
4.22 Longcheer
4.23 Konka
4.24 Huabel Electronic & Technology (HuaQin Photoelectric Technology)
4.25 Z-OBEE
4.26 Shenzhen Newchabridge Communication
4.27 Yulong Computer Telecommunication Scientific
4.28 Shenzhen Zhenhua Communication Equipment
4.29 TINNO Corporation
2007-2014年全球手机出货量
2010-2013年全球CDMA/WCDMA手机出货量地域分布
2010-2011年每季度全球主要手机品牌出货量
2011-2012年全球主要手机厂家出货量
2012年4季度全球智能手机操作系统分布
2011-2012中国主要智能手机厂家出货量
2012年中国手机产量地域分布
2010-2012年25家中国手机厂家产量排名
2013年1季度中国手机出口前50强
2010-2012年供应链外包厂家手机出货量
朗华供链服务有限公司组织结构
朗华供应链主要客户
2000-2012年中国手机出口量与增幅
2002-2012年中国手机出口额与增幅
2002-2012年中国手机出口量与ASP
2010年1月-2011年12月中国手机出口量与平均价格
2011-2012年我手机出口前10大市场 出货量
2003-2013年诺基亚手机出货量与增幅
2010年1季度-2011年4季度诺基亚手机每季度出货量地域分布
2010年1季度-2013年1季度诺基亚智能手机每季度出货量
2011年1季度-2013年1季度Nokia销售额与营业利润率
2011年1季度-2013年1季度Nokia出货量与Asp
2011年1季度-2013年1季度Nokia Smartphone出货量与Asp
2011年1季度-2013年1季度Nokia Normalphone出货量与Asp
2011年1季度-2013年1季度Nokia MobilePhone出货量地域分布
2011年1季度-2013年1季度Nokia Mobile Phone销售额地域分布
2010-2011年诺基亚手机产量地域分布
2010年1季度-2013年1季度摩托罗拉手机业务每季度销售额与运营利润率
2010年1季度-2013年1季度摩托罗拉手机业务每季度销售额与出货量
2010年1季度-2011年4季度摩托罗拉手机每季度出货量与运营利润率
2010-2012年摩托罗拉手机产量地域分布
2001-2013年三星手机出货量与年度增幅
2010年1季度-2013年1季度三星手机出货量与运营利润率
2010年1季度-2013年1季度三星手机ASP与出货量
2010-2012年三星手机产量地域分布
2010年1季度-2012年4季度索尼手机出货量
2010年1季度-2011年4季度索尼爱立信手机出货量与平均销售价格
2010年1季度-2011年4季度索尼爱立信销售额与运营利润率
2009年3季度-2011年4季度索尼爱立信出货量与毛利率
2010-2012年索爱手机产量工厂分布
2002-2013年LG手机出货量与年度增幅
2010年1季度-2013年1季度LG手机销售额与运营利润率
2010年1季度-2013年1季度LG手机出货量与运营利润率
2010-2012年LG手机产量地域分布
2004财年-2013财年 RIM收入、毛利率、运营利润率
2005-2013财年 RIM收入业务分布
2005-2013财年RIM手机出货量
2010财年2季度-2013财年4季度RIM手机出货量
2010-2011财年RIM收入地域分布
2013财年RIM收入地域分布
2010-2012年RIM代工厂家代工比例
2004-2013财年APPLE收入与净利率
2004-2012财年APPLE收入地域分布
2007-2012财年APPLE收入产品分布
2004-2011财年IPOD、IPAD、IPHONE销量
2008年1季度-2011年4季度苹果IPHONE手机出货量
2003-2013年HTC收入与毛利率
2004-2013年HTC出货量与平均价格
2009年1季度-2013年1季度HTC季度出货量
2006-2011年HTC收入地域分布
TCL 通讯股权结构
TCL通讯组织结构图
TCL全球分布
2002-2012年TCL通讯收入与毛利率
2008年1月-2013年3月TCL通讯手机每月出货量
2010年1季度-2012年4季度TCL收入产品分布
2011年1季度-2012年4季度TCL通讯智能手机销量
2006-2012年TCL通讯手机出货量
2006-2010年TCL通讯手机出货量地域分布
TCL通讯收入地域分布
2004-2013年华宝收入与毛利率
2011年3月-2013年3月华宝每月收入与增幅
2004-2013年华宝手机出货量与平均售价
华冠全球布局
2005-2013年华冠收入与毛利率
2011年3月-2013月3月华冠每月收入同比增幅
2003年-2013年华冠手机出货量与增幅
华冠通讯大陆投资结构图
2003-2011年富士康国际FIH收入与运营利润率
2005-2012年FIH收入地域分布
2012年FIH客户分布
富士康(鸿海)主要子公司2010-2012年出货量
2004-2013年比亚迪电子收入与毛利率
2006-2012年比亚迪电子收入地域分布
2006-2012年比亚迪电子收入业务分布
2009-2011年比亚迪电子收入客户分布
1995财年-2013财年伟创力收入
2010年4季度-2012年4季度伟创力收入业务分布
2012财年伟创力员工地域分布
珠海斗门工业园区
2010财年伟创力客户结构
2006-2011年中兴通讯终端收入与毛利率
2006-2013年中兴通讯手机出货量
2012年中兴通讯手机代工厂家分布
2006-2013年华为手机出货量与增幅
2011年华为手机代工厂分布
龙旗组织结构
2006-2013财年龙旗收入与运营利润率
2010-2012财年龙旗控股收入地域分布
2006-2012年康佳手机业务收入与毛利率
2008-2013财年ZOBEE收入与营业利润
2008-2012财年Z-OBEE收入业务分布
2004-2013年宇龙收入与净利润率
2009-2013年酷派手机出货量与Asp
2005-2011年深圳振华通信收入与运营利润率
天珑移动股权结构
2009-2012年天珑移动收入与营业利润
2012年天珑移动手机出货量地域分布
天珑移动主要客户
天珑移动客户在所在国市场占有率
Global Mobile Phone Shipment, 2007-2014
Global CDMA/WCDMA Mobile Phone Shipment by Region, 2010-2013
Quarterly Mobile Phone Shipment by Brand, 2010-2011
Shipment of Major Mobile Phone Vendors Worldwide, 2011-2012
Global Smartphone Operating System, 2012Q4
Shipment of Major Smartphone Vendors in China, 2011-2012
China Mobile Phone Output by Region, 2012
Ranking of 25 Chinese Mobile Phone Companies by Output, 2010-2012
China’s Top 50 Mobile Phone Companies by Export, 2013Q1
Mobile Phone Shipment of Supply Chain Outsourcing Companies, 2010-2012
Organization of China Brilliant Supply Chain Service Co., Ltd
Major Clients of China Brilliant Supply Chain Service Co., Ltd
Mobile Phone Export Volume and Growth Rate in China, 2000-2012
Mobile Phone Export Value and Growth Rate in China, 2002-2012
Mobile Phone Export Volume and ASP in China, 2002-2012
Mobile Phone Export Volume and Average Price in China, Jan.2010-Dec.2011
China’s Top 10 Mobile Phone Export Destinations by Shipment, 2011-2012
Mobile Phone Shipment and Growth Rate of Nokia, 2003-2013
Quarterly Mobile Phone Shipment of Nokia by Region, 2010Q1-2011Q4
Quarterly Smartphone Shipment of Nokia, 2010Q1-2013Q1
Sales and Operating Margin of Nokia, 2011Q1-2013Q1
Shipment and ASP of Nokia, 2011Q1-2013Q1
Smartphone Shipment and ASP of Nokia, 2011Q1-2013Q1
Normal Phone Shipment and ASP of Nokia, 2011Q1-2013Q1
Mobile Phone Shipment of Nokia by Region, 2011Q1-2013Q1
Sales of Nokia Mobile Phone by Region, 2011Q1-2013Q1
Mobile Phone Output of Nokia by Region, 2010-2011
Quarterly Sales and Operating Margin of Motorola Mobile Phone, 2010Q1-2013Q1
Quarterly Sales and Shipment of Motorola Mobile Phone, 2010Q1-2013Q1
Quarterly Shipment and Operating Margin of Motorola Mobile Phone, 2010Q1-2011Q4
Output of Motorola Mobile Phone by Region, 2010-2012
Shipment and Annual Growth Rate of Samsung Mobile Phone, 2001-2013
Shipment and Operating Margin of Samsung Mobile Phone, 2010Q1-2013Q1
ASP and Shipment of Samsung Mobile Phone, 2010Q1-2013Q1
Output of Samsung Mobile Phone by Region, 2010-2012
Shipment of Sony Mobile Phone, 2010Q1-2012Q4
Shipment and Average Selling Price of Sony Ericsson Mobile Phone, 2010Q1-2011Q4
Sales and Operating Margin of Sony Ericsson, 2010Q1-2011Q4
Shipment and Gross Margin of Sony Ericsson, 2009Q3-2011Q4
Output of Sony Ericsson Mobile Phone by Plant, 2010-2012
Shipment and Annual Growth Rate of LG Mobile Phone, 2002-2013
Sales and Operating Margin of LG Mobile Phone, 2010Q1-2013Q1
Shipment and Operating Margin of LG Mobile Phone, 2010Q1-2013Q1
LG Mobile Phone Output by Region, 2010-2012
Revenue, Gross Margin and Operating Margin of RIM, FY2004-FY2013
Revenue of RIM by Business, FY2005-FY2013
Shipment of RIM Mobile Phone, FY2005-FY2013
Shipment of RIM Mobile Phone , FY2010Q2-FY2013Q4
Revenue of RIM by Region, FY2010-FY2011
Revenue of RIM by Region, FY2013
OEM Structure of RIM, 2010-2012
Revenue and Net Profit Margin of APPLE, FY2004-FY2013
Revenue of APPLE by Region, FY2004-FY2012
Revenue of APPLE by Product, FY2007-FY2012
Sales Volume of IPOD, IPAD and IPHONE, FY2004-FY2011
IPHONE Shipment of Apple, 2008Q1-2011Q4
Revenue and Gross Margin of HTC, 2003-2013
Shipment and Average Price of HTC, 2004-2013
Quarterly Shipment of HTC, 2009Q1-2013Q1
Revenue of HTC by Region, 2006-2011
Ownership of TCL Communication
Organization of TCL Communication
Global Distribution of TCL
Revenue and Gross Margin of TCL Communication, 2002-2012
Monthly Mobile Phone Shipment of TCL Communication, Jan.2008-Mar.2013
Revenue of TCL by Product, 2010Q1-2012Q4
Sales Volume of Smartphone of TCL Communication, 2011Q1-2012Q4
Mobile Phone Shipment of TCL Communication, 2006-2012
Mobile Phone Shipment of TCL Communication by Region, 2006-2012
Revenue of TCL Communication by Region
Revenue and Gross Margin of Compal Communications, 2004-2013
Monthly Revenue and Growth Rate of Compal Communications, Mar.2011-Mar.2013
Mobile Phone Shipment and Average Selling Price of Compal Communications, 2004-2013
Global Layout of Arima Communications
Revenue and Gross Margin of Arima Communications, 2005-2013
Monthly Revenue and YoY Growth Rate of Arima Communications, Mar.2011-Mar.2013
Mobile Phone Shipment and Growth Rate of Arima Communications, 2003-2013
Investment of Arima Communications on Chinese Mainland
Revenue and Operating Margin of FIH, 2003-2011
Revenue of FIH by Region, 2005-2012
Customers of FIH, 2012
Shipment of Major Subsidiaries under FOXCONN (Hon Hai), 2010-2012
Revenue and Gross Margin of BYD Electronic, 2004-2013
Revenue of BYD Electronic by Region, 2006-2012
Revenue of BYD Electronic by Business, 2006-2012
Revenue of BYD Electronic by Client, 2009-2011
Revenue of Flextronics, FY1995-FY2013
Revenue of Flextronics by Business, 2010Q4-2012Q4
Employees of Flextronics by Region, FY2012
Zhuhai Doumen Industrial Park
Customer Structure of Flextronics, FY2010
Terminal Revenue and Gross Margin of ZTE, 2006-2011
Mobile Phone Shipment of ZTE, 2006-2013
OEM Distribution of ZTE, 2012
Mobile Phone Shipment and Growth Rate of Huawei, 2006-2013
OEM Distribution of Huawei, 2011
Organization of Longcheer
Revenue and Operating Margin of Longcheer, FY2006-FY2013
Revenue of Longcheer by Region, FY2010-FY2012
Revenue and Gross Margin of KONKA Mobile Phone, 2006-2012
Revenue and Operating Income of ZOBEE, FY2008-FY2013
Revenue of Z-OBEE by Business, FY2008-FY2012
Revenue and Net Profit Margin of Yulong Computer Telecommunication Scientific, 2004-2013
Mobile Phone Shipment and ASP of Coolpad, 2009-2013
Revenue and Operating Margin of Shenzhen Zhenhua Communication Equipment, 2005-2011
Ownership Structure of TINNO Corporation
Revenue and Operating Income of TINNO Corporation, 2009-2012
Mobile Phone Shipment of TINNO Corporation by Region, 2012
Major Clients of TINNO Corporation
Market Occupancy of TINNO Corporation’s Clients in their Localities
如果这份报告不能满足您的要求,我们还可以为您定制报告,请 留言说明您的详细需求。
|