|
|
|
报告导航:研究报告—
TMT产业—电子半导体
|
|
2012-2013年全球及中国先进封装行业研究报告 |
 |
字数:2.7万 |
页数:162 |
图表数:185 |
|
中文电子版:8500元 |
中文纸版:4250元 |
中文(电子+纸)版:9000元 |
|
英文电子版:2500美元 |
英文纸版:2600美元 |
英文(电子+纸)版:2800美元 |
|
编号:ZYW149
|
发布日期:2013-05 |
附件:下载 |
 |
|
|
<2012-2013年全球及中国先进封装行业研究报告>包括以下内容:1、全球半导体产业概况
2、IC制造产业概况
3、IC下游行业市场概况
4、先进封装产业与市场
5、23家先进封装厂家研究
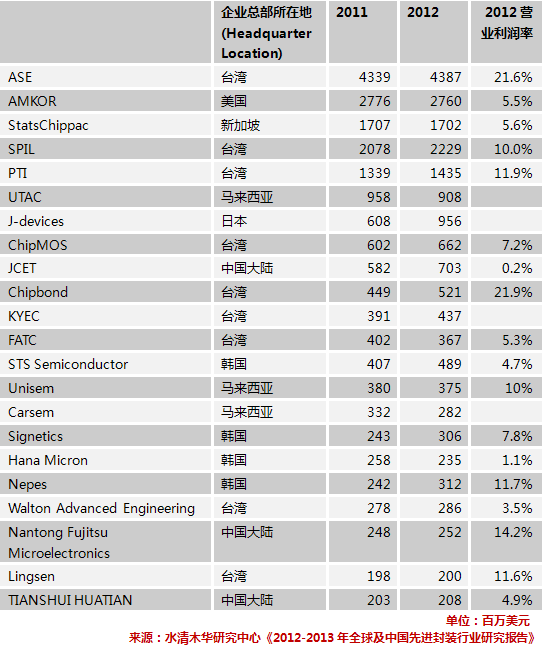
2012年全球半导体销售额下滑了2.7%;半导体设备开支下滑了15%,从2011年的435亿美元下滑到了369亿美元。2013年的半导体市场也不容乐观,全球新兴经济体全面衰退,欧洲复苏乏力。美国和日本市场相对好一些,但作为全球最大半导体市场的中国,经济增速低于预期,全球经济仍然未出现复苏的迹象。 虽然半导体产业整体下滑,但在晶圆代工(Foundry)领域仍然呈现增长, 2012年全球半导体晶圆代工市场总值达346亿美元,较2011年成长6.5%。随着智能手机、平板电脑增速放缓,预计2013年晶圆代工市场仅增长1.6%,约352亿美元以上。 先进封装厂家主要客户就是晶圆代工厂家,因此2012年先进封装厂家基本持平或微幅增长,预计2013年也是如此。黄金是先进封装厂家尤其是LCD Driver IC封装厂家必须使用的原材料,2013年金价下跌,将提高先进封装厂家的利润率。 位于马来西亚和新加坡的厂家都出现了下滑,因为这一地区的晶圆代工厂收入下滑。台湾厂家除内存封装外都有小幅度增长,主要是受益于TSMC、UMC的强力拉动。韩国企业则受益于三星的拉动。 日本企业J-devices增幅最大,主要是富士通将后端封装业务出售给了J-devices。2013年1月,日本最大的半导体厂家Renesas也将3座后端封装业务工厂出售给J-devices,2013年J-devices将会有惊人的增长,该公司预计2013财年收入超过1000亿日元,2017财年收入超过2500亿日元。 2013年表现会很好的还有台湾的Chipbond,该公司是全球最大的LCD Driver IC封装厂家。目前手机、平板电脑的屏幕分辨率(Resolution)都大幅度提升,这会大幅提高Chipbond的收入规模。黄金是Chipbond主要的原材料,金价下跌,Chipbond是最大受益者。为进一步完善产业链布局,2013年5月2日,Chinbond收购了COF Substrate厂家SIMPAL ELECTRONICS 。 Chipbond还是营业利润率最高的先进封装厂家,其营业利润率在2011年是16.7%,2012年达到21.9%。也是唯一一家营业利润率增长的公司。ASE的营业利润率紧随Chipbond,主要因为其大客户TSMC制造的都是全球最顶尖的IC,ASE也因此具备较高的利润率。 中国大陆厂家表现不佳,JECT虽然收入大幅度增长,但是营业利润率大幅下跌,从2011年的1.8%跌至2012年的0.2%,处于亏损边缘。 2011-2012年全球前23大封测厂家收入与营业利润率
Global and China Advanced Packaging Industry Report, 2012-2013 covers the followings: 1. Global Semiconductor Industry Overview; 2. IC Manufacturing Industry Overview; 3. IC Downstream Industry Market Overview; 4. Advanced Packaging Industry and Market; 5. 23 Advanced Packaging Vendors In
2012, global semiconductor sales fell 2.7%; semiconductor equipment
spending dropped by 15% to US$36.9 billion from US$43.5 billion in 2011.
The semiconductor market in 2013 is also not optimistic, accompanied by
recession of the world’s emerging economies and Europe’s sluggish
recovery. U.S. and Japanese markets are relatively better, while China,
as the world’s largest semiconductor market, has witnessed
lower-than-expected economic growth, the global economy is yet to show
signs of recovery. In spite of the overall decline in
semiconductor industry, the foundry field still grows. In 2012, the
global semiconductor foundry market reached total value of US$34.6
billion, an increase of 6.5% over 2011. With the growth slowdown of
smart phones and tablet PCs, it is expected that the foundry market in
2013 will increase by just 1.6% to exceed about US$35.2 billion. With
foundries as main customers, advanced packaging vendors were therefore
essentially flat or slightly enhanced in 2012, the same expected in
2013. The fall in price of gold, the indispensable raw material for
advanced packaging vendors, especially LCD Driver IC packaging
companies, will improve the profit margin of advanced packaging vendors
in 2013. Vendors located in Malaysia and Singapore all showed
decline, on account of the decreasing revenue of foundries in this
region. Taiwanese peers saw moderate growth except memory package,
chiefly benefiting from the strong drive of TSMC and UMC. South Korean
companies were boosted by Samsung. Among Japanese companies,
J-devices experienced the highest growth, mainly owing to the back-end
packaging business purchased from Fujitsu. In January, 2013, Japan’s
largest semiconductor vendor – Renesas also sold three back-end
packaging factories to J-devices, which would usher in amazing growth in
the coming year, with expected annual revenue in FY2013 and FY2017
outnumbering JPY100 billion and JPY250 billion, respectively. Taiwan-based
Chipbond, the world’s largest LCD Driver IC packaging vendor, will be
another eye-catching performer in 2013. The significantly enhanced
screen resolution of mobile phone and tablet PC will greatly raise
Chipbond’s earnings, and the decline in gold prices makes it the biggest
beneficiary. In order to further improve the industrial chain layout,
Chipbond acquired the COF substrate vendor - SIMPAL Electronics on May
2, 2013. In addition, Chipbond is the advanced packaging vendor
with the highest operating margin, i.e. 16.7% in 2011 and 21.9% in 2012,
but also the unique one with operating margin growth. ASE closely
followed in terms of operating margin, who benefitted from its large
customer TSMC that produced the world’s state-of-the-art IC. Chinese
Mainland counterparts performed poorly, although JECT’s revenue saw
substantial growth, yet its operating margin fell sharply from 1.8% in
2011 to 0.2% in 2012, slipping to the edge of loss. Revenue and Operating Margin of the World’s Top 23 Packaging & Testing Vendors, 2011-2012
第一章、全球半导体产业
1.1、全球半导体产业概况
1.2、中国IC市场
第二章、半导体产业格局
2.1、模拟半导体
2.2、MCU
2.3、DRAM内存产业
2.3.1、DRAM内存产业现状
2.3.2、DRAM内存厂家市场占有率
2.3.3、移动DRAM内存厂家市场占有率
2.4、NAND闪存
2.5、复合半导体产业
第三章、IC制造产业
3.1、 IC制造产业概况
3.2、晶圆代工
3.3、MEMS代工
3.4、中国晶圆代工产业
3.5、晶圆代工市场
3.5.1、全球手机市场规模
3.5.2、手机品牌市场占有率
3.5.3、智能手机市场与产业
3.5.4、PC市场
3.6、IC制造与封测设备市场
3.7、半导体材料市场
第四章、封测市场与产业
4.1、封测市场规模
4.2、封测产业格局
4.3、WLCSP市场
4.4、TSV封装
4.5、FLIP-CHIP
4.6、半导体测试
4.7、全球封测厂家排名
第五章、封测厂家研究
5.1、日月光
5.2、安靠Amkor
5.3、矽品精密SPIL
5.4、星科金朋
5.5、力成PTI
5.6、超丰Greatek
5.7、南茂科技ChipMOS
5.8、京元电子KYEC
5.9、Unisem
5.10、福懋科技FATC
5.11、江苏长电科技JECT
5.12、UTAC
5.13、菱生精密
5.14、南通富士通微电子
5.15、华东科技
5.16、颀邦科技Chipbond
5.17、J-DEVICES
5.18、MPI
5.19、STS Semiconductor
5.20、Signetics
5.21、Hana Micron
5.22、Nepes
5.23、天水华天科技
1. Global Semiconductor Industry
1.1 Overview
1.2 China IC Market
2. Semiconductor Industry Pattern
2.1 Analog Semiconductor
2.2 MCU
2.3 DRAM Industry
2.3.1 Status Quo
2.3.2 Market Share of DRAM Vendors
2.3.3 Market Share of Mobile DRAM Vendors
2.4 NAND Flash
2.5 Compound Semiconductor Industry
3. IC Manufacturing
3.1 Overview
3.2 Foundry
3.3 MEMS Foundry
3.4 China Foundry Industry
3.5 Foundry Market
3.5.1 Global Mobile Phone Market Size
3.5.2 Market Share of Mobile Phone Brands
3.5.3 Smartphone Market and Industry
3.5.4 PC Market
3.6 IC Manufacturing and Packaging & Testing Equipment Market
3.7 Semiconductor Materials Market
4. Packaging & Testing Market and Industry
4.1 Market Size
4.2 Industry Pattern
4.3 WLCSP Market
4.4 TSV Packaging
4.5 FLIP-CHIP
4.6 Semiconductor Testing
4.7 Global Vendor Ranking
5. Packaging & Testing Vendors
5.1 ASE
5.2 Amkor
5.3 SPIL
5.4 STATS ChipPAC
5.5 PTI
5.6 Greatek
5.7 ChipMOS
5.8 KYEC
5.9 Unisem
5.10 FATC
5.11 JECT
5.12 UTAC
5.13 Lingsen Precision
5.14 Nantong Fujitsu Microelectronics
5.15 Walton Advanced Engineering
5.16 Chipbond
5.17 J-DEVICES
5.18 MPI
5.19 STS Semiconductor
5.20 Signetics
5.21 Hana Micron
5.22 Nepes
5.23 Tian Shui Hua Tian Technology
1989-2016年全球IC市场规模
1990年4季度-2013年2季度全球半导体ASP
2011年1月-2013年3月半导体Book-to-Bill Ratio
1994-2012年全球晶圆产能变化
2011年全球前25大半导体厂家销售额排名
2012年全球前25大半导体厂家销售额排名
2011年模拟半导体主要厂家市场占有率
2011年Catalog 模拟半导体厂家市场占有率
2011年10大模拟半导体厂家排名
2011年MCU厂家排名
2008-2016年全球DRAM与NAND市场规模
2000-2013年DRAM产业CAPEX
2000-2013年全球DRAM出货量
2012年7月-2013年3月DRAM合约价涨跌幅
2010年1季度-2014年4季度DRAM Supply And Demand
2010年1季度-2014年4季度PC DRAM Supply And Demand
2009-2014年DRAM下游市场分布
2001-2013年 系统内存需求量
2011年4季度DRAM品牌厂商收入排名
2012年4季度品牌Dram厂商收入排名
2009-2011年Mobile DRAM 市场份额
2012年Mobile DRAM 市场份额
2012 年 品牌NAND Flash厂家市场份额
2009-2014年NAND下游市场分布
GaAs产业链
GaAs产业链主要厂家
2011-2012年全球GaAs厂家收入排名
2012年12月全球各地区Fab Installed Capacity by Minimum Geometry
2012年12月全球各地区Fab Installed Capacity by Product Type
2011年全球12英寸晶圆产能
2013全球12英寸晶圆产能
1999-2012年全球12英寸晶圆厂产能地域分布
2011年4季度-2012年4季度主要Fab支出产品分布
2010年1季度-2013年4季度全球晶圆加载产能产品分布
2010-2012年全球晶圆设备开支地域分布
2005-2012年全球Foundry销售额排名
2005-2012年全球主要Foundry运营利润率
2011年全球前30家MEMS厂家收入排名
2012年全球前20大MEMS Foundry排名
2011年中国Foundry销售额
2011年全球前25家IC设计公司排名
2008-2016年平均每部手机IC成本
2007-2014年全球手机出货量
2010-2013年全球CDMA/WCDMA手机出货量地域分布
2010-2011年每季度全球主要手机品牌出货量
2011-2012年全球主要手机厂家出货量
2012年4季度全球智能手机操作系统分布
2011-2012中国主要智能手机厂家出货量
2008-2013年全球PC用CPU与GPU 出货量
2012、2013年平板电脑主要厂家产量
2012-2014年 SE ASIA Fab分产品类型设备支出
2011-2014 SE Asia分产品产能
2007-2016全球晶圆设备投入规模
2011-2016年全球WLP封装设备开支
2011-2016年全球Die封装设备开支
2011-2016年全球自动检测设备开支
2011-2012年全球TOP 10 半导体厂家资本支出额
2013年全球TOP 10 半导体厂家CAPEX
2010-2013年全球半导体材料市场地域分布
2010-2012年全球半导体后段设备支出地域分布
2006-2014年OSAT市场规模
2007年全球IC封装类型出货量分布
2010年全球IC封装类型出货量分布
2012年全球IC封装类型出货量分布
2016年全球IC封装类型出货量分布
2007、2011、2015年全球封测市场技术分布
2012年全球OSAT产值地域分布
2014年全球OSAT产值地域分布
2007-2011年台湾封测产业收入
2010-2016年WLCSP封装市场规模
2010-2016年WLCSP出货量下游应用分布
手机CPU与GPU封装路线图
2012年FC封装下游市场分布
2002-2019年FC-BGA 技术趋势
2008-2012年全球前24大封测厂家收入与营业利润率
日月光组织结构
2005-2013年日月光收入与毛利率
2010-2012年日月光收入业务分布
2010年1季度-2011年4季度日月光铜线邦定收入
2010年1季度-2011年4季度日月光铜线邦定转换率
2010年1季度-2011年4季度日月光铜线邦定收入地理分布
2010年1季度-2011年4季度日月光铜线邦定 收入客户分布
2010年1季度-2013年1季度日月光封装部门收入、毛利率
2011年1季度-2013年1季度日月光封装部门收入类型分布
2010年1季度-2013年1季度日月光测试部门收入、毛利率
2010年1季度-2012年1季度日月光测试部门收入业务分布
2010年1季度-2013年1季度日月光材料部门收入、毛利率、运营利润率
2010年1季度-2013年1季度日月光 CAPEX与EBITDA
2012年1季度日月光10大客户
2013年1季度日月光收入下游应用
日月光中国分布
日月光上海封装类型
2004-2011年日月光上海收入
2005-2011年安靠收入与毛利率、运营利润率
2007-2012年安靠收入封装类型分布
2008年4季度-2012年4季度安靠收入封装类型分布
2008年4季度-2012年4季度安靠出货量封装类型分布
2011年安靠 CSP封装收入下游应用分布
2011年安靠 BGA封装收入下游应用分布
2011年3季度安靠 Leadframe封装收入下游应用分布
2011年3季度安靠收入与出货量地域分布
2012年安靠收入与出货量地域分布
2008年1季度-2013年1季度安靠封装业务产能利用率
2011年1季度-2013年1季度Amkor收入下游市场分布
2011-2012年安靠成本结构
矽品精密工业组织结构
2003-2013年矽品收入、毛利率、运营利润率
2011年3月-2013年3月矽品月度收入与增幅
2005-2012年4季度矽品收入地域分布
2005-2012年4季度矽品收入下游应用分布
2005-2012年4季度矽品收入业务分布
矽品2006年1季度、2007年2、3季度、2011年3、4季度产能统计
2011年3季度-2012年4季度Copper/Ag Alloy 季度收入
2004-2013年星科金朋收入与毛利率
2006-2012年1季度星科金朋收入封装类型分布
2006-2013年1季度星科金朋收入下游应用分布
2006-2013年星科金朋收入 地域分布
2006-2013年力成科技收入与运营利润率
2011年3月-2013年3月力成科技月度收入与增幅
力成科技工厂一览
力成科技的TSV解决方案
2012年4季度力成科技收入业务分布
2012年4季度力成科技收入产品分布
2005-2013年超丰电子收入、毛利率、运营利润率
2007-2010年超丰电子收入技术类型分布
2011年3月-2013年3月超丰电子月度收入与增幅
2003-2013年南茂科技收入与毛利率
2010-2012年南茂科技收入业务分布
2010-2012年南茂科技收入产品分布
2009-2012年南茂科技Utilization Rate 和EBITDA Margin
2009-2012年南茂科技Cash Flow 和CAPEX
2011年南茂科技收入客户分布
2006-2011年南茂科技收入地域分布
2002-2013年京元电子收入与毛利率
2011年3月-2013年3月京元电子月度收入
京元电子厂房分布
京元电子TESTING PLATFORMS
2006-2013年Unisem收入与EBITDA
2010年1季度-2012年4季度 Unisem收入与EBITDA
2012年Unisem收入产品分布
2012年Unisem收入市场分布
台塑集团组织结构
福懋科技组织结构
2006-2013年福懋科技收入与运营利润率
2011年3月-2012年3月福懋科技月度收入
2006-2013年JECT收入与运营利润率
2011-2012年JECT产量、销量
2011-2012年JECT 测试成本结构
2011-2012年JECT 封装成本结构
JCET路线图
2011年JCET收入地域分布
2007-2013年菱生精密收入与运营利润率
2011年3月-2013年3月菱生精密月度收入
2006-2011年南通富士通微收入与增幅
2006-2011年南通富士通微净利润与增幅
2006-2011年南通富士通微季度收入与增幅
2006-2011年南通富士通微季度净利润与增幅
2006-2011年南通富士通微季度毛利率
2006-2011年南通富士通微季度A、S、R&D
2007-2013年华东科技收入与运营利润率
2011年3月-2013年3月华东科技月度收入与增幅
2006-2013年颀邦科技收入与运营利润率
2011年3月-2013年3月颀邦科技月度收入与增幅
2012年颀邦科技收入业务分布
2009年4季度-2012年1季度欣邦收入产品分布
2012年颀邦科技收入市场分布
J-Devices 组织结构
2007-2013财年MPI收入与税前利润
MPI收入地域分布
Carsem 2011年1季度-2012年1季度收入产品分布
STS Semiconductor组织结构
2006-2013年STS Semiconductor收入与运营利润率
2012年1季度-2013年4季度STS Semiconductor收入产品分布
Signetics股东结构
2007-2013年Signetics收入与运营利润率
2010年1季度-2012年4季度 Signetics产能利用率(Utilization)与运营利润率
2011年Signetics收入产品分布
2011年Signetics收入客户分布
2012年1季度-2013年4季度 Signetics收入技术分布
2006-2013年Hana Micron收入与运营利润率
2011年Hana Micron收入客户分布
2012年1季度-2013年4季度Hana Micron收入市场分布
2007-2013年Nepes收入与运营利润率
2012-2013年Nepes季度收入与运营利润率
2012-2013年Nepes季度收入部门分布
2006-2013年天水华天收入与运营利润率
Global IC Market Size, 1989-2016
Global Semiconductor ASP, Q4 1990-Q2 2013
Semiconductor Book-to-Bill Ratio, Jan. 2011-Mar. 2013
Global Wafer Capacity Change, 1994-2012
Ranking of the World’s Top 25 Semiconductor Vendors by Sales, 2011
Ranking of the World’s Top 25 Semiconductor Vendors by Sales, 2012
Market Share of Leading Analog Semiconductor Vendors, 2011
Market Share of Catalog Analog Semiconductor Vendors, 2011
Ranking of Top 10 Analog Semiconductor Vendors, 2011
Ranking of MCU Vendors, 2011
Global DRAM and NAND Market Size, 2008-2016E
CAPEX of DRAM Industry, 2000-2013
Global DRAM Shipments, 2000-2013
DRAM Contract Price Change, Jul. 2012-Mar. 2013
DRAM Supply and Demand, Q1 2010-Q4 2014
PC DRAM Supply and Demand, Q1 2010-Q4 2014
DRAM Downstream Market Distribution, 2009-2014
Demand for System Memory, 2001-2013
Ranking of Branded DRAM Vendors by Revenue, Q4 2011
Ranking of Branded DRAM Vendors by Revenue, Q4 2012
Mobile DRAM Market Share, 2009-2011
Mobile DRAM Market Share, 2012
Market Share of Branded NAND Flash Vendors, 2012
NAND Downstream Market Distribution, 2009-2014
GaAs Industry Chain
Main Vendors in GaAs Industry Chain
Ranking of Global GaAs Vendors by Revenue, 2011-2012
Global Installed Fab Capacity by Minimum Geometry, Dec. 2012
Global Installed Fab Capacity by Product Type, Dec. 2012
Global 12-Inch Wafer Capacity, 2011
Global 12-Inch Wafer Capacity, 2013
Global 12-Inch Fab Capacity by Region, 1999-2012
Fab Expenditure by Product, Q4 2011-Q4 2012
Global Installed Wafer Capacity by Product, Q1 2010-Q4 2013
Global Wafer Equipment Spending by Region, 2010-2012
Ranking of World Foundries by Sales, 2005-2012
Operating Margin of the World’s Leading Foundries, 2005-2012
Ranking of the World’s Top 30 MEMS Vendors by Revenue, 2011
Ranking of the World’s Top 20 MEMS Foundries, 2012
China Foundry Sales, 2011
Ranking of the World’s Top 25 IC Design Companies, 2011
Average IC Cost per Phone, 2008-2016
Global Mobile Phone Shipments, 2007-2014
Global CDMA/WCDMA Mobile Phone Shipments by Region, 2010-2013
Quarterly Shipments of the World’s Top Mobile Phone Brands, 2010-2011
Shipments of the World’s Leading Mobile Phone Vendors, 2011-2012
Global Smartphone Operating System Distribution, Q4 2012
Shipments of China’s Leading Smartphone Vendors, 2011-2012
Global PC CPU/GPU Shipments, 2008-2013
Output of Leading Tablet PC Vendors, 2012 vs. 2013
Southeast Asia Fab Equipment Spending by Product Type, 2012-2014
Southeast Asia Capacity by Product, 2011-2014
Global Wafer Equipment Investment Scale, 2007-2016
Global WLP Equipment Spending, 2011-2016
Global Die Packaging Equipment Spending, 2011-2016
Global Automated Testing Equipment Spending, 2011-2016
CAPEX of the World’s Top 10 Semiconductor Vendors, 2011-2012
CAPEX of the World’s Top 10 Semiconductor Vendors, 2013
Global Semiconductor Materials Market by Region, 2010-2013
Global Semiconductor Back-end Equipment Spending by Region, 2010-2012
OSAT Market Size, 2006-2014
Distribution of Global IC Package Type Shipments, 2007
Distribution of Global IC Package Type Shipments, 2010
Distribution of Global IC Package Type Shipments, 2012
Distribution of Global IC Package Type Shipments, 2016
Global Packaging & Testing Market by Technology, 2007 vs. 2011 vs. 2015
Global OSAT Output Value by Region, 2012
Global OSAT Output Value by Region, 2014
Revenue of Taiwan Packaging & Testing Industry, 2007-2011
WLCSP Market Size, 2010-2016
WLCSP Shipments by Application, 2010-2016
Mobile Phone CPU/GPU Package Roadmap
FC Packaging Downstream Market Distribution, 2012
FC-BGA Technology Trends, 2002-2019
Revenue and Operating Margin of the World’s Top 24 Packaging & Testing Vendors, 2008-2012
Organizational Structure of ASE
Revenue and Gross Margin of ASE, 2005-2013
Revenue of ASE by Business, 2010-2012
Copper Wire Bonding Revenue of ASE, Q1 2010-Q4 2011
Copper Wire Bonding Conversion Rate of ASE, Q1 2010-Q4 2011
Copper Wire Bonding Revenue of ASE by Region, Q1 2010-Q4 2011
Copper Wire Bonding Revenue of ASE by Client, Q1 2010-Q4 2011
Revenue and Gross Margin of ASE Packaging, Q1 2010-Q1 2013
Revenue of ASE Packaging by Type, Q1 2011-Q1 2013
Revenue and Gross Margin of ASE Tests, Q1 2010-Q1 2013
Revenue of ASE Tests by Business, Q1 2010-Q1 2012
Revenue, Gross Margin and Operating Margin of ASE Material, Q1 2010-Q1 2013
CAPEX and EBITDA of ASE, Q1 2010-Q1 2013
ASE’s Top 10 Clients, Q1 2012
Revenue of ASE by Application, Q1 2013
ASE Presence in China
Package Type of ASE Shanghai
Revenue of ASE Shanghai, 2004-2011
Revenue, Gross Margin and Operating Margin of Amkor, 2005-2011
Revenue of Amkor by Package Type, 2007-2012
Revenue of Amkor by Package Type, Q4 2008-Q4 2012
Shipments of Amkor by Package Type, Q4 2008-Q4 2012
CSP Revenue of Amkor by Application, 2011
BGA Package Revenue of Amkor by Application, 2011
Leadframe Package Revenue of Amkor by Application, Q3 2011
Revenue and Shipments of Amkor by Region, Q3 2011
Revenue and Shipments of Amkor by Region, 2012
Capacity Utilization of Amkor’s Packaging Business, Q1 2008-Q1 2013
Revenue of Amkor by Application, Q1 2011-Q1 2013
Cost Structure of Amkor, 2011-2012
Organizational Structure of SPIL
Revenue, Gross Margin and Operating Margin of SPIL, 2003-2013
Monthly Revenue and Growth of SPIL, Mar. 2011-Mar. 2013
Revenue of SPIL by Region, 2005-Q4 2012
Revenue of SPIL by Application, 2005-Q4 2012
Revenue of SPIL by Business, 2005-Q4 2012
Capacity of SPIL, Q1 2006 vs. Q2-Q3 2007 vs. Q3-Q4 2011
Copper/Ag Alloy Revenue Quarterly, Q3 2011-Q4 2012
Revenue and Gross Margin of STATS ChipPAC, 2004-2013
Revenue of STATS ChipPAC by Package Type, 2006-Q1 2012
Revenue of STATS ChipPAC by Application, 2006-Q1 2013
Revenue of STATS ChipPAC by Region, 2006-2013
Revenue and Operating Margin of PTI, 2006-2013
Monthly Revenue and Growth Rate of PTI, Mar. 2011-Mar. 2013
PTI Factories
TSV Solutions of PTI
Revenue of PTI by Business, Q4 2012
Revenue of PTI by Product, Q4 2012
Revenue, Gross Margin and Operating Margin of Greatek, 2005-2013
Revenue of Greatek by Technological Type, 2007-2010
Monthly Revenue and Growth Rate of Greatek, Mar. 2011-Mar. 2013
Revenue and Gross Margin of ChipMOS, 2003-2013
Revenue of ChipMOS by Business, 2010-2012
Revenue of ChipMOS by Product, 2010-2012
Utilization Rate and EBITDA Margin of ChipMOS, 2009-2012
Cash Flow and CAPEX of ChipMOS, 2009-2012
Revenue of ChipMOS by Client, 2011
Revenue of ChipMOS by Region, 2006-2011
Revenue and Gross Margin of KYEC, 2002-2013
Monthly Revenue of KYEC, Mar. 2011-Mar. 2013
KYEC Plants
KYEC Testing Platforms
Revenue and EBITDA of Unisem, 2006-2013
Revenue and EBITDA of Unisem, Q1 2010-Q4 2012
Revenue of Unisem by Product, 2012
Revenue of Unisem by Market, 2012
Organizational Structure of Formosa Plastics Group
Organizational Structure of FATC
Revenue and Operating Margin of FATC, 2006-2013
Monthly Revenue of FATC, Mar. 2011-Mar. 2012
Revenue and Operating Margin of JECT, 2006-2013
Output and Sales Volume of JECT, 2011-2012
Testing Cost Structure of JECT, 2011-2012
Package Cost Structure of JECT, 2011-2012
JCET ROADMAP
Revenue of JCET by Region, 2011
Revenue and Operating Margin of LINGSEN, 2007-2013
Monthly Revenue of LINGSEN, Mar. 2011-Mar. 2013
Revenue and Growth Rate of Nantong Fujitsu Microelectronics, 2006-2011
Net Income and Growth Rate of Nantong Fujitsu Microelectronics, 2006-2011
Quarterly Revenue and Growth Rate of Nantong Fujitsu Microelectronics, 2006-2011
Quarterly Net Income and Growth Rate of Nantong Fujitsu Microelectronics, 2006-2011
Quarterly Gross Margin of Nantong Fujitsu Microelectronics, 2006-2011
Quarterly A, S, R&D of Nantong Fujitsu Microelectronics, 2006-2011
Revenue and Operating Margin of Walton Advanced Engineering, 2007-2013
Monthly Revenue and Growth Rate of Walton Advanced Engineering, Mar. 2011-Mar. 2013
Revenue and Operating Margin of Chipbond, 2006-2013
Monthly Revenue and Growth Rate of Chipbond, Mar. 2011-Mar. 2013
Revenue of Chipbond by Business, 2012
Revenue of Chipbond by Product, Q4 2009-Q1 2012
Revenue of Chipbond by Market, 2012
Organizational Structure of J-DEVICES
Revenue and PBT of MPI, FY2007-FY2013
Revenue of MPI by Region
Revenue of Carsem by Product, Q1 2011-Q1 2012
Organizational Structure of STS Semiconductor
Revenue and Operating Margin of STS Semiconductor, 2006-2013
Revenue of STS Semiconductor by Product, Q1 2012-Q4 2013
Shareholder Structure of Signetics
Revenue and Operating Margin of Signetics, 2007-2013
Capacity Utilization and Operating Margin of Signetics, Q1 2010-Q4 2012
Revenue of Signetics by Product, 2011
Revenue of Signetics by Client, 2011
Revenue of Signetics by Technology, Q1 2012-Q4 2013
Revenue and Operating Margin of Hana Micron, 2006-2013
Revenue of Hana Micron by Client, 2011
Revenue of Hana Micron by Market, Q1 2012-Q4 2013
Revenue and Operating Margin of Nepes, 2007-2013
Quarterly Revenue and Operating Margin of Nepes, 2012-2013
Quarterly Revenue of Nepes by Division, 2012-2013
Revenue and Operating Margin of Tian Shui Hua Tian Technology, 2006-2013
如果这份报告不能满足您的要求,我们还可以为您定制报告,请 留言说明您的详细需求。
|