|
|
|
报告导航:研究报告—
TMT产业—电子半导体
|
|
2012-2013年全球及中国被动元件行业研究报告 |
 |
字数:2.0万 |
页数:105 |
图表数:103 |
|
中文电子版:8000元 |
中文纸版:4000元 |
中文(电子+纸)版:8500元 |
|
英文电子版:2100美元 |
英文纸版:2200美元 |
英文(电子+纸)版:2400美元 |
|
编号:ZYW151
|
发布日期:2013-06 |
附件:下载 |
 |
|
|
2012-2013年全球及中国被动元件行业研究报告包括以下内容:1、被动元件简介
2、被动元件产业分析和电容、电感、电阻等细分市场分析
3、被动元件的主要下游市场分析,包括手机、PC、笔记本、平板电脑等。
4、24家被动元件厂家研究
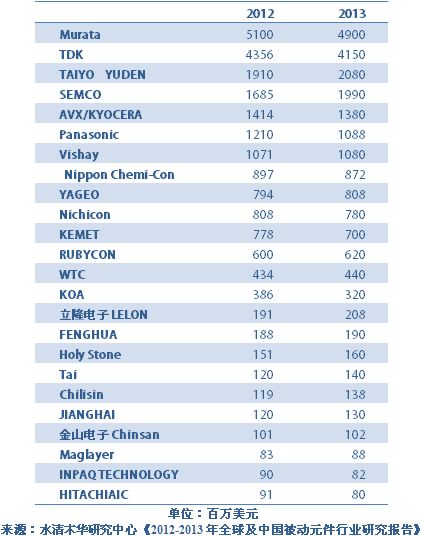
2013年被动元件产业产值预计达217亿美元,其中电容器占66%,约为144亿美元。电阻Resistor大约20亿美元,电感Inductor约30亿美元,磁性Magnetic Component元件约12亿美元。 被动元件产业主要分布在日本、台湾、美国、中国大陆和东南亚。日本占据绝对优势,占有52%的市场份额,随着日元大幅度贬值,日本所占的比例还会进一步提升。中国大陆厂家只占大约7%的份额,且大多是低端产品。由于Chip型被动元件生产高度自动化,且工厂占地面积小,大部分日本企业都在日本本土生产绝大部分产品,只有少量低端产品在中国和东南亚生产。美国企业也是绝大部分产品都在本土生产,向外转移的可能性极小。 电容可以分为陶瓷电容、铝电解电容Aluminum Electrolytic、固态电容PEDT、钽电容Tantalum和薄膜Film电容。其中以多层陶瓷电容MLCC出货量最大,产值最高,占电容市场的62%。平均每部手机需要使用大约300-400颗MLCC,每部笔记本电脑需要使用400-600颗MLCC,每部平板电脑需要使用300-400颗MLCC。随着MLCC市场容量的不断增大,一些铝电解电容的市场都被MLCC抢占了。MLCC是最具成长力度的电容,而铝电解电容未来将逐渐萎缩。铝电解电容市场主要是工业设备、白色家电、电视和PC 主板,白色家电与电视市场只能维持,电视市场还呈现微跌,台式机目前市场正在逐渐萎缩,传统的笔记本电脑市场也在急剧萎缩。Ultrabook超薄,只能使用MLCC。其余几种电容的市场都比较稳定。 2013年SEMCO会超过TDK成为全球第二大MLCC厂家,而MURATA拥有最大的产能和最优秀的技术,稳居MLCC霸主地位。以日元计算,TDK、TAIYO YUDEN在2013年也会有不错的成长,而日本厂家意味着其他厂家的萎缩,日本厂家产品品质好,唯一的缺点就是价格高,但日元贬值降低了其售价。 Nippon Chemi-Con、Nichicon、RUBYCON是铝电解电容器三强,占据高端市场,主要占据汽车、数控设备、工业电源、风力发电、LCD-TV、PC和军用市场。中国拥有数量众多的铝电解电容器厂家,因为中国在电解铝原材料价格上具备优势,不过中国厂家小而分散,主要占据空调、冰箱等白色家电领域和音响、显示器领域。 电感市场集中度很高,居于霸主地位的TDK-EPC占有49%的市场。由于电感大多是特殊规格的,毛利率高,即使产量很低的厂家也能存活,因此市场上的小厂家非常多,有些小厂年收入连100万美元都不到。在台湾有大约8家比较大的厂家,最大的Chilisin在2012年收入不过121百万美元,大陆最大的为Sunlord,2012年收入大约118百万美元。 2012、2013年全球主要被动元件厂家收入排名
The report highlights the followings: 1. Brief Introduction to Passive Components; 2. Passive Component Industry & Market Segments-Capacitor, Inductor and Resistor; 3. Main Downstream Markets of Passive Components-Cell Phone, PC, Notebook PC and Tablet Computer; 4. 24 Passive Component Companies; The
passive component industry is estimated to generate the output value of
USD21.7 billion in 2013, of which, the capacitor business will
contribute around USD14.4 billion or 66%, the resistor about USD2
billion, the inductor roughly USD3 billion, and the magnetic component
will generate USD1.2 billion or so. The passive component
industry is widespread in Japan, Taiwan, United States, Chinese Mainland
and Southeast Asia. In particular, Japan holds overwhelming
superiority, with the market share hitting 52%. With the substantial
depreciation of the Japanese yen, the market share of Japan is expected
to get further increased. By contrast, the market share of Chinese
industrial players is no more than 7%, and most of them are specialized
in the production of low-end products. Owning to the fact that the
production of Chip-based passive components is highly automatic which
implies the limited area of production base coverage, a great many of
Japanese companies prefer to produce most of their products in local
Japan, and turn to China and Southeast Asia for the production of small
quantities of low-end products. And the same is true for America which
has little possibility to transfer the production beyond the locality. The
capacitor falls into ceramic capacitor, aluminum electrolytic
capacitor, PEDT, tantalum capacitor and film capacitor. In particular,
the multi-layer ceramic capacitor (MLCC) makes up 62% in the capacitor
market, with the largest shipment and the highest output value. On
average, some 300-400 pieces of MLCCs are needed for each cellphone;
some 400-600 pieces of MLCCs are wanted for each notebook PC; and some
300-400 pieces are required for each tablet PC. With the expanding MLCC
market capacity, a part of aluminum electrolytic capacitor market is
seized by MLCC market. MLCC is a kind of capacitor with the strongest
growth momentum, while the aluminum electrolytic capacitor market is
expected to shrink in the future. The aluminum electrolytic
capacitor market mainly caters to industrial equipments, white household
appliances, TVs and PC motherboards. In particular, the application of
aluminum electrolytic capacitor in white household appliances and TVs
remains on edge or slips down, while the use in desktop and traditional
PC market is on the decline of varying degrees. Since it is ultrathin,
Ultrabook has no choice but to employ MLCC. As for other capacitors, the
markets remain stable in a relative sense. In 2013, SEMCO is
projected to catch up TDK to become the world’s second largest MLCC
company. MURATA is equipped with the highest capacity and the most
advanced technology which make it possible to dominate the MLCC market.
Calculated by the Japanese yen, both TDK and TAIYO YUDEN are expected to
see outstanding growth momentum in 2013. Japanese enterprises are best
known for first-class products but higher prices, however, the
depreciation of the Japanese yen cuts down the selling prices of
products made in Japan. Top three aluminum electrolytic
capacitor producers include Nippon Chemi-Con, Nichicon and RUBYCON which
occupy automobile, NC equipment, industrial power supply, wind power
generation, LCD-TV, PC and the military market. In China, there are
numerous aluminum electrolytic capacitor markers due to its price
superiority in raw materials of electrolytic aluminum. But these Chinese
counterparts are small and scattered, concentrating in white household
appliance, acoustics and display fields. The inductor
market features high concentration, with the industrial leader TDK-EPC
sweeping 49% market share. Due to special requirements, inductor
products are with high gross margin. Thus, even producers with very low
output can survive. In reality, there are a lot of small firms in the
market, and some of them even realize the annual revenue of less than
USD1 million. In Taiwan, there are around eight larger industrial
players, the largest one among which is Chilision that harvested the
revenue of USD121 million in 2012. In Mainland China, Sunlord boasts the
largest one, with the revenue in 2012 approximating USD118 million. Ranking of Leading Passive Component Producers Worldwide by Revenue, 2012 vs. 2013
第一章、被动组件简介
1.1、MLCC简介
1.2、LTCC
1.3、铝质电解电容与固态电容
1.4、贴片电感(SMD电感)
第二章、被动组件下游主要市场
2.1、全球手机市场规模
2.2、手机品牌市场占有率
2.3、智能手机市场与产业
2.4、中国手机产业地域分布
2.5、中国手机企业产量排名
2.6、全球PC与平板电脑市场
2.7、笔记本电脑产业
2.8、平板电脑产业
2.9、中国移动PC产业
第三章、被动组件产业
3.1、被动组件产业概况
3.2、电容
3.3、MLCC
3.4、铝电解电容
3.5、中国电容器市场
3.6、电阻
3.7、电感
3.8、被动组件产业排名
第四章、主要被动组件厂家研究
4.1、VISHAY
4.2、AVX/KYOCERA
4.3、村田MURATA
4.4、太阳诱电
4.5、TDK
4.5.1、TDK-EPC
4.6、SEMCO
4.7、日本贵弥攻NIPPON CHEMI-CON
4.8、尼吉康
4.9、立隆电子
4.10、金山电
4.11、YAGEO
4.12、基美KEMET
4.13、美磊MAGLAYER
4.14、奇立新
4.15、禾伸堂
4.16、宇阳控股
4.17、华新科
4.18、RUBYCON
4.19、KOA
4.20、松下电子部品
4.21、风华高科
4.22、江海股份
4.23、顺络电子
4.24、大毅科技
1. Profile of Passive Component
1.1 MLCC
1.2 LTCC
1.3 Aluminum Electrolytic Capacitor & Solid Capacitor
1.4 Chip Inductor (SMD Inductor)
2. Main Downstream Markets of Passive Component
2.1 Global Mobile Phone Market Scale
2.2 Mobile Phone Market Share by Brand
2.3 Smartphone Market and Industry
2.4 Geographical Distribution of China Mobile Phone Industry
2.5 Ranking of Chinese Mobile Phone Vendors by Output
2.6 PC and Tablet PC Market Worldwide
2.7 Notebook PC Industry
2.8 Tablet PC Industry
2.9 China Mobile PC Industry
3. Passive Component Industry
3.1 Overview
3.2 Capacitor
3.3 MLCC
3.4 Aluminum Electrolytic Capacitor
3.5 China Capacitor Market
3.6 Resistor
3.7 Inductor
3.8 Ranking of the Passive Component Industry
4. Leading Passive Component Companies
4.1 Vishay
4.2 AVX/KYOCERA
4.3 Murata
4.4 TAIYO YUDEN
4.5 TDK
4.5.1 TDK-EPC
4.6 SEMCO
4.7 Nippon Chemi-Con
4.8 Nichicon
4.9 LELON Electronics Corp.
4.10 Chinsan
4.11 Yageo
4.12 KEMET
4.13 Maglayer
4.14 Chilisin Electronics Corp.
4.15 HolyStone
4.16 EYANG Holdings (Group)
4.17 Walsin Technology Corporation
4.18 RUBYCON
4.19 KOA
4.20 Panasonic Electronic Devices
4.21 Fenghua Advanced Technology
4.22 Nantong Jianghai Capacitor Co.Ltd.
4.23 Shenzhen Sunlord Electronics
4.24 TA-I TECHNOLOGY
2007-2014年全球手机出货量
2010-2013年全球CDMA/WCDMA手机出货量地域分布
2010-2011年每季度全球主要手机品牌出货量
2011-2012年全球主要手机厂家出货量
2012年4季度全球智能手机操作系统分布
2011-2012中国主要智能手机厂家出货量
2012年中国手机产量地域分布
2010-2012年25家中国手机厂家产量排名
2008-2015年全球PC市场规模
2010-2015年全球Desktop与Laptop电脑出货量
2010-2016年全球TabletPC出货量
2012年全球笔记本电脑品牌厂家与代工厂家之间配套关系及出货比例
2013年全球笔记本电脑品牌厂家与代工厂家之间配套关系及出货比例
2012、2013年平板电脑主要厂家产量
2004-2012年中国笔记本电脑(包括平板电脑)产量
2010-2012年中国笔记本电脑产量(包括平板电脑)地域分布
2013年被动组件产业产值产品分布
2013年被动组件产业产值地域分布
2013年电容市场技术分布
2012年MLCC主要厂家市场占有率
2012年铝电解电容主要厂家市场占有率
2012年电阻主要厂家市场占有率
2012年电感市场主要厂家市场占有率
2010年主要电感厂家产量
2011-2013年台湾6大电感厂家收入
2012、2013年全球主要被动组件厂家收入排名
2007-2013年Vishay收入与运营利润率
2012年Vishay收入产品分布
2011年Vishay收入下游应用分布
2012年Vishay收入下游应用分布
2010年4季度-2013年1季度Vishay收入产品分布
2012年Vishay收入地域分布
2012年Vishay收入渠道分布
FY2007-FY2014 AVX 销售收入和运营利润
FY2009-FY2013 AVX 分产品收入
FY2009-FY2013 AVX 各地区收入
FY2009-FY2014 村田销售收入和运营利润率
FY2009-FY2013 村田各地区收入
2009财年3季度-2012财年4季度村田收入、新订单与Backlog
2009年3季度-2012年4季度村田运营利润、净利润
FY11Q1-FY12Q4 村田分产品订单
2011-2014财年村田收入产品分布
2011-2014财年村田收入下游应用分布
FY2006-FY2014 太阳诱电 销售收入和运营利润率
FY2012-FY2015 太阳诱电 分产品收入
FY2012-FY2015 太阳诱电 分部门收入
FY2012-FY2015 太阳诱电分地区收入
2005-2014财年TDK销售额与营业利润率
FY2012-FY2013 TDK 分产品销售收入
FY2012-FY2013 TDK 分部门利润
FY2009-F2013 TDK 收入下游应用分布
FY2009-F2013 TDK Passive Components 各年收入下游应用分布
FY2012-F2013 TDK Passive Components 各季度收入下游应用分布
2008-2011年TDK-EPC收入与EBIT
2008-2011年TDK-EPC收入产品分布
2010-2013年SEMCO收入部门分布
2010-2013年SEMCO运营利润部门分布
2011年1季度-2012年SEMCO收入与运营利润率
2011-2013 SEMCO LCR Buniness Quartely Sales
2011-2013 SEMCO LCR Buniness Quartely Sales by application
FY2006-FY2014日本贵弥攻销售收入和利润率
FY2009-FY2014 日本贵弥攻收入地区分布
FY2012-FY2014 日本贵弥攻收入产品分布
FY2009-FY2014 日本贵弥攻 收入下游应用分布
FY2005-FY2013 尼吉康收入和运营利润率
FY2005-FY2013 尼吉康收入产品分布
FY2005-FY2013 尼吉康 收入地域分布
2011年4月-2013年4月立隆电子月度收入
2011年4月-2013年4月金山电子月度收入
2006-2013 国巨销售收入和运营利润率
2011年4月-2013年4月国巨月度收入
国巨收入产品与地域分布
国巨全球分布
基美全球制造基地
Q3FY12-Q3FY13 基美收入业务分布
Q3FY12-Q3FY13 基美收入地域分布
2013财年3季度 基美收入部门分布
2013财年3季度 基美收入渠道分布
2006-2013年美磊收入与营业利润率
2011年4月-2013年4月美磊月度收入与增幅
2002-2013年奇立新收入与毛利率
2011年4月-2013年4月禾伸堂月度收入
2010年2季度-2012年3季度禾伸堂季度收入产品分布
2010年2季度-2012年3季度禾伸堂季度收入应用分布
2007-2011年禾伸堂收入地域分布
2008-2013年宇阳控股收入与净利润
2008年-2013年华新科技被动组件事业部收入与毛利率
2011年华新科技收入地域分布
2011年华新科技收入渠道分布
2008-2011年华新科技收入下游分布
华新科技全球分布
华新科技MLCC 芯片尺寸产量比
2011年华新科技收入产品分布
华新科技制造基地分布
2005-2013年RUBYCON收入
FY2011-FY2013年KOA收入下游分布
2003-2012年风华高科收入与运营利润率
2012年风华高新科技收入产品分布
2007-2013年江海股份收入与营业利润率
2011-2012江海股份产量
2005-2013年顺络电子收入与毛利率
2001-2013年大毅科技收入与毛利率
2011年4月-2013年4月大毅科技月度收入
Mobile Phone Shipment Worldwide, 2007-2014E
Global CDMA/WCDMA Shipment by Region, 2010-2013
Quarterly Mobile Phone Shipment by Brand, 2010-2011
Shipment of Main Mobile Phone Vendors Worldwide, 2011-2012
Worldwide Distribution of Smart Phone Operating System, 2012Q4
Shipment of Main Smart Phone Vendors in China, 2011-2012
Mobile Phone Output by Region in China, 2012
Ranking of 25 Mobile Phone Vendors in China by Output, 2010-2012
Global PC Market Scale, 2008-2015E
Desktop/Laptop Shipment Worldwide, 2010-2015E
Global Tablet PC Shipment, 2010-2016E
Supply Relationship and Shipment Proportion between Notebook PC Brand Vendors and OEMs, 2012
Supply Relationship and Shipment Proportion between Notebook PC Brand Vendors and OEMs, 2013
Output of Major Tablet PC Companies, 2012 vs.2013
Notebook PC (Tablet PC Included) Output in China, 2004-2012
Notebook PC (Tablet PC Included) Output by Region in China, 2010-2012
Output Value of Passive Component Industry by Product, 2013
Output Value of Passive Component Industry by Region, 2013
Capacitor Market Distribution by Technology, 2013
Market Occupancy of Major MLCC Companies, 2012
Market Occupancy of Major Aluminum Electrolytic Capacitor Companies, 2012
Market Occupancy of Major Resistor Companies, 2012
Market Occupancy of Major Inductor Companies, 2012
Output of Major Inductor Companies, 2012
Revenue of Top 6 Inductor Companies in Taiwan, 2011-2013
Ranking of Main Passive Component Companies Worldwide by Revenue, 2012 vs.2013
Revenue and Operating Margin of Vishay, 2007-2013
Revenue of Vishay by Product, 2012
Revenue of Vishay by Downstream Application, 2011
Revenue of Vishay by Downstream Application, 2012
Revenue of Vishay by Product, 2010Q4-2013Q1
Revenue of Vishay by Region, 2012
Revenue of Vishay by Channel, 2012
Sales and Operation Profit of AVX, FY2007-FY2014
Sales of AVX by Product, FY2009-FY2013
Sales of AVX by Region, FY2009-FY2013
Sales and Operation Margin of Murata, FY2009-FY2014
Sales of Murata by Region, FY2009-FY2013
Revenue ,New Orders and Backlog of Murata, FY2009Q3-FY2012Q4
Operating Profit and Net Income of Murata, 2009Q3-2012Q4
Murata Orders by Product, FY11Q1-FY12Q4
Revenue of Murata by Product, FY2011-FY2014
Revenue of Murata by Application, FY2011-FY2014
Sales and Operation Margin of TAIYO YUDEN, FY2006-FY2014
Sales of TAIYO YUDEN by product, FY2012-FY2015
Sales of TAIYO YUDEN by Segment, FY2012-FY2015
Sales of TAIYO YUDEN by Region, FY2012-FY2015
Sales and Operating Margin of TDK, FY2005-FY2014
TDK Sales by Product, FY2012-FY2013
TDK Profit by Segment, FY2012-FY2013
TDK Sales by Application, FY2009-F2013
Sales of TDK’s Passive Components Business by Application, FY2009-F2013
Quarterly Sales of TDK’s Passive Components Business by Application, FY2012-F2013
Revenue and EBIT of TDK-EPC, 2008-2011
Revenue of TDK-EPC by Product, 2008-2011
Revenue of SEMCO by Segment, 2010-2013
Operating Margin of SEMCO by Segment, 2010-2013
Revenue and Operating Margin of SEMCO, 2011Q1-2012
Quarterly Sales of SEMCO LCR Business , 2011-2013
Quarterly Sales of SEMCO LCR Business by Application, 2011-2013
Sales and Profit Margin of Nippon Chemi-Con, FY2006-FY2014
Sales of Nippon Chemi-Con by Region, FY2009-FY2014
Sales of Nippon Chemi-Con by Product, FY2012-FY2014
Sales of Nippon Chemi-Con by Application, FY2009-FY2014
Revenue and Operation Margin of Nichicon , FY2005-FY2013
Revenue of Nichicon by Product, FY2005-FY2013
Revenue of Nichicon by Region, FY2005-FY2013
Monthly Revenue of LELON Electronics Corp., Apr.2011-Apr.2013
Monthly Revenue of Chinsan, Apr.2011-Apr.2013
Sales and Operating Margin of Yageo, 2006-2013
Monthly Revenue of Yageo, Apr.2011-Apr.2013
Revenue of Yageo by Product and Region
Global Presence of Yageo
Production Bases under KEMET Worldwide
Sales of KEMET By Business, FY12 Q3-FY13 Q3
Sales of KEMET By Region, FY12 Q3-FY13Q3
Sales of KEMET by Segment, FY13 Q3
Sales of KEMET by Channel, FY13Q3
Revenue and Operating Margin of Maglayer, 2006-2013
Monthly Revenue and Growth Rate of Maglayer, Apr.2011-Apr.2013
Revenue and Gross Margin of Chilisin Electronics Corp., 2002-2013
Monthly Revenue of HolyStone, Apr. 2011-Apr.2013
Quarterly Revenue of HolyStone by Product, 2010Q2-2012Q3
Quarterly Revenue of HolyStone by Application, 2010Q2-2012Q3
Revenue of HolyStone by Region, 2007-2011
Revenue and Net Income of EYANG Holdings (Group), 2008-2013
Revenue and Gross Margin From Passive Component Business Division of Walsin Technology Corporation, 2008-2013
Revenue of Walsin Technology Corporation by Region, 2011
Revenue of Walsin Technology Corporation by Channel, 2011
Revenue Structure of Walsin Technology Corporation by Application, 2008-2011
Global Presence of Walsin Technology Corporation
MLCC Chip Output of Walsin Technology Corporation by Size
Revenue of Walsin Technology Corporation by Product, 2011
Distribution of Production Bases under Walsin Technology Corporation
Revenue of RUBYCON, 2005-2013
Revenue Structure of KOA by Application, FY2011-FY2013
Revenue and Operating Margin of Fenghua Advanced Technology, 2003-2012
Revenue of Fenghua Advanced Technology by Product, 2012
Revenue and Operating Margin of Nantong Jianghai Capacitor Co., Ltd., 2007-2013
Output of Nantong Jianghai Capacitor Co., Ltd., 2011-2012
Revenue and Gross Margin of Shenzhen Sunlord Electronics, 2005-2013
Revenue and Gross Margin of TA-I TECHNOLOGY, 2001-2013
Monthly Revenue of TA-I TECHNOLOGY, Apr.2011-Apr.2013
如果这份报告不能满足您的要求,我们还可以为您定制报告,请 留言说明您的详细需求。
|