|
|
|
报告导航:研究报告—
TMT产业—电信
|
|
2012-2015年全球及中国光纤预制棒行业研究报告 |
 |
字数:3.6万 |
页数:92 |
图表数:99 |
|
中文电子版:7500元 |
中文纸版:3750元 |
中文(电子+纸)版:8000元 |
|
英文电子版:1950美元 |
英文纸版:2050美元 |
英文(电子+纸)版:2250美元 |
|
编号:CYH016
|
发布日期:2013-06 |
附件:下载 |
 |
|
|
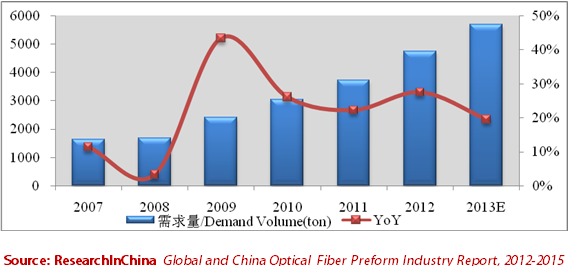
光纤预制棒是制造石英系列光纤的核心原材料。受产品生产技术限制,生产厂商主要集中在日本和欧美,其他国家主要通过进口光纤预制棒来生产光纤光缆。 2012年,中国光纤预制棒自给率约为53.96%。受“宽带中国”战略等利好政策推动,中国光纤预制棒产业处于快速发展期,长飞、亨通光电、富通集团等各大厂商积极通过收购、合资或新建等方式新增产能,提高公司竞争力。预计2013年中国光纤预制棒产能有望达到4200吨左右。 2012年全球光纤光缆需求量约2.79亿芯公里,对应光纤预制棒需求量达9200吨,主要分布于亚太地区。其中中国光纤预制棒需求量约为4753吨,占全球总需求量的51.66%。 图:2007-2013年中国光纤预制棒需求量
《2012-2015年全球及中国光纤预制棒行业研究报告》在分析了全球及中国光纤预制棒行业的市场规模、竞争格局等的基础上,对主要生产企业的运营状况、光纤预制棒相关业务发展情况进行重点分析。 长飞公司是中国光纤预制棒第一大企业,截止2012年底,公司光纤预制棒产能达到1500吨/年,光纤产能达3200万芯公里左右。2012年公司分别与云南锗业公司、山东太平洋光缆有限公司及凯乐科技合资建厂,提高公司光纤产能。2013年,公司还计划和荷兰赫劳斯合作扩大产能,建全球第二大光棒制造厂。 亨通光电公司在光纤业务的产业链布局比较完整。2012年5月,公司在巴西建设年产70万芯公里光缆的合资企业。同年,亨通光电建设年产600吨光纤预制棒(G.652)项目,建设期为两年;该项目建成后,公司将具备年产950吨光纤预制棒的生产能力。2013年5月,亨通光电与江苏南方通信科技有限公司共同设立合资公司,产能拟定为年产600万芯公里光纤。 富通集团在2011年与日本住友电工合资设立光棒企业后,2013年2月,富通集团募资建设年产500吨大尺寸光纤预制棒项目,项目建设期4年,项目投产后公司光纤预制棒产能将达1100吨/年。
Optical fiber preform is the core materials to make quartz optical
fiber. Restricted by production technology, most manufacturers are
concentrated in Japan, the United States and Europe, while other
countries mainly produce optical fiber and cable through imports of
optical fiber preform. In 2012 China’s self-sufficiency rate of
optical fiber preform was approximately 53.96%. Promoted by “Broadband
China” strategy and other favorable policies, domestic optical fiber
preform industry has been in a rapid development period; major
manufacturers such as Yangtze Optical Fibre and Cable Company Ltd.
(YOFC), Jiangsu Hengtong Photoelectric Stock Co., Ltd. and Futong Group
have actively increased capacity via acquisitions, joint ventures or new
construction so as to enhance competitiveness. The capacity is expected
to reach 4,200 tons or so in 2013. In 2012 the global demand
for optical fiber and cable was approximately 279 million core
kilometers, with corresponding demand for optical fiber preform up to
9,200 tons, mainly distributed in the Asia-Pacific region, of which,
China contributed about 4,753 tons, accounting for 51.66% of the world’s
total demand. China’s Demand for Optical Fiber Preform, 2007-2013E
On
the basis of analyzing market size, competition pattern, etc. of global
and China optical fiber preform industry, this report also focuses on
operation and optical fiber preform-related business development of key
companies. As the No.1 optical fiber preform company in China,
YOFC has achieved optical fiber preform capacity of 1,500 t/a and
optical fiber capacity of about 32 million core kilometers by the end of
2012. The same year, it established joint venture plants with Yunnan
Lincang Xinyuan Germanium Industry (Share-holding) Co., Ltd, Shandong
Pacific Fiber Optics Co., Ltd. and Kaile Science and Technology Co.,
Ltd. to improve optical fiber capacity. Besides, the company plans to
expand capacity through cooperation with Heraeus in 2013, to build the
world’s second largest optical wand manufactory. Jiangsu
Hengtong Photoelectric Stock Co., Ltd. enjoys a relatively complete
optic-fiber industrial chain layout. In May 2012, the company
established a 700,000 core kilometers/a optical cable joint venture in
Brazil. The same year, its 600 t/a Optical Fiber Preform (G.652) Project
with a construction period of two years started construction; once
completed, the company will be provided with 950 t/a optical fiber
preform. In May 2013, Jiangsu Hengtong Photoelectric Stock Co., Ltd. and
Jiangsu Nanfang Communication Technology Co., Ltd. set up a joint
venture with annual optical fiber capacity of 6 million core kilometers.
After establishing an optical wand joint venture with Japan's
Sumitomo Electric in 2011, Futong Group raised funds for the
construction of the 500 t/a Large-size Optical Fiber Preform Project in
February 2013, with a construction period of four years, once completed,
the company’s optical fiber preform capacity will reach 1,100 t/a.
第一章 光纤预制棒概述
1.1 定义
1.2 生产工艺
1.3 产业链
1.3.1 上游
1.3.2 下游
第二章 全球光纤预制棒行业发展概况
2.1 发展现状
2.2 供需分析
2.2.1 供给分析
2.2.2 需求分析
2.3 价格走势
第三章 中国光纤预制棒行业发展概况
3.1 政策环境
3.2 供需分析
3.2.1 供给分析
3.2.2 需求分析
3.3 竞争格局
3.4 进出口
3.4.1 进口
3.4.2 出口
3.5 价格走势
3.5.1 上下游价格
3.5.2 光纤预制棒价格
3.6 发展趋势
第四章 全球光纤预制棒生产企业
4.1 美国康宁
4.1.1 企业简介
4.1.2 经营情况
4.1.3 营收构成
4.1.4 研发与投资
4.1.5 光纤业务
4.1.6 在华业务
4.1.7 康宁上海
4.2 住友电工
4.2.1 企业简介
4.2.2 经营情况
4.2.3 信息通信业务
4.2.4 在华业务
4.2.5 成都中住光纤
4.3 信越化工
4.3.1 企业简介
4.3.2 经营情况
4.3.3 营收构成
4.3.4 电子与功能材料业务
4.3.5 在华业务
4.3.6 浙江信越
4.4 日本藤仓
4.4.1 企业简介
4.4.2 经营情况
4.4.3 营收构成
4.4.4 电信业务
4.4.5 在华业务
4.4.6 藤仓电子(上海)
4.5 普睿司曼
4.5.1 企业简介
4.5.2 经营情况
4.5.3 营收构成
4.5.4 电信业务
4.5.5 研发与投资
4.5.6 在华业务
4.5.7 深圳特发信息光纤有限公司
4.6 古河电力
4.6.1 企业简介
4.6.2 经营情况
4.6.3 电信业务
4.6.4 在华业务
4.6.5 苏州古河
4.7 荷兰特恩驰
4.7.1 企业简介
4.7.2 经营情况
4.7.3 在华业务
4.7.4 南京特恩驰
4.7.5 张家港特恩驰电缆有限公司
第五章 中国光纤预制棒生产企业
5.1 长飞公司
5.1.1 企业简介
5.1.2 经营情况
5.1.3 研发与投资
5.1.4 发展前景
5.2 亨通光电(600487)
5.2.1 企业简介
5.2.2 经营情况
5.2.3 营收构成
5.2.4 毛利率
5.2.5 客户与供应商
5.2.6 研发与投资
5.2.7 光纤预制棒业务
5.2.8 发展前景
5.3 中天科技(600522)
5.3.1 企业简介
5.3.2 经营情况
5.3.3 营收构成
5.3.4 毛利率
5.3.5 客户与供应商
5.3.6 研发与投资
5.3.7 发展前景
5.4 烽火通信(600498)
5.4.1 企业简介
5.4.2 经营情况
5.4.3 营收构成
5.4.4 毛利率
5.4.5 客户与供应商
5.4.6 研发与投资
5.4.7 发展前景
5.5 富通集团
5.5.1 企业简介
5.5.2 经营情况
5.5.3 营收构成
5.5.4 毛利率
5.5.5 投资
5.5.6 光纤预制棒业务
5.5.7 发展前景
5.6 法尔胜(000890)
5.6.1 企业简介
5.6.2 经营情况
5.6.3 营收构成
5.6.4 毛利率
5.6.5 客户与供应商
5.6.6 研发与投资
5.6.7 光纤预制棒业务
5.6.8 发展前景
1. Overview of Optical Fiber Preform
1.1 Definition
1.2 Production Technology
1.3 Industry Chain
1.3.1 Upstream
1.3.2 Downstream
2. Development of Global Optical Fiber Preform Industry
2.1 Status Quo
2.2 Supply & Demand
2.2.1 Supply
2.2.2 Demand
2.3 Price Trend
3. Development of China Optical Fiber Preform Industry
3.1 Policy Environment
3.2 Supply & Demand
3.2.1 Supply
3.2.2 Demand
3.3 Competition Pattern
3.4 Import & Export
3.4.1 Import
3.4.2 Export
3.5 Price Trend
3.5.1 Upstream & Downstream Prices
3.5.2 Optical Fiber Preform Price
3.6 Development Trend
4. Companies in the World
4.1 Corning
4.1.1 Profile
4.1.2 Operation
4.1.3 Revenue Structure
4.1.4 R&D and Investment
4.1.5 Optical Fiber Business
4.1.6 Business in China
4.1.7 Corning Cable Systems (Shanghai) Company, Ltd.
4.2 Sumitomo Electric Industries
4.2.1 Profile
4.2.2 Operation
4.2.3 Information & Communication
4.2.4 Business in China
4.2.5 Chengdu SEI Optical Fiber Co., Ltd.
4.3 Shin-Etsu Chemical
4.3.1 Profile
4.3.2 Operation
4.3.3 Revenue Structure
4.3.4 Electronics & Functional Materials
4.3.5 Business in China
4.3.6 Zhejiang Shin-Etsu High-Tech Chemical Co., Ltd.
4.4 Fujikura
4.4.1 Profile
4.4.2 Operation
4.4.3 Revenue Structure
4.4.4 Telecommunications Service
4.4.5 Business in China
4.4.6 Fujikura Electronics Shanghai Ltd.
4.5 Prysmian
4.5.1 Profile
4.5.2 Operation
4.5.3 Revenue Structure
4.5.4 Telecommunications Service
4.5.5 R&D and Investment
4.5.6 Business in China
4.5.7 Shenzhen SDG Information Co., Ltd.
4.6 Furukawa Electric
4.6.1 Profile
4.6.2 Operation
4.6.3 Telecommunications Service
4.6.4 Business in China
4.6.5 Suzhou Furukawa Power Optic Cable Co., Ltd. (SFPOC)
4.7 NV Twentsche Kabel Holding (TKH)
4.7.1 Profile
4.7.2 Operation
4.7.3 Business in China
4.7.4 Twentsche (Nanjing) Fibre Optics Ltd. (TFO)
4.7.5 Zhangjiagang Twentsche Cable Co., Ltd. (ZTC)
5. Companies in China
5.1 Yangtze Optical Fibre and Cable Company Ltd. (YOFC)
5.1.1 Profile
5.1.2 Operation
5.1.3 R&D and Investment
5.1.4 Development Prospects
5.2 Jiangsu Hengtong Photoelectric Stock Co., Ltd. (600487)
5.2.1 Profile
5.2.2 Operation
5.2.3 Revenue Structure
5.2.4 Gross Margin
5.2.5 Clients & Suppliers
5.2.6 R&D and Investment
5.2.7 Optical Fiber Preform Business
5.2.8 Development Prospects
5.3 Jiangsu Zhongtian Technology Co., Ltd. (600522)
5.3.1 Profile
5.3.2 Operation
5.3.3 Revenue Structure
5.3.4 Gross Margin
5.3.5 Clients & Suppliers
5.3.6 R&D and Investment
5.3.7 Development Prospects
5.4 FiberHome Telecommunication Technologies Co., Ltd. (600498)
5.4.1 Profile
5.4.2 Operation
5.4.3 Revenue Structure
5.4.4 Gross Margin
5.4.5 Clients & Suppliers
5.4.6 R&D and Investment
5.4.7 Development Prospects
5.5 Futong Group
5.5.1 Profile
5.5.2 Operation
5.5.3 Revenue Structure
5.5.4 Gross Margin
5.5.5 Investment
5.5.6 Optical Fiber Preform Business
5.5.7 Development Prospects
5.6 FASTEN (000890)
5.6.1 Profile
5.6.2 Operation
5.6.3 Revenue Structure
5.6.4 Gross Margin
5.6.5 Clients & Suppliers
5.6.6 R&D and Investment
5.6.7 Optical Fiber Preform Business
5.6.8 Development Prospects
图:光纤预制棒芯棒和包层示意图
表:光纤预制棒芯棒制造工艺对比
图:2012年光纤预制棒芯棒工艺分布比例
图:光纤预制棒下游产业链
图:2004-2013年全球(分地区)光纤预制棒需求量占比
表:2006&2012年全球主要公司光纤预制棒产能
表:2009-2013年全球(分地区)光纤光缆需求量
图:2001-2013年全球光纤预制棒需求量
图:2000-2013年全球光纤预制棒价格
表:2010-2013年中国光纤预制棒行业相关政策
图:2007-2013年中国光纤预制棒产量及同比增长
图:2007-2013年中国光纤预制棒需求量
图:2006-2013年中国光纤预制棒自给率
表:中国光纤预制棒主要生产企业股东构成及使用技术
表:2012-2013年中国光纤预制棒主要企业产能与产量
图:2010-2012年中国光纤预制棒进口量及进口金额
图:2012年中国光纤预制棒(分国家)进口量及占比(Unit:ton)
图:2010-2012年中国光纤预制棒出口量与出口金额
图:2004-2012中国光纤光缆集中采购价格
图:2008-2012年康宁营业收入与净利润
图:2012年康宁公司(分产品)营业收入及占比
表:2010-2012年康宁公司(分地区/国家)营业收入与长期资产
图:2010-2012年康宁电信业务部(分产品)营业收入
图:2009-2012年康宁公司在中国营业收入及占比
图:2006-2009年康宁光缆系统(上海)主营业务收入和利润总额
图:FY2008-FY2013年住友电工销售额
图:2006-2009年成都中住主营业务收入和利润总额
图:2013年信越化工(分部门)产品
图:FY2011-FY2013年信越化工营业收入与净利润
图:FY2013年信越化工(分业务)营业收入占比
图:FY2012-FY2013年信越化工(分地区)营业收入及占比(JPY bn)
图:FY2012-FY2013年信越化工电子与功能材料部门营业收入
图:2004-2008年浙江信越主营业务收入和利润总额
表:藤仓公司(分业务)主要产品
图:FY2008-FY2012年日本藤仓营业收入
图:FY2007-FY2012年日本藤仓净利润
表:FY2011-FY2012年日本藤仓(分地区)营业收入及占比
图:FY2010-FY2012年藤仓公司电信业务(分产品)营业收入
图:2004-2009年藤仓电子(上海)主营业务收入和利润总额
图:2010-2012年普睿司曼营业收入(EUR mIn)
图:2012年普睿司曼(分业务)营业收入占比
表:普睿司曼在中国子公司分布
图:2004-2009年深圳特发信息德拉克光纤有限公司主营业务收入和利润总额
图:FY2009-FY2013年古河电力营业收入
图:FY2009-FY2013年古河电力净利润
图:FY2010-FY2012年古河电力电信业务销售额及营业利润
图:2007-2009年苏州古河主营业务收入和利润总额
图:2008-2012年特恩驰营业收入
图:2005-2009年南京特恩驰主营业务收入和利润总额
图:2007-2009年张家港特恩驰主营业务收入和利润总额
图:2007-2012年长飞公司营业收入与净利润
图:2006-2013E年长飞公司光纤预制棒产量
表:2010-2013年长飞公司主要研发投资项目
表:2011-2015年长飞公司营业收入与净利润
图:2007-2013年亨通光电营业收入与净利润
表:2011-2012年亨通光电(分产品)产销量及产销率
表:2009-2012年亨通光电(分产品)营业收入及占比
表:2009-2012年亨通光电(分地区)主营业务收入及占比
图:2006-2012年亨通光电光通信产品毛利率
图:2009-2012年亨通光电前五名客户营业收入及占比
图:2009-2012年亨通光电前五名供应商采购金额及占比
图:2009-2012年亨通光电研发费用及占比
表:2013年亨通光电建设投资项目
表:2010-2014年亨通光电光纤预制棒产能
图:2010-2014E亨通光电光纤预制棒产量
表:2011-2015年亨通光电营业收入与净利润
表:2012年中天科技(分产品)市场份额占比及排名
图:2007-2013年中天科技营业收入与净利润
图:2010-2014E中天科技光纤预制棒产量
表:2009-2011年中天科技(分产品)营业收入及占比
表:2009-2012年中天科技(分地区)营业收入及占比
图:2009-2012年中天科技主要产品毛利率
表:2009-2012年中天科技前五名客户合计营业收入贡献及占比
表:2009-2012年中天科技前五名供应商采购金额及占比
图:2009-2012年中天科技研发费用及占比
表:2011-2015年中天科技营业收入与净利润
图:2007-2013年烽火通信营业收入和净利润
图:2010-2014E烽火通信光纤预制棒产量
表:2009-2012年烽火通信(分产品)营业收入及占比
表:2009-2012年烽火通信(分地区)营业收入及占比
图:2009-2012年烽火通信(分产品)毛利率
图:2009-2012年烽火通信前五名客户营业收入及占比
图:2009-2012年烽火通信前五名供应商采购金额及占比
表:2011-2012年烽火通信研发投入及占比
表:2011-2015年烽火通信营业收入与净利润
图:2009-2012年富通集团营业收入与净利润
表:2009-2012年富通集团(分产品)营业收入及占比
图:2009-2012年富通集团(分产品)毛利率
图:2009-2015E富通集团光纤预制棒产能及产量
表:2010-2015年富通集团营业收入与净利润
图:2009-2013年法尔胜营业收入与净利润
表:2009-2012年法尔胜(分产品)营业收入及占比
表:2009-2012年法尔胜(分地区)营业收入及占比
图:2009-2012年法尔胜(分产品)毛利率
图:2009-2012年法尔胜前五名客户营业收入贡献及占比
图:2009-2012年法尔胜前五名供应商采购金额及占比
图:2009-2012年法尔胜研发费用及占比
图:2006-2013E法尔胜光纤预制棒产量
表:2011-2015年法尔胜营业收入与净利润
Optical Fiber Preform Core Rod and Cladding Diagram
Comparison of Manufacturing Techniques for Optical Fiber Preform Core Rod
Optical Fiber Preform Core Rod Process Distribution Proportion, 2012
Optical Fiber Preform Downstream Industry Chain
Structure of Global Optical Fiber Preform Demand by Region, 2004-2013E
Optical Fiber Preform Capacity of the World’s Leading Companies, 2006 vs. 2012
Global Demand for Optical Fiber and Cable by Region, 2009-2013E
Global Demand for Optical Fiber Preform, 2001-2013E
Global Optical Fiber Preform Price, 2000-2013E
China Optical Fiber Preform Industry Related Policies, 2010-2013
China’s Optical Fiber Preform Output and YoY Growth, 2007-2013E
China’s Demand for Optical Fiber Preform, 2007-2013E
China’s Self-sufficiency Rate of Optical Fiber Preform, 2006-2013E
Shareholder Structure and Technologies of Leading Optical Fiber Preform Manufacturers in China
Capacity and Output of Leading Optical Fiber Preform Manufacturers in China, 2012-2013E
China’s Import Volume and Value of Optical Fiber Preform, 2010-2012
China’s Optical Fiber Preform Import Volume and Proportion by Country, 2012
China’s Export Volume and Value of Optical Fiber Preform, 2010-2012
China’s Centralized Purchasing Price of Optical Fiber and Cable, 2004-2012
Revenue and Net Income of Corning, 2008-2012
Revenue Structure of Corning by Product, 2012
Revenue and Long-term Assets of Corning by Region / Country, 2010-2012
Revenue of Corning's Telecommunications Business Unit by Product, 2010-2012
Revenue and Proportion of Corning in China, 2009-2012
Operating Revenue and Total Profit of Corning Cable Systems (Shanghai), 2006-2009
Sales of Sumitomo Electric Industries, FY2008-FY2013E
Operating Revenue and Total Profit of Chengdu SEI Optical Fiber, 2006-2009
Products of Shin-Etsu Chemical by Sector, 2013
Revenue and Net Income of Shin-Etsu Chemical, FY2011-FY2013E
Revenue Structure of Shin-Etsu Chemical by Business, FY2013E
Revenue Structure of Shin-Etsu Chemical by Region, FY2012-FY2013E
Revenue of Electronics & Functional Materials Division of Shin-Etsu Chemical, FY2012-FY2013E
Operating Revenue and Total Profit of Zhejiang Shin-Etsu High-Tech Chemical, 2004-2008
Main Products of Fujikura by Business
Revenue of Fujikura, FY2008-FY2012
Net Income of Fujikura, FY2007-FY2012
Revenue Structure of Fujikura by Region, FY2011-FY2012
Revenue of Fujikura’s Telecommunications Service by Product, FY2010-FY2012
Operating Revenue and Total Profit of Fujikura Electronics Shanghai, 2004-2009
Revenue of Prysmian, 2010-2012
Revenue Structure of Prysmian by Business, 2012
Subsidiaries of Prysmian in China
Operating Revenue and Total Profit of Shenzhen SDG Information, 2004-2009
Revenue of Furukawa Electric, FY2009-FY2013E
Net Income of Furukawa Electric, FY2009-FY2013E
Sales and Operating Income of Furukawa Electric’s Telecommunications Service, FY2010-FY2012
Operating Revenue and Total Profit of SFPOC, 2007-2009
Revenue of TKH, 2008-2012
Operating Revenue and Total Profit of TFO, 2005-2009
Operating Revenue and Total Profit of ZTC, 2007-2009
Revenue and Net Income of YOFC, 2007-2012
Output of Optical Fiber Preform of YOFC, 2006-2013E
Key R&D Projects of YOFC, 2010-2013
Revenue and Net Income of YOFC, 2011-2015E
Revenue and Net Income of Jiangsu Hengtong Photoelectric, 2007-2013E
Output, Sales Volume and Sales-Output Ratio of Jiangsu Hengtong Photoelectric by Product, 2011-2012
Revenue Structure of Jiangsu Hengtong Photoelectric by Product, 2009-2012
Operating Revenue Structure of Jiangsu Hengtong Photoelectric by Region, 2009-2012
Gross Margin of Optical Communication Products of Jiangsu Hengtong Photoelectric, 2006-2012
Jiangsu Hengtong Photoelectric’s Revenue from Top 5 Clients and % of Total Revenue, 2009-2012
Jiangsu Hengtong Photoelectric’s Procurement from Top 5 Suppliers and % of Total Procurement, 2009-2012
R&D Costs and % of Total Revenue of Jiangsu Hengtong Photoelectric, 2009-2012
Investment Projects of Jiangsu Hengtong Photoelectric, 2013
Capacity of Optical Fiber Preform of Jiangsu Hengtong Photoelectric, 2010-2014E
Output of Optical Fiber Preform of Jiangsu Hengtong Photoelectric, 2010-2014E
Revenue and Net Income of Jiangsu Hengtong Photoelectric, 2011-2015E
Market Shares and Rankings of Jiangsu Zhongtian Technology by Product, 2012
Revenue and Net Income of Jiangsu Zhongtian Technology, 2007-2013E
Output of Optical Fiber Preform of Jiangsu Zhongtian Technology, 2010-2014E
Revenue Structure of Jiangsu Zhongtian Technology by Product, 2009-2011
Revenue Structure of Jiangsu Zhongtian Technology by Region, 2009-2012
Gross Margin of Major Products of Jiangsu Zhongtian Technology, 2009-2012
Jiangsu Zhongtian Technology’s Revenue from Top 5 Clients and % of Total Revenue, 2009-2012
Jiangsu Zhongtian Technology’s Procurement from Top 5 Suppliers and % of Total Procurement, 2009-2012
R&D Costs and % of Total Revenue of Jiangsu Zhongtian Technology, 2009-2012
Revenue and Net Income of Jiangsu Zhongtian Technology, 2011-2015E
Revenue and Net Income of FiberHome Telecommunication Technologies, 2007-2013E
Output of Optical Fiber Preform of FiberHome Telecommunication Technologies, 2010-2014E
Revenue Structure of FiberHome Telecommunication Technologies by Product, 2009-2012
Revenue Structure of FiberHome Telecommunication Technologies by Region, 2009-2012
Gross Margin of FiberHome Telecommunication Technologies by Product, 2009-2012
FiberHome Telecommunication Technologies’ Revenue from Top 5 Clients and % of Total Revenue, 2009-2012
FiberHome Telecommunication Technologies’ Procurement from Top 5 Suppliers and % of Total Procurement, 2009-2012
R&D Costs and % of Total Revenue of FiberHome Telecommunication Technologies, 2011-2012
Revenue and Net Income of FiberHome Telecommunication Technologies, 2011-2015E
Revenue and Net Income of Futong Group, 2009-2012
Revenue Structure of Futong Group by Product, 2009-2012
Gross Margin of Futong Group by Product, 2009-2012
Capacity and Output of Optical Fiber Preform of Futong Group, 2009-2015E
Revenue and Net Income of Futong Group, 2010-2015E
Revenue and Net Income of FASTEN, 2009-2013E
Revenue Structure of FASTEN by Product, 2009-2012
Revenue Structure of FASTEN by Region, 2009-2012
Gross Margin of FASTEN by Product, 2009-2012
FASTEN’ Revenue from Top 5 Clients and % of Total Revenue, 2009-2012
FASTEN’ Procurement from Top 5 Suppliers and % of Total Procurement, 2009-2012
R&D Costs and % of Total Revenue of FASTEN, 2009-2012
Output of Optical Fiber Preform of FASTEN, 2006-2013E
Revenue and Net Income of FASTEN, 2011-2015E
如果这份报告不能满足您的要求,我们还可以为您定制报告,请 留言说明您的详细需求。
|