|
|
|
报告导航:研究报告—
农业与食品—农业
|
|
2012-2015年中国饲料行业研究报告 |
 |
字数:3.7万 |
页数:110 |
图表数:150 |
|
中文电子版:8000元 |
中文纸版:4000元 |
中文(电子+纸)版:8500元 |
|
英文电子版:2300美元 |
英文纸版:2400美元 |
英文(电子+纸)版:2600美元 |
|
编号:LT003
|
发布日期:2013-07 |
附件:下载 |
 |
|
|
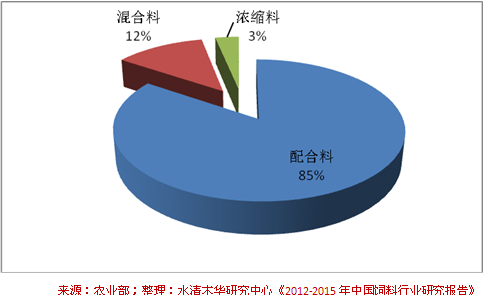
2011年中国饲料产量达1.79亿吨,成为全球第一的饲料生产国。2012年中国饲料总产量达到1.91亿吨,同比增长6.4%。其中配合饲料161.70百万吨,同比增长8.4%;浓缩饲料23.50百万吨,同比下降7.6%;预混饲料620万吨,同比增长2.5%。
图:2012年中国饲料(分类型)产量占比
从中国饲料行业竞争格局来看,中国饲料行业属于完全竞争行业,行业整体利润率偏低。2012年中国饲料加工企业整体毛利率为11%,整体净利润率5.2%,无论从绝对水平还是相对农林牧渔其他子行业均处于低水平。
经过长期的市场竞争和优胜劣汰,中国饲料业已逐步形成以少数全国性大企业集团为主导,部分中型企业占据区域性市场,大批小企业为补充的市场竞争格局。2012年中国前十大饲料公司畜禽、水产、反刍饲料相加的总销量达到了5,490万吨以上,占2012年全国饲料总销量的比重为28.7%。
新希望六和股份有限公司业务涉及饲料、养殖、肉制品及金融投资等,公司业务遍及全国并在越南、菲律宾、孟加拉、印度尼西亚、柬埔寨、斯里兰卡、新加坡、埃及等国家建成或在建20余家分子公司。
唐人神集团是首批农业产业化国家重点龙头企业。公司以“种猪、饲料、肉品”三大主业为支撑,致力生猪产业链一体化经营,在全国拥有40余家子公司。目前公司已有饲料子公司36家,总产能接近600万吨。
通威股份有限公司以饲料工业为主,同时涉足水产研究、水产养殖、肉制品加工、动物保健以及新能源等,现拥有遍布全国各地及东南亚地区的八十余家从事饲料工业生产销售的分、子公司。年饲料生产能力达700万吨,是全球最大的水产饲料生产企业及中国主要的畜禽饲料生产企业。
《2012-2015年中国饲料行业研究报告》主要包括以下内容:
1、中国饲料行业及分产品的运营情况、政策环境、市场供需及竞争格局分析等;
2、中国饲料行业上游原料及下游养殖产业链分析,主要包含豆粕、玉米、小麦、添加剂等产量、销量、供需情况等。
3、中国饲料行业发展趋势分析,从水产饲料、工业普及率以及饲料产业链三个角度来阐述。
4、包含新希望、正邦科技、唐人神、大北农等10家家主要饲料厂商经营情况、盈利水平、饲料业务及发展前景等。
In 2011, China became the world's largest feedstuff producer with an
output of 179 million tons. The feedstuff output increased by 6.4% year
on year to 191 million tons in 2012, including 161.70 million tons of
compound feed (representing a year-on-year increase of 8.4%), 23.50
million tons of concentrated feed (down 7.6% year on year) and 6.2
million tons of premixed feed (up 2.5% year on year). Output Structure of Chinese Feedstuff (by Type), 2012 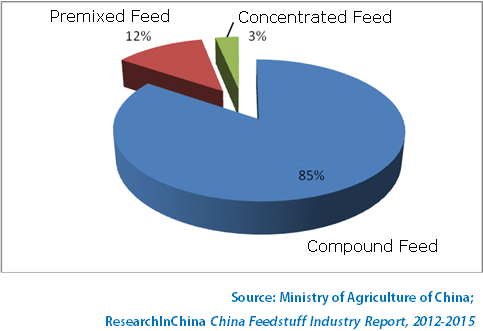 By
the competition pattern, China feedstuff industry is perfectly
competitive, with a low profit margin. In 2012, the overall gross margin
of Chinese feedstuff processing enterprises was 11% and the overall net
profit margin reached 5.2%, representing absolute and relative lower
levels compared with other sub-sectors of agriculture, forestry, animal
husbandry and fishery. After the long-term market competition,
the fittest survive, and China feedstuff industry has formed the market
competition pattern where the national market is dominated by a minority
of national conglomerates, regional markets are led by some
medium-sized enterprises and a large number of small companies play
supporting roles. In 2012, the total sales volume of livestock,
aquaculture and ruminant feedstuff of top 10 Chinese feed companies hit
more than 54.90 million tons, accounting for 28.7% of China’s total in
2012. New Hope Liuhe is engaged in feedstuff, breeding, meat
products and financial investment. The company operates its business
throughout the country and has set up or been building more than 20
branches and subsidiaries in Vietnam, the Philippines, Bangladesh,
Indonesia, Cambodia, Sri Lanka, Singapore, Egypt and other countries. Tangrenshen
acts as one of leading national agricultural industrialization
enterprises. Adhering to "breeder pigs, feed and meat products" as three
main businesses, the company is committed to the integration of the pig
industrial chain. It has over 40 subsidiary companies across China, of
which 36 are feedstuff companies, with total feedstuff capacity of
nearly 6 million tons. Tongwei Co., Ltd. focuses on the feedstuff
business, and is also involved in aquaculture, meat processing, animal
health care as well as new energy, with more than 80 branches and
subsidiaries engaged in feedstuff production and marketing throughout
China and Southeast Asia. With an annual feedstuff capacity of 7 million
tons, it has become the world's largest aquatic feedstuff producer and a
major livestock and poultry feed enterprise in China. China Feedstuff Industry Report 2012-2015 covers the following aspects:
 Operation, policies, market supply and demand as well as competition patterns of China feedstuff industry by product;
Analysis on upstream raw materials and downstream breeding industry of
China feedstuff industry, including output, sales volume, supply and
demand of soybean meal, corn, wheat and additives;
Development trends of China feedstuff industry in terms of aquaculture
feedstuff, industrial penetration and feedstuff industrial chain;
Operation, profitability and feedstuff business and outlook of 10 major
feedstuff companies such as New Hope, Zhengbang Technology, Tangrenshen
and DBN.
第一章 中国饲料行业定义及分类
1.1 定义及分类
1.2 产业链
第二章 中国饲料行业发展概况
2.1 行业运营
2.2 政策环境
2.3 市场供需
2.4 竞争格局
第三章 中国饲料行业产业链
3.1 上游原料
3.1.1豆粕
3.1.2鱼粉
3.1.3 玉米和小麦
3.1.4 添加剂
3.2 下游养殖
第四章 中国饲料行业发展趋势
4.1 水产饲料
4.2 工业饲料普及率
4.3 产业链一体化
第五章 中国主要饲料制造企业
5.1 新希望
5.1.1 公司简介
5.1.2 经营情况
5.1.3 营收构成
5.1.4 饲料业务
5.1.5 毛利率
5.1.6 客户和供应商
5.1.7 预测与展望
5.2 正邦科技
5.2.1 公司简介
5.2.2 公司经营
5.2.3 营收构成
5.2.4 饲料业务
5.2.5 毛利率
5.2.6 客户及供应商
5.2.7 预测与展望
5.3唐人神
5.3.1 公司简介
5.3.2 公司经营
5.3.3 营收构成
5.3.4 饲料业务
5.3.5 毛利率
5.3.6 预测与展望
5.4大北农
5.4.1 公司简介
5.4.2 公司经营
5.4.3 营收构成
5.4.4 毛利率
5.4.5 饲料业务
5.4.6 客户及供应商
5.4.7 预测与展望
5.5 通威股份
5.5.1 公司简介
5.5.2 公司经营
5.5.3 营收构成
5.5.4 饲料业务
5.5.5 毛利率
5.5.6 客户及供应商
5.5.7 预测与展望
5.6中牧股份
5.6.1 公司简介
5.6.2 公司经营
5.6.3 营收构成
5.6.4 饲料业务
5.6.5 毛利率
5.6.6 客户及供应商
5.6.7 预测与展望
5.7天邦股份
5.7.1 公司简介
5.7.2 公司经营
5.7.3 营收构成
5.7.4 饲料业务
5.7.5 毛利率
5.7.6 客户及供应商
5.7.7 预测与展望
5.8 正虹科技
5.8.1 公司简介
5.8.2 公司经营
5.8.3 营收构成
5.8.4 饲料业务
5.8.5 毛利率
5.8.6 客户及供应商
5.8.7 预测与展望
5.9 海大集团
5.9.1 公司简介
5.9.2 公司经营
5.9.3 营收构成
5.9.4 饲料业务
5.9.5 毛利率
5.9.6 客户及供应商
5.9.7 预测与展望
5.10 天康生物
5.10.1 公司简介
5.10.2 公司经营
5.10.3 营收构成
5.10.4 饲料业务
5.10.5 毛利率
5.10.6 客户及供应商
5.10.7 预测与展望
1 Definition and Classification of China Feedstuff Industry 1.1 Definition and Classification 1.2 Industrial Chain 2 Development of China Feedstuff Industry 2.1 Operation 2.2 Policy 2.3 Market Supply and Demand 2.4 Competition Pattern 3 China Feedstuff Industrial Chain 3.1 Upstream Raw Materials 3.1.1 Soybean Meal 3.1.2 Fish Meal 3.1.3 Corn and Wheat 3.1.4 Additive 3.2 Downstream Breeding 4 Development Trend of China Feedstuff Industry 4.1 Aquatic Feedstuff 4.2 Penetration of Industrial Feed 4.3 Industrial Chain Integration 5 Key Feedstuff Enterprises in China 5.1 New Hope 5.1.1 Profile 5.1.2 Operation 5.1.3 Revenue Structure 5.1.4 Feedstuff Business 5.1.5 Gross Margin 5.1.6 Clients and Suppliers 5.1.7 Forecast and Outlook 5.2 Zhengbang Technology 5.2.1 Profile 5.2.2 Operation 5.2.3 Revenue Structure 5.2.4 Feedstuff Business 5.2.5 Gross Margin 5.2.6 Clients and Suppliers 5.2.7 Forecast and Outlook 5.3 Tangrenshen 5.3.1 Profile 5.3.2 Operation 5.3.3 Revenue Structure 5.3.4 Feedstuff Business 5.3.5 Gross Margin 5.3.6 Forecast and Outlook 5.4 DBN 5.4.1 Profile 5.4.2 Operation 5.4.3 Revenue Structure 5.4.4 Gross Margin 5.4.5 Feedstuff Business 5.4.6 Clients and Suppliers 5.4.7 Forecast and Outlook 5.5 Tongwei 5.5.1 Profile 5.5.2 Operation 5.5.3 Revenue Structure 5.5.4 Feedstuff Business 5.5.5 Gross Margin 5.5.6 Clients and Suppliers 5.5.7 Forecast and Outlook 5.6 CAHIC 5.6.1 Profile 5.6.2 Operation 5.6.3 Revenue Structure 5.6.4 Feedstuff Business 5.6.5 Gross Margin 5.6.6 Clients and Suppliers 5.6.7 Forecast and Outlook 5.7 Ningbo Tech-bank 5.7.1 Profile 5.7.2 Operation 5.7.3 Revenue Structure 5.7.4 Feedstuff Business 5.7.5 Gross Margin 5.7.6 Clients and Suppliers 5.7.7 Forecast and Outlook 5.8 Zhenghong Science and Technology 5.8.1 Profile 5.8.2 Operation 5.8.3 Revenue Structure 5.8.4 Feedstuff Business 5.8.5 Gross Margin 5.8.6 Clients and Suppliers 5.8.7 Forecast and Outlook 5.9 Guangdong Haid Group 5.9.1 Profile 5.9.2 Operation 5.9.3 Revenue Structure 5.9.4 Feedstuff Business 5.9.5 Gross Margin 5.9.6 Clients and Suppliers 5.9.7 Forecast and Outlook 5.10 Tecon Animal Husbandry Bio-technology 5.10.1 Profile 5.10.2 Operation 5.10.3 Revenue Structure 5.10.4 Feedstuff Business 5.10.5 Gross Margin 5.10.6 Clients and Suppliers 5.10.7 Forecast and Outlook
表:饲料工业中基本概念
表:饲料行业分类
图:饲料环节及其上下游产业链
图:2000-2012年中国饲料产量
图:2012年中国饲料(分类型)产量占比
图:2012年中国饲料(分种类)产量占比
表:中国主要饲料行业法律法规政策
图:2009-2012年中国饲料产销量
表:2006-2012年中国饲料(分种类)销量
图:2007-2012年中国饲料加工企业毛利率
图:2007-2012年中国饲料企业前十强产量占比
图:2003-2012年中国年产10万吨以上饲料企业数
图:2012年中国前十大饲料企业市场份额
图:2012年中国前十大猪饲料企业市场份额
图:2007-2012年中国豆粕产量及饲料用豆粕消费量
图:2008-2013年6月中国豆粕现货均价
图:2007-2012年中国饲料用鱼粉进口量及进口单价
图:2007-2012年中国饲料用鱼粉消费量
图:2007-2012年中国玉米产量及饲料用玉米消费量
图:2007-2013年6月中国玉米现货均价
图:2007-2012年中国小麦产量及消费量
图:2007-2013年6月中国小麦现货均价
图:2005-2012年中国饲料赖氨酸产销量
表:2012-2015年中国赖氨酸厂商产能扩张情况
图:2009-2012年中国98.5%赖氨酸周价格
图:2007-2012年中国固体/液体蛋氨酸需求量
图:2009-2012年中国蛋氨酸现货价格
图:2012年中国肉类产量分布
图:2008-2012中国生猪存栏量
图:2012年中国生猪养殖饲料成本
图:2001-2011年中国鸡鸭养殖量
图:2012-2013年6月中国肉鸡/鸡苗价格
图:2005-2012年中国水产品产量
图:1990-2011年中国肉类/水产品产量
图:2006-2011年中国水产品(分种类)产量
图:2005-2011年中国水产品人工养殖产量及占比
图:2011年中国工业饲料普及率
图:中国生猪养殖规模化占比
图:中国饲料企业一体化产业链
图:2007-2013年新希望营业收入及净利润
图:2009-2012年新希望(分行业)营业收入占比
图:2010-2012年新希望饲料产品销量
表:2009-2012年新希望(分地区)营业收入占比
图:2011-2012年新希望饲料产销量及库存量
图:2008-2012年新希望饲料业务营业收入及毛利率
图:2007-2012年新希望毛利率
图:2008-2012年新希望(分行业)毛利率
图:2007-2012年新希望前五名客户营收贡献及占比
表:2012年新希望前五名供应商名称、采购额及占比
图:2007-2012年新希望前五名供应商采购额及占比
图:2012-2015年新希望营业收入、毛利率及净利润
图:2012-2015年新希望饲料产品营业收入及销量
图:2007-2013年正邦科技营业收入及净利润
图:2008-2012年正邦科技(分行业)主营收入
图:2008-2012年正邦科技(分行业)主营收入构成
图:2008-2012年正邦科技(分地区)营收占比
图:2009-2012年正邦科技饲料业务营业收入及销量
表:2006-2012年正邦科技综合及分行业毛利率
图:2007-2012年正邦科技饲料行业(分产品)毛利率
图:2006-2012年正邦科技前五名客户营收贡献及占比
图:2006-2012年正邦科技前五名供应商采购金额及占比
表:2012年正邦科技前五名供应商名称、采购额及占比
图:2011-2015年正邦科技饲料产销量及市场占有率
图:2012-2015年正邦科技营业收入及净利润
图:2008- 2013年唐人神营业收入及净利润
表:2008-2012年唐人神(分行业)营业收入
表:2008-2012年唐人神(分行业)营业收入占比
表:2008-2012年唐人神(分地区)营业收入
图:2008-2012年唐人神(分地区)营收占比
图:2008-2012年唐人神饲料业务(分产品)营业收入
图:2008-2012年唐人神饲料行业(分产品)毛利率
图:2008-2012年唐人神饲料业务(分产品)销量
图:2008-2012年唐人神毛利率
图:2008-2012年唐人神(分产品)毛利率
图:2012-2015年唐人神营业收入及净利润
表:2013年唐人神饲料新增销量
图:2007-2013年大北农营业收入及净利润
图:2007-2012年大北农(分产品)营收占比
图:2009-2012年大北农(分地区)营收占比
图:2007-2012年大北农综合毛利率
图:2007-2012年大北农(分产品)毛利率
图:2007-2012年大北农饲料业务销售额及毛利
图:2007-2012年大北农饲料产能及产销量
表:2007-2012年大北农饲料(分产品)产销量
表:大北农饲料业务近期投资计划
表:2010-2012年大北农前五名客户营收占比及前五名供应商采购金额占比
图:2012-2015年大北农营业收入及净利润
图:2013-2015年大北农饲料产能及产销量
图:2007-2013年通威股份营业收入及净利润
表:2009-2012年通威股份(分行业)营收占比
图:2007-2012年通威股份(分地区)营收占比
图:2012年通威股份饲料产能分布
图:2007-2012年通威股份饲料(分产品)销售量
图:2006-2012年通威股份毛利率
图:2009-2012年通威股份(分行业)毛利率
图:2007-2012年通威股份前五名客户贡献收入及占比
图:2012-2015年通威股份营业收入及净利润
图:2007-2013年中牧股份营业收入及净利润
图:2009-2012年中牧股份(分产品)营收占比
表:2007-2012年中牧股份(分地区)营收占比
图:2007-2012年中牧股份饲料营业收入及毛利率
图:2007-2012年中牧股份毛利率
表:2009-2012年中牧股份(分产品)毛利率
图:2007-2012年中牧股份前五名客户营收贡献及占比
图:2007-2012年中牧股份前五名供应商采购金额及占比
图:2012-2015年中牧股份营业收入及净利润
图:2012-2015年中牧股份饲料业务营业收入及毛利率
图:2007-2013年天邦股份营业收入及净利润
图:2007-2012年天邦股份(分产品)营收
图:2007-2012年天邦股份(分产品)营收占比
图:2007-2012年天邦股份(分地区)营收占比
图:2007-2012年天邦股份饲料产品营业收入及销量
图:2007-2012年天邦股份毛利率
图:2007-2012年天邦股份(分产品)毛利率
图:2007-2012年天邦股份前五名客户营收贡献及占比
图:2007-2012年天邦股份前五名供应商采购额及占比
图:2012-2015年天邦股份营业收入及净利润
图:2006-2013年正虹科技营业收入及净利润
图:2007-2012年正虹科技(分产品)营收占比
表:2007-2012年正虹科技(分地区)营业收入
图:2007-2012年正虹科技饲料及饲料原料业务营业收入及毛利率
图:2008-2012年正虹科技毛利率
图:2008-2012年正虹科技(分产品)毛利率
表:2012年正虹科技前五名客户名称、贡献收入及占比
图:2007-2012年正虹科技前五名客户贡献收入及占比
表:2012年正虹科技前五名供应商名称、采购金额及占比
图:2012-2015年正虹科技营业收入及净利润
表:海大集团产品分类及应用
图:2007-2013年海大集团营业收入及净利润
图:2007-2012年海大集团(分产品)营收占比
图:2008-2012年海大集团(分地区)营收占比
图:2008-2012年海大集团饲料(分产品)销售额
图:2008-2012年海大集团饲料(分产品)毛利率
图:2008-2012年海大集团综合毛利率
图:2008-2012年海大集团(分产品)毛利率
图:2008-2012年海大集团前五名客户营收占比及前五名供应商采购额占比
表:2012年海大集团前五名供应商采购金额及占比
表:2012年海大集团前五名供应商采购金额及占比
图:2012-2015年海大集团营业收入及净利润
图:2007-2013天康生物营业收入及净利润
图:2010-2012年天康生物(分产品)营收占比
图:2007-2012年天康生物(分地区)营收占比
图:2007-2012年天康生物饲料业务营业收入及毛利率
图:2007-2012年天康生物综合毛利率
图:2007-2012年天康生物(分产品)毛利率
表:2012年天康生物前五名客户名称、营收贡献及占比
图:2007-2012年天康生物前五名客户贡献收入及占比
表:2012年天康生物前五名供应商名称、采购金额及占比
图:2007-2012年天康生物前五名供应商采购金额占比
图:2012-2015年天康生物营业收入及净利润
Basic Concept of Feedstuff Industry
Classification of Feedstuff Industry
Sectors and Industrial Chain of Feedstuff Industry
China’s Feedstuff Output, 2000-2012
Output Structure of Chinese Feedstuff (by Type), 2012
Output Structure of Chinese Feedstuff (by Variety), 2012
Laws, Regulations and Policies of China Feedstuff Industry
China’s Feedstuff Output and Sales Volume, 2009-2012
China’s Feedstuff Sales Volume (by Variety), 2006-2012
Gross Margin of Chinese Feedstuff Processing Enterprises, 2007-2012
Output Structure of Top 10 Chinese Feedstuff Enterprises, 2007-2012
Number of Chinese Feedstuff Enterprises with Annual Output of 100,000 tons or more, 2003-2012
Market Share of Top 10 Chinese Feedstuff Enterprises, 2012
Market Share of Top 10 Chinese Pig Feedstuff Enterprises, 2012
Soybean Meal Output and Consumption of Feedstuff-use Soybean Meal in China, 2007-2012
Average Spot Price of Soybean Meal in China, 2008-Jun 2013
Import Volume and Import Unit Price of Feedstuff-use Fish Meal in China, 2007-2012
Consumption of Feedstuff-use Fish Meal in China, 2007-2012
Corn Output and Consumption of Feedstuff-use Corn in China, 2007-2012
Average Spot Price of Corn in China, 2007-Jun 2013
Wheat Output and Consumption in China, 2007-2012
Average Spot Price of Wheat in China, 2007-Jun 2013
Output and Sales Volume of Feed Lysine in China, 2005-2012
Capacity Expansion of Chinese Lysine Producers, 2012-2015E
Weekly Price of 98.5% Lysine in China, 2009-2012
Demand for Solid / Liquid Methionine in China, 2007-2012
Average Spot Price of Methionine in China, 2009-2012
Distribution of Meat Output in China, 2012
Quantity of Live Pigs in China, 2008-2012
Feedstuff Costs of Pig Breeding in China, 2012
Amount of Bred Chickens and Ducks in China, 2001-2011
Broiler / Chick Price in China, 2012-Jun 2013
Output of Aquatic Products in China, 2005-2012
Output of Meat / Aquatic Products in China, 1990-2011
Output of Aquatic Products in China by Variety, 2006-2011
Artificial Breeding Output and Proportion of Aquatic Products in China, 2005-2011
Penetration of Industrial Feedstuff in China, 2011
Proportion of Large-scale Pig Breeding in China
Integrated Industrial Chain of Chinese Feedstuff Enterprises
Revenue and Net Income of New Hope, 2007-2013
Revenue Structure of New Hope by Industry, 2009-2012
Feedstuff Sales Volume of New Hope, 2010-2012
Revenue Structure of New Hope by Region, 2009-2012
Feedstuff Output, Sales Volume and Inventory of New Hope, 2011-2012
Feedstuff Revenue and Gross Margin of New Hope, 2008-2012
Gross Margin of New Hope, 2007-2012
Gross Margin of New Hope by Industry, 2008-2012
Revenue Contribution of Top 5 Clients of New Hope, 2007-2012
Name List, Procurement Amount and % of Top 5 Suppliers of New Hope, 2012
Procurement Amount and % of Top 5 Suppliers of New Hope, 2007-2012
Revenue, Gross Margin and Net Income of New Hope, 2012-2015E
Feedstuff Revenue and Sales Volume of New Hope, 2012-2015E
Revenue and Net Income of Zhengbang Technology, 2007-2013
Operating Revenue of Zhengbang Technology by Industry, 2008-2012
Operating Revenue Structure of Zhengbang Technology by Industry, 2008-2012
Revenue Structure of Zhengbang Technology by Region, 2008-2012
Feedstuff Revenue and Sales Volume of Zhengbang Technology, 2009-2012
Consolidated Gross Margin and Gross Margin by Industry of Zhengbang Technology, 2006-2012
Gross Margin of Zhengbang Technology by Product, 2007-2012
Revenue Contribution of Top 5 Clients of Zhengbang Technology, 2006-2012
Procurement Amount and % of Top 5 Suppliers of Zhengbang Technology, 2006-2012
Name List, Procurement Amount and % of Top 5 Suppliers of Zhengbang Technology, 2012
Feedstuff Output, Sales Volume and Market Share of Zhengbang Technology, 2011-2015E
Revenue and Net Income of Zhengbang Technology, 2012-2015E
Revenue and Net Income of Tangrenshen, 2008-2013
Revenue of Tangrenshen by Industry, 2008-2012
Revenue Structure of Tangrenshen by Industry, 2008-2012
Revenue of Tangrenshen by Region, 2008-2012
Revenue Structure of Tangrenshen by Region, 2008-2012
Feedstuff Revenue of Tangrenshen by Product, 2008-2012
Feedstuff Gross Margin of Tangrenshen by Product, 2008-2012
Feedstuff Sales Volume of Tangrenshen by Product, 2008-2012
Gross Margin of Tangrenshen, 2008-2012
Gross Margin of Tangrenshen by Product, 2008-2012
Revenue and Net Income of Tangrenshen, 2012-2015E
Additional Feedstuff Sales Volume of Tangrenshen, 2013
Revenue and Net Income of DBN, 2007-2013
Revenue Structure of DBN by Product, 2007-2012
Revenue Structure of DBN by Region, 2009-2012
Consolidated Gross Margin of DBN, 2007-2012
Gross Margin of DBN by Product, 2007-2012
Feedstuff Sales and Gross Profit of DBN, 2007-2012
Feedstuff Capacity, Output and Sales Volume of DBN, 2007-2012
Feedstuff Output and Sales Volume of DBN by Product, 2007-2012
Recent Feedstuff Investment Plans of DBN
Revenue Contribution of DBN’s Top 5 Clients and Procurement Share of DBN’s Top 5 Suppliers, 2010-2012
Revenue and Net Income of DBN, 2012-2015E
Feedstuff Capacity, Output and Sales Volume of DBN, 2012-2015E
Revenue and Net Income of Tongwei, 2007-2013
Revenue Structure of Tongwei by Industry, 2009-2012
Revenue Structure of Tongwei by Region, 2007-2012
Distribution of Feedstuff Capacity of Tongwei, 2012
Feedstuff Sales Volume of Tongwei by Product, 2007-2012
Gross Margin of Tongwei, 2006-2012
Gross Margin of Tongwei by Industry, 2009-2012
Revenue Contribution of Tongwei’s Top 5 Clients, 2007-2012
Revenue and Net Income of Tongwei, 2012-2015E
Revenue and Net Income of CAHIC, 2007-2013
Revenue Structure of CAHIC by Product, 2009-2012
Revenue Structure of CAHIC by Region, 2007-2012
Feedstuff Revenue and Gross Margin of CAHIC, 2007-2012
Gross Margin of CAHIC, 2007-2012
Gross Margin of CAHIC by Product, 2009-2012
Revenue Contribution of CAHIC’s Top 5 Clients, 2007-2012
Procurement Amount and % of CAHIC’s Top 5 Suppliers, 2007-2012
Revenue and Net Income of CAHIC, 2012-2015E
Feedstuff Revenue and Gross Margin of CAHIC, 2012-2015E
Revenue and Net Income of Tech-bank, 2007-2013
Revenue of Tech-bank by Product, 2007-2012
Revenue Structure of Tech-bank by Product, 2007-2012
Revenue Structure of Tech-bank by Region, 2007-2012
Feedstuff Revenue and Sales Volume of Tech-bank, 2007-2012
Gross Margin of Tech-bank, 2007-2012
Gross Margin of Tech-bank by Product, 2007-2012
Revenue Contribution of Tech-bank’s Top 5 Clients, 2007-2012
Procurement Amount and % of Tech-bank’s Top 5 Suppliers, 2007-2012
Revenue and Net Income of Tech-bank, 2012-2015E
Revenue and Net Income of Zhenghong Science and Technology, 2006-2013
Revenue Structure of Zhenghong Science and Technology by Product, 2007-2012
Revenue of Zhenghong Science and Technology by Region, 2007-2012
Revenue and Gross Margin of Feedstuff and Feedstuff Raw Materials of Zhenghong Science and Technology, 2007-2012
Gross Margin of Zhenghong Science and Technology, 2008-2012
Gross Margin of Zhenghong Science and Technology by Product, 2008-2012
Name List and Revenue Contribution of Top 5 Clients of Zhenghong Science and Technology, 2012
Revenue Contribution of Top 5 Clients of Zhenghong Science and Technology, 2007-2012
Name List, Procurement Amount and % of Top 5 Suppliers of Zhenghong Science and Technology, 2012
Revenue and Net Income of Zhenghong Science and Technology, 2012-2015E
Product Varieties and Applications of Haid
Revenue and Net Income of Haid, 2007-2013
Revenue Structure of Haid by Product, 2007-2012
Revenue Structure of Haid by Region, 2008-2012
Feedstuff Sales of Haid by Product, 2008-2012
Feedstuff Gross Margin of Haid by Product, 2008-2012
Consolidated Gross Margin of Haid, 2008-2012
Gross Margin of Haid by Product, 2008-2012
Revenue Contribution of Haid’s Top 5 Suppliers and Procurement Share of Haid’s Top 5 Suppliers, 2008-2012
Procurement Amount and % of Haid’s Top 5 Suppliers, 2012
Revenue and Net Income of Haid, 2012-2015E
Revenue and Net Income of Tecon, 2007-2013
Revenue Structure of Tecon by Product, 2010-2012
Revenue Structure of Tecon by Region, 2007-2012
Feedstuff Revenue and Gross Margin of Tecon, 2007-2012
Consolidated Gross Margin of Tecon, 2007-2012
Gross Margin of Tecon by Product, 2007-2012
Name List and Revenue Contribution of Tecon’s Top 5 Clients, 2012
Revenue Contribution of Tecon’s Top 5 Clients, 2007-2012
Name List, Procurement Amount and % of Tecon’s Top 5 Suppliers, 2012
Procurement Share of Tecon’s Top 5 Suppliers, 2007-2012
Revenue and Net Income of Tecon, 2012-2015E
如果这份报告不能满足您的要求,我们还可以为您定制报告,请 留言说明您的详细需求。
|