|
|
|
报告导航:研究报告—
制造业—材料
|
|
2013-2016年全球及中国低辐射(Low-E)玻璃行业研究报告 |
 |
字数:4.8万 |
页数:119 |
图表数:129 |
|
中文电子版:8000元 |
中文纸版:4000元 |
中文(电子+纸)版:8500元 |
|
英文电子版:2300美元 |
英文纸版:2400美元 |
英文(电子+纸)版:2600美元 |
|
编号:CYH018
|
发布日期:2013-08 |
附件:下载 |
 |
|
|
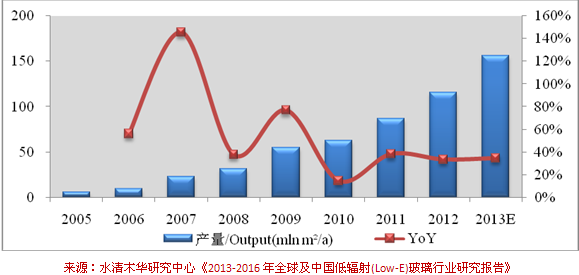
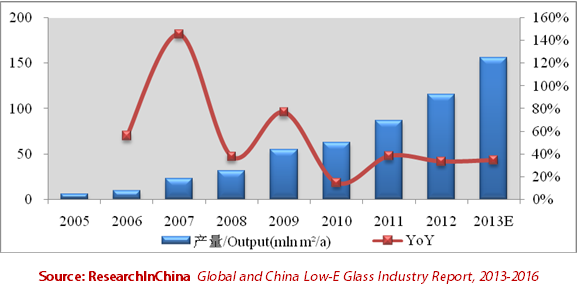
近年来,随着全球对节能减排、环境保护的日益重视,世界各国纷纷出台政策鼓励建材节能,有力推动了全球Low-E玻璃市场的发展。2000-2012年,全球Low-E玻璃市场销量以19.5%左右的年均复合增长率增长,预计2013年全球Low-E玻璃市场销量有望达到11亿平方米。 较发达国家相比,中国Low-E玻璃普及度仍处于较低水平,目前中国Low-E玻璃普及率仅10.3%。2012年,随着大量生产线的竣工和投产,中国Low-E玻璃的产量同比增长33.3%至1.16亿平方米。 图:2005-2013年中国Low-E玻璃产量
受中国节能减排、节能建筑等各大利好政策的推动,中国大量玻璃企业纷纷涉足Low-E玻璃行业,使中国Low-E玻璃生产线大幅增长至2012年的100多条,其中在线Low-E玻璃生产线发展迅猛,新增至20余条。2013-2014年,前期兴建的大批产线将陆续建成投产,大部分生产线年产能达400-1000万平方米。 《2013-2016年全球及中国低辐射(Low-E)玻璃行业研究报告》主要对全球及中国低辐射玻璃行业的政策环境、技术环境、生产成本、生产线及产能、竞争格局以及需求状况进行分析,同时对全球及中国17家Low-E玻璃生产企业运营状况、Low-E业务发展情况等进行重点分析。 南玻集团均为离线型Low-E玻璃产品,2011年以来,南玻集团Low-E玻璃调整产品结构,定位中高端市场,逐步淘汰第一代Low-E玻璃,替代为第二代和第三代Low-E玻璃,实现差异化发展。截止2012年底,南玻集团拥有1200 万平米/年Low-e镀膜中空玻璃和600万平米/年的Low-e镀膜大板玻璃。2013-2014年,集团进一步完善Low-E玻璃产业布局,在咸宁、吴江新增3条Low-E玻璃生产线,新增年产能达540万平米。 台玻集团近几年加速Low-E玻璃生产线的扩充,同时增加在线Low-E玻璃生产线。2012年,台玻华南、太仓、台玻武汉等新建Low-E玻璃生产线纷纷投产,扩充后,台玻集团Low-E玻璃生产线11条,产能达4600万平米/年。2013年6月-7月,台玻集团在安徽和陕西咸阳的1200t/d在线Low-E浮法玻璃生产线先后点火投产,此两条线是目前世界范围内单体产能最大的两条玻璃生产线。同年7月,台玻咸阳开工新建Low-E玻璃生产线,预期新增产能达800万平米/年。 旗滨集团以发展在线Low-E玻璃为主。截止2012年底,旗滨集团在线低辐射low-E节能镀膜玻璃生产线有2条,日熔化量600吨。2012年5月,根据规划,旗滨集团实施整体搬迁改造,新建1条漳州600t/d在线Low-E镀膜玻璃生产线和1条700t/d在线Low-E镀膜玻璃产线,两条线分别计划于2013下半年和2014年12月前投产。
With the growing focus on energy conservation, emission reduction and
environmental protection, countries in the world have successively
introduced policies to encourage energy-efficient building materials,
thus powerfully boosting the development of global low-E glass market
whose sales volume showed a CAGR of about 19.5% in 2000-2012, and it is
expected to reach 1.1 billion square meters in 2013. Compared to
developed countries, low-E glass popularity in China is still at a low
level, merely 10.3%. In 2012, with completion and commissioning of a
large number of production lines, China's low-E glass output rose 33.3%
YoY to 116 million square meters. Low-E Glass Output in China, 2005-2013
Motivated
by the Chinese energy conservation, energy-efficient buildings and
other favorable policies, a large number of domestic glass companies
have set foot in the low-E glass industry, resulting in a significant
increase in production lines, outnumbering 100 in 2012, including over
20 new online low-E glass production lines. In 2013-2014, a great number
of production lines built in early days will be completed and put into
operation in succession, most of which can reach annual capacity of 4-10
million square meters. Global and China Low-E Glass Industry
Report, 2013-2016 mainly analyzes policy environment, technological
environment, production costs, production lines and capacity,
competitive landscape as well as demand conditions of global and China
low-E glass industry, but also lays emphasis on operating conditions,
low-E business development, etc. of 17 domestic and foreign companies. CSG
Holding Co., Ltd. mainly produces off-line low-E glass products. Since
2011, it has adjusted low-E glass product structure, positioned in the
medium- and high-end market, by degrees eliminated the first generation
of low-E glass, replaced with the second and third generation to achieve
differentiation development. As of the end-2012, CSG had had 12-million
square meters/year low-E coated hollow glass and 6-million square
meters/year low-E coated plate glass. In 2013-2014, it will further
improve low-E glass industry layout, add three low-E glass production
lines in Xianning and Wujiang, with new capacity up to 5.4 million
square meters per year. Taiwan Glass Group has accelerated
expansion of low-E glass production line in recent years, while
increasing online low-E glass production line. In 2012, low-E production
lines newly built by TG Huanan Glass, TG Taicang Architectural Glass
and TG Wuhan Architectural Glass were successively put into production.
After the expansion, the Group will possess 11 low-E glass production
lines, with capacity reaching 46 million square meters/a. In June-July
2013, its 1,200t/d online low-E float glass production lines in Anhui
Province and Xianyang (Shaanxi Province) were ignited and put into
production one after another, provided with the largest single unit
capacity on a global scale. In July of the same year, TG Xianyang Glass
embarked on the construction of low-E glass production line, with new
capacity expected to be eight million square meters/a. Zhuzhou
Kibing Group Co., Ltd gives priority to the development of online low-E
glass. By the end of 2012, it had had two online energy-efficient low-E
coated glass production lines, with daily melting capacity of 600 tons.
In May, 2012, the Group according to the plan implemented the overall
relocation and transformation, i.e. new construction of one Zhangzhou
600t/d online low-E coated glass production line and a 700t/d online
low-E coated glass production line, respectively planned to be put into
production in the second half of 2013 and before December 2014.
第一章 低辐射玻璃行业概述
1.1 定义与分类
1.2 节能效果
第二章 全球低辐射玻璃行业发展状况
2.1 发展历程
2.2 主要国家建筑节能政策
2.2.1 德国
2.2.2 美国
2.2.3 日本
2.3 应用现状
第三章 中国低辐射玻璃行业运行环境分析
3.1 政策环境
3.2 社会环境
3.2.1 环境保护
3.2.2 居民消费水平
3.3 技术环境
第四章 中国低辐射玻璃生产状况
4.1 生产成本
4.2 供给
4.2.1 产能
4.2.2 产量
4.3 竞争格局
4.4 发展趋势
第五章 中国低辐射玻璃需求状况
5.1 推广Low-E玻璃的重要性
5.2 应用现状
5.3 价格
5.4 需求量
5.5 发展趋势
第六章 全球重点企业分析
6.1 PPG Industries
6.1.1 企业简介
6.1.2 经营情况
6.1.3 营收构成
6.1.4 玻璃业务
6.1.5 在华业务
6.2 NSG
6.2.1 企业简介
6.2.2 经营情况
6.2.3 营收构成
6.2.4 建筑玻璃业务/Architectural Glass Business
6.2.5 在华业务
6.3 AGC
6.3.1 企业简介
6.3.2 经营情况
6.3.3 营收构成
6.3.4 玻璃业务
6.3.5 在华业务
6.3.6 旭硝子特种玻璃(大连)有限公司
6.4 Saint-Gobain
6.4.1 企业简介
6.4.2 经营情况
6.4.3 营收构成
6.4.4 玻璃业务
6.4.5 在华业务
6.4.6 圣戈班玻璃有限公司
第七章 中国重点企业分析
7.1 南玻集团(000012.SZ)
7.1.1 企业简介
7.1.2 经营情况
7.1.3 营收构成
7.1.4 毛利率
7.1.5 研发与投资
7.1.6 工程玻璃业务
7.1.7 发展前景
7.2 台玻集团(1802.TW)
7.2.1 企业简介
7.2.2 经营情况
7.2.3 Low-E玻璃业务
7.2.4 台玻长江玻璃有限公司
7.2.5 台玻成都玻璃有限公司(CDG)
7.2.6 台玻安徽玻璃有限公司
7.2.7 台玻咸阳玻璃有限公司
7.3 信义玻璃(00868.HK)
7.3.1 企业简介
7.3.2 经营情况
7.3.3 营收构成
7.3.4 毛利率
7.3.5 Low-E玻璃业务
7.3.6 发展前景
7.4 耀皮玻璃(600819.SH)
7.4.1 企业简介
7.4.2 经营情况
7.4.3 营收构成
7.4.4 毛利率
7.4.5 研发与投资
7.4.6 建筑加工玻璃业务
7.5 中国玻璃(3300.HK)
7.5.1 企业简介
7.5.2 经营情况
7.5.3 营收构成
7.5.4 毛利率
7.5.5 Low-E玻璃业务
7.5.6 发展前景
7.6 蓝星玻璃
7.6.1 企业简介
7.6.2 经营情况
7.6.3 投资
7.6.4 Low-E玻璃业务
7.7 耀华玻璃
7.7.1 企业简介
7.7.2 经营情况
7.7.3 发展动态
7.8 中航三鑫(002163.SZ)
7.8.1 企业简介
7.8.2 经营情况
7.8.3 营收构成
7.8.4 毛利率
7.8.5 研发与投资
7.8.6 Low-E玻璃业务
7.8.7 发展前景
7.9 厦门明达
7.9.1 企业简介
7.9.2 经营情况
7.9.3 Low-E玻璃业务
7.10 旗滨集团(601636.sh)
7.10.1 企业简介
7.10.2 经营情况
7.10.3 营收构成
7.10.4 毛利率
7.10.5 投资
7.10.6 Low-E玻璃业务
7.11 金晶科技(600586)
7.11.1 企业简介
7.11.2 经营情况
7.11.3 营收构成
7.11.4 毛利率
7.11.5 研发与投资
7.11.6 Low-E玻璃业务
7.11.7 发展前景
7.12 中山格兰特
7.13 华东镀膜
1. Overview of Low-E Glass Industry
1.1 Definition and Classification
1.2 Energy-saving Effect
2. Development of Global Low-E Glass Industry
2.1 Development History
2.2 Building Energy-saving Policies in Major Countries
2.2.1 Germany
2.2.2 USA
2.2.3 Japan
2.3 Application Status
3. Operating Environment for China Low-E Glass Industry
3.1 Policy
3.2 Society
3.2.1 Environmental Protection
3.2.2 Level of Consumption
3.3 Technology
4. China Low-E Glass Production
4.1 Cost of Production
4.2 Supply
4.2.1 Capacity
4.2.2 Output
4.3 Competition
4.4 Trends
5. China Low-E Glass Demand
5.1 Importance of Promoting Low-E Glass
5.2 Application
5.3 Price
5.4 Demand
5.5 Trends
6. Global Key Companies
6.1 PPG Industries
6.1.1 Profile
6.1.2 Operation
6.1.3 Revenue Structure
6.1.4 Glass Business
6.1.5 Business in China
6.2 NSG
6.2.1 Profile
6.2.2 Operation
6.2.3 Revenue Structure
6.2.4 Architectural Glass Business
6.2.5 Business in China
6.3 AGC
6.3.1 Profile
6.3.2 Operation
6.3.3 Revenue Structure
6.3.4 Glass Business
6.3.5 Business in China
6.3.6 AGC Flat Glass (Dalian)
6.4 Saint-Gobain
6.4.1 Profile
6.4.2 Operation
6.4.3 Revenue Structure
6.4.4 Glass Business
6.4.5 Business in China
6.4.6 Saint-Gobain Glass
7. Key Enterprises in China
7.1 CSG Holding Co., Ltd. (000012.SZ)
7.1.1 Profile
7.1.2 Operation
7.1.3 Revenue Structure
7.1.4 Gross Margin
7.1.5 R&D and Investment
7.1.6 Architectural Glass Business
7.1.7 Development Prospect
7.2 Taiwan Glass Group (1802.TW)
7.2.1 Profile
7.2.2 Operation
7.2.3 Low-E Glass Business
7.2.4 TG Changjiang Glass
7.2.5 TG Chengdu Glass (CDG)
7.2.6 TG Anhui Glass
7.2.7 TG Xianyang Glass
7.3 Xinyi Glass (00868.HK)
7.3.1 Profile
7.3.2 Operation
7.3.3 Revenue Structure
7.3.4 Gross Margin
7.3.5 Low-E Glass Business
7.3.6 Development Prospect
7.4 Shanghai Yaohua Pilkington Glass Group (600819.SH)
7.4.1 Profile
7.4.2 Operation
7.4.3 Revenue Structure
7.4.4 Gross Margin
7.4.5 R&D and Investment
7.4.6 Architectural Processed Glass Business
7.5 China Glass (3300.HK)
7.5.1 Profile
7.5.2 Operation
7.5.3 Revenue Structure
7.5.4 Gross Margin
7.5.5 Low-E Glass Business
7.5.6 Development Prospect
7.6 Blue Star Glass
7.6.1 Profile
7.6.2 Operation
7.6.3 Investment
7.6.4 Low-E Glass Business
7.7 Yaohua Glass
7.7.1 Profile
7.7.2 Operation
7.7.3 Development Trend
7.8 AVIC SANXIN (002163.SZ)
7.8.1 Profile
7.8.2 Operation
7.8.3 Revenue Structure
7.8.4 Gross Margin
7.8.5 R&D and Investment
7.8.6 Low-E Glass Business
7.8.7 Development Prospect
7.9 Intex Glass (Xiamen)
7.9.1 Profile
7.9.2 Operation
7.9.3 Low-E Glass Business
7.10 Zhuzhou Kibing Group (601636.SH)
7.10.1 Profile
7.10.2 Operation
7.10.3 Revenue Structure
7.10.4 Gross Margin
7.10.5 Investment
7.10.6 Low-E Glass Business
7.11 Shandong Jinjing Science & Technology (600586)
7.11.1 Profile
7.11.2 Operation
7.11.3 Revenue Structure
7.11.4 Gross Margin
7.11.5 R&D and Investment
7.11.6 Low-E Glass Business
7.11.7 Development Prospect
7.12 Zhongshan Grandglass Industrial Co.,Ltd
7.13 Suzhou Huadong Coating Glass Co.,Ltd
图:节能玻璃分类
图:Low-E玻璃关系划分
表:离线法与在线法Low-E玻璃的区别
表:低辐射玻璃主要品种及适用性
图:各种玻璃传热系数对比
表:各种玻璃节能效果对比
图:全球Low-E玻璃发展历程
表:德国建筑节能相关政策
表:德国窗户传热系数限值标准
表:1975-2013年美国建筑节能相关政策
图:1975-2015年美国居住建筑及商业建筑能源效率改善趋势
图:1987-2004年美国Low-E玻璃消费量
表:1979-2013年日本建筑节能相关政策
图:1990-2013年全球Low-E玻璃销量及复合增速
图:1991-2007年欧洲主要国家Low-E玻璃在建筑领域市场份额销量及复合增速
图:2011年全球主要国家Low-E玻璃普及率
表:国外Low-E玻璃工艺及主要生产企业
表:1986-2013年中国建筑节能相关政策及法规
表:2007-2013年中国玻璃行业相关贸易政策
图:各种玻璃CO2、SO2排放量对比
图:2004-2013年中国城镇家庭人均全年住房消费性支出
图:中国Low-E设备来源占比
图:Low-E玻璃制造成本结构(以进口设备为例)
图:Low-E玻璃单位加工成本
表:2013-2014年中国Low-E玻璃(分企业/分地区)生产线及产能
图:2005-2013年中国Low-e玻璃设计产能和实际产能
表:中国采用国产设备的Low-E玻璃生产线
图:2005-2013年中国Low-E玻璃产量
图:2011-2012年中国Low-E玻璃(分企业)设计产能占比
图:2008-2013年中国Low-E玻璃主要企业营业收入
表:2010-2015中国Low-E玻璃产能及产量
图:中国社会总能耗中各种能耗占比
图:中国北方住宅建筑能耗中各种能耗占比
图:2010-2012年中国Low-E玻璃与浮法玻璃均价
图:2012-2013年中国5mm单银Low-E玻璃均价走势
图:2006-2013年中国建筑玻璃及Low-E玻璃需求量
表:2010-2015年中国Low-E玻璃需求量
图:截止2013年2月21日PPG工厂(分地区)分布
图:2008-2013年PPG营业收入与净利润
表:2009-2013年PPG(分业务)营业收入及占比
表:2009-2012年PPG(分地区)营业收入及占比
图:PPG玻璃业务结构
图:2007-2013年PPG工业玻璃业务营业收入与净利润
表:PPG在中国的Low-E玻璃业务合作情况
图:FY2009-FY2013年NSG营业收入与净利润
表:FY2009-FY2013年NSG(分业务)营业收入及占比
表:FY2013年NSG(分地区/分业务)营业收入及占比
图:FY2009-FY2013年NSG建筑玻璃业务营业收入与营业利润
图:FY2012-FY2013年NSG建筑玻璃业务(分地区)营业收入占比
表:2012年NSG在中国主要子公司分布
图:2007-2008年天津NSG安全玻璃有限公司营业收入与利润总额
图:AGC(分地区)玻璃生产线
图:2008-2013年AGC营业收入与净利润
图:2010-2012年AGC集团(分产品)营业收入及占比
图:2011-2012年AGC集团(分地区)营业收入及占比
图:AGC集团玻璃业务主要产品及服务
图:2009-2013年AGC玻璃业务营业收入与同比增长
图:截止2012年底AGC在中国(分产品)主要子公司
图:2007-2009年旭硝子特种玻璃(大连)有限公司营业收入与利润总额
图:2009-2012年圣戈班营业收入与净利润
图:2009-2013年圣戈班(分业务)营业收入占比
图:2009-2013年圣戈班(分地区)营业收入占比
图:2012年圣戈班平板玻璃业务产品
图:2009-2013年圣戈班平板玻璃业务营业收入与营业利润
图:2012年圣戈班平板玻璃业务(分地区)营业收入占比
图:2012年圣戈班玻璃业务(分用途)营业收入占比
图:2002-2012年圣戈班在中国的销售额
表:2012年圣戈班玻璃业务在中国的主要企业营业收入及主要产品
图:南玻集团产业链结构
图:2007-2013年南玻集团营业收入与净利润
表:2008-2012年南玻集团(分产品)营业收入及占比
表:2008-2012年南玻集团(分地区)营业收入及占比
表:2008-2012年南玻集团(分产品)毛利率
表:截止2012年底南玻集团工程玻璃相关建设项目
表:2011-2012年南玻集团工程玻璃业务主要子公司营业收入及产品产能
表:2004-2014年南玻集团(分产品/分地区)工程玻璃产能
表:2011-2016年南玻集团营业收入与净利润
图:2008-2013年台玻集团营业收入与净利润
表:台玻集团(分工厂)Low-E玻璃生产线及产能
表:长江玻璃公司基本信息
表:长江玻璃产品生产线情况
表:台玻安徽玻璃生产线项目
图:2007-2013年信义集团营业收入与净利润
图:2007-2013年信义玻璃(分产品)营业收入占比
图:2007-2013年信义玻璃(分地区)营业收入占比
图:2008-2013年信义玻璃(分产品)毛利率
表:信义玻璃主要Low-E玻璃生产线及产能
表:2011-2016年信义玻璃营业收入与净利润
图:2007-2013年耀皮玻璃营业收入与净利润
表:2008-2012年耀皮玻璃(分产品)营业收入及占比
图:2006-2012年耀皮玻璃(分地区)营业收入
图:2006-2012年耀皮玻璃(分产品)毛利率
表:耀皮玻璃拟建设项目
表:2009-2014年耀皮玻璃Low-E玻璃(分地区)生产线及产能
图:2007-2012年中国玻璃营业收入与净利润
表:2010-2012年中国玻璃(分产品)营业收入及占比
表:2008-2012年中国玻璃(分地区)营业收入
表:2010-2012年中国玻璃(分产品)毛利润和毛利率
表:中国玻璃Low-E玻璃生产线及产能
表:2011-2016年中国玻璃营业收入与净利润
图:2007-2012年蓝星玻璃营业收入与净利润
表:山东蓝星低辐射玻璃主要工程案例
表:耀华玻璃主要产品及子公司
图:2004-2009年耀华玻璃营业收入与利润总额
表:2012年中航三鑫子公司营业收入与净利润
图:2007-2013年中航三鑫营业收入与净利润
表:2008-2012年中航三鑫(分产品)营业收入及占比
表:2008-2012年中航三鑫(分地区)营业收入及占比
图:2008-2012年中航三鑫(分产品)毛利率
表:截止2012年底中航三鑫在建工程及拟建项目
表:中航三鑫Low-E玻璃产品分类及规格
表: 2013年中航三鑫Low-E玻璃生产线
表:2011-2016年中航三鑫营业收入与净利润
图:2004-2009年厦门明达营业收入和利润总额
图:2013年旗滨集团(分公司)产品生产线及产能
图:2008-2013年旗滨集团营业收入与净利润
表:2008-2012年旗滨集团(分产品)营业收入及占比
表:2008-2012年旗滨集团(分地区)营业收入及占比
图:2008-2012年旗滨集团(分产品)毛利率
表:2013-2015年旗滨集团主要建设项目
表:旗滨集团Low-E玻璃产品产能
图:2006-2013年金晶科技营业收入与净利润
表:2008-2012年金晶科技(分产品)营业收入及占比
表:2008-2012年金晶科技(分地区)营业收入及占比
图:2008-2012年金晶科技(分产品)毛利率
表:截止2013年6月底金晶科技Low-E玻璃产品产能
表:2012-2016年金晶科技营业收入与净利润
图:2007-2009年中山格兰特营业收入与利润总额
图:2007-2012年华东镀膜营业收入与利润总额
Classification of Energy-saving Glass
Relation Division in Low-E Glass
Difference between Offline and Online Low-E Glass
Main Varieties and Applicability of Low-E Glass
Heat Transfer Coefficient of Glass
Energy-saving Effect of Glass
Global Low-E Glass Development
Building Energy Efficiency Policies in Germany
German Standards for Limiting Window Heat Transfer Coefficient
U.S. Building Energy Efficiency Policies, 1975-2013
U.S. Residential Building and Commercial Building Energy Efficiency Improvement Trends, 1975-2015
U.S. Low-E Glass Consumption, 1987-2004
Building Energy Efficiency Policies in Japan, 1979-2013
Global Low-E Glass Sales Volume and Compound Growth Rate, 1990-2013
Building Low-E Glass Market Share, Sales Volume and Compound Growth Rate in Major European Countries, 1991-2007
Low-E Glass Penetration in the World's Major Countries, 2011
Low-E Glass Technology Abroad and Main Production Enterprises
Building Energy Efficiency Policies and Regulations in China, 1986-2013
China Glass Industry Related Trade Policies, 2007-2013
CO₂ and SO₂ Emissions of Glass
Per Capita Annual Consumption Expenditure of Chinese Urban Households on Housing, 2004-2013
Proportion of Low-E Equipment Sources in China
Low-E Glass Manufacturing Cost Structure (Imported Equipment, for example)
Low-E Glass Unit Processing Costs
China’s Low-E Glass Production Lines and Capacity (by Enterprise / Region), 2013-2014
China’s Low-E Glass Designed Capacity and Actual Capacity, 2005-2013
Chinese Low-E Glass Production Lines that Adopt Domestic Equipment
Low-E Glass Output in China, 2005-2013
Low-E Glass Designed Capacity Structure (by Enterprise) in China, 2011-2012
Revenue of Major Low-E Glass Companies in China, 2008-2013
Low-E Glass Capacity and Output in China, 2010-2015E
Total Energy Consumption Structure in China
Residential Building Energy Consumption Structure in Northern China
Average Price for Low-E Glass and Float Glass in China, 2010-2012
China's 5mm Single Silver Low-E Glass Price Trends, 2012-2013
China’s Demand for Architectural Glass and Low-E Glass, 2006-2013
China’s Demand for Low-E Glass, 2010-2015
PPG’s Factory Distribution (by Region) by Feb. 21, 2013
Revenue and Net Income of PPG, 2008-2013
Revenue Structure of PPG (by Business), 2009-2013
Revenue Structure of PPG (by Region), 2009-2012
Glass Business Structure of PPG
Industrial Glass Revenue and Net Income of PPG, 2007-2013
PPG’s Low-E Glass Business Cooperation in China
Revenue and Net Income of NSG, FY2009-FY2013
Revenue Structure of NSG (by Business), FY2009-FY2013
Revenue Structure of NSG (by Region / Business), FY2013
Architectural Glass Revenue and Operation Income of NSG, FY2009-FY2013
Architectural Glass Revenue Structure of NSG (by Region), FY2012-FY2013
Distribution of NSG’s Major Subsidiaries in China, 2012
Revenue and Total Profit of Tianjin NSG Safety Glass Co., Ltd., 2007-2008
AGC’s Glass Production Lines (by Region)
Revenue and Net Income of AGC, 2008-2013
Revenue Structure of AGC (by Product), 2010-2012
Revenue Structure of AGC (by Region), 2011-2012
Major Products and Services of AGC’s Glass Business
Revenue and YoY Growth Rate of AGC’s Glass Business, 2009-2013
AGC’s Major Subsidiaries in China (by Product) as of end-2012
Revenue and Total Profit of AGC Flat Glass (Dalian) Co., Ltd., 2007-2009
Revenue and Net Income of Saint-Gobain, 2009-2012
Revenue Structure of Saint-Gobain (by Business), 2009-2013
Revenue Structure of Saint-Gobain (by Region), 2009-2013
Plate Glass Products of Saint-Gobain, 2012
Plate Glass Revenue and Operating Income of Saint-Gobain, 2009-2013
Plate Glass Revenue Structure of Saint-Gobain (by Region), 2012
Glass Revenue Structure of Saint-Gobain (by Purpose), 2012
Sales of Saint-Gobain in China, 2002-2012
Revenue and Major Products of Saint-Gobain’s Major Glass Companies in China, 2012
Industry Chain Structure of CSG
Revenue and Net Income of CSG, 2007-2013
Revenue Structure of CSG (by Product), 2008-2012
Revenue Structure of CSG (by Region), 2008-2012
Gross Margin of CSG (by Product), 2008-2012
Architectural Glass Related Construction Projects of CSG by end-2012
Revenue and Product Capacity of CSG’s Major Architectural Glass Subsidiaries, 2011-2012
Architectural Glass Capacity of CSG (by Product / Region), 2004-2014E
Revenue and Net Income of CSG, 2011-2016E
Revenue and Net Income of Taiwan Glass Group, 2008-2013
Low-E Glass Production Lines and Capacity of Taiwan Glass Group (by Factory)
Basic Information of TG Changjiang Glass
Production Lines of TG Changjiang Glass
Glass Production Line Project of TG Anhui Glass
Revenue and Net Income of Xinyi Group, 2007-2013
Revenue Structure of Xinyi Glass (by Product), 2007-2013
Revenue Structure of Xinyi Glass (by Region), 2007-2013
Gross Margin of Xinyi Glass (by Product), 2008-2013
Major Low-E Glass Production Lines and Capacity of Xinyi Glass
Revenue and Net Income of Xinyi Glass, 2011-2016E
Revenue and Net Income of Shanghai Yaohua Pilkington Glass Group, 2007-2013
Revenue Structure of Shanghai Yaohua Pilkington Glass Group (by Product), 2008-2012
Revenue of Shanghai Yaohua Pilkington Glass Group (by Region), 2006-2012
Gross Margin of Shanghai Yaohua Pilkington Glass Group (by Product), 2006-2012
Proposed Construction Projects of Shanghai Yaohua Pilkington Glass Group
Low-E Glass Production Lines and Capacity of Shanghai Yaohua Pilkington Glass Group (by Region), 2009-2014E
Revenue and Net Income of China Glass, 2007-2012
Revenue Structure of China Glass (by Product), 2010-2012
Revenue Breakdown of China Glass (by Region), 2008-2010
Gross Profit and Gross Margin of China Glass (by Product), 2010-2012
Low-E Glass Production Lines and Capacity of China Glass
Revenue and Net Income of China Glass, 2011-2016E
Revenue and Net Income of Blue Star Glass, 2007-2012
Main Low-E Glass Project Cases of Shandong Blue Star Glass Group
Major Products and Subsidiaries of Yaohua Glass
Revenue and Total Profit of Yaohua Glass, 2004-2009
Revenue and Net Income of AVIC SANXIN’s Subsidiaries, 2012
Revenue and Net Income of AVIC SANXIN, 2007-2013
Revenue Structure of AVIC SANXIN (by Product), 2008-2012
Revenue Structure of AVIC SANXIN (by Region), 2008-2012
Gross Margin of AVIC SANXIN (by Product), 2008-2012
Projects under Construction or being Planned of AVIC SANXIN by the end of 2012
Low-E Glass Product Category and Specifications of AVIC SANXIN
Low-E Glass Production Lines of AVIC SANXIN, 2013
Revenue and Net Income of AVIC SANXIN, 2011-2016E
Revenue and Total Profit of Intex Glass (Xiamen), 2004-2009
Production Lines and Capacity of Zhuzhou Kibing Group (by Company), 2013
Revenue and Net Income of Zhuzhou Kibing Group, 2008-2013
Revenue Structure of Zhuzhou Kibing Group (by Product), 2008-2012
Revenue Structure of Zhuzhou Kibing Group (by Region), 2008-2012
Gross Margin of Zhuzhou Kibing Group (by Product), 2008-2012
Major Construction Projects of Zhuzhou Kibing Group, 2013-2015E
Low-E Glass Product Capacity of Zhuzhou Kibing Group
Revenue and Net Income of Shandong Jinjing Science & Technology, 2006-2013
Revenue Structure of Shandong Jinjing Science & Technology (by Product), 2008-2012
Revenue Structure of Shandong Jinjing Science & Technology (by Region), 2008-2012
Gross Margin of Shandong Jinjing Science & Technology (by Product), 2008-2012
Low-E Glass Product Capacity of Shandong Jinjing Science & Technology by the end of June 2013
Revenue and Net Income of Shandong Jinjing Science & Technology, 2012-2016E
Revenue and Total Profit of Zhongshan Grandglass Industrial, 2007-2009
Revenue and Total Profit of Suzhou Huadong Coating Glass, 2007-2012
如果这份报告不能满足您的要求,我们还可以为您定制报告,请 留言说明您的详细需求。
|