|
|
|
报告导航:研究报告—
制造业—化工
|
|
2012-2015年全球及中国1,4丁二醇(BDO)行业研究报告 |
 |
字数:3.4万 |
页数:94 |
图表数:111 |
|
中文电子版:8500元 |
中文纸版:4250元 |
中文(电子+纸)版:9000元 |
|
英文电子版:2200美元 |
英文纸版:2300美元 |
英文(电子+纸)版:2500美元 |
|
编号:HK036
|
发布日期:2013-08 |
附件:下载 |
 |
|
|
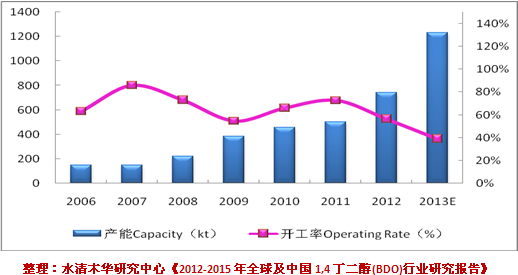
1,4-丁二醇(BDO)是一种重要的有机和精细化工原料,广泛应用于医药、化工、纺织和日用化工等领域。 由于技术壁垒较高和原料来源有限,全球BDO生产相对集中。2012年,全球BDO产能主要分布在亚洲、美国和欧洲,其中亚洲BDO产能占比达60%以上。全球BDO生产企业主要有德国BASF、台湾大连化学、美国利安德巴塞尔、美国ISP、山西三维等,2012年这五家公司BDO产能之和占全球总产能的比例达50%以上。 近年来,随着中国BDO下游产品聚四氢呋喃(PTMEG)、聚对苯二甲酸丁二醇酯(PBT)、γ-丁内酯等需求的不断增加,不少企业实施BDO新增或扩产计划,中国BDO生产规模迅速膨胀。2012年,中国BDO产能已经达到74.4万吨,而需求量仅约为49万吨,装置开工率不足60%。 图:2006-2013年中国BDO产能及开工率
 未来几年,中国新增BDO产能仍然较多,按照目前已公布的拟/在建计划,2013-2015年中国新增BDO产能将达到170万吨左右。若这些产能如期投产,中国BDO产能将严重过剩,市场竞争进一步加剧,部分生产装置将减负荷生产甚至停产。 中国BDO行业集中度较高,截至2013年7月底,中国大陆前三名BDO生产企业产能之和占总产能的比例达42.8%。美克化工是目前中国最大的BDO生产企业,产能达16万吨/年,其中10万吨产能于2013年3月投产;山西三维是排名第二的BDO生产企业,拥有7.5万吨/年Reppe法和7.5万吨/年顺酐法BDO生产装置,是中国唯一拥有Reppe法自主知识产权的BDO生产厂家;排名第三位的是南京蓝星,拥有2套5.5万吨/年顺酐法BDO生产装置。 水清木华研究中心《2012-2015年全球及中国1,4丁二醇(BDO)行业研究报告》主要包括以下几个内容:- 全球BDO行业产能地区分布、供需分析及竞争格局等;
- 中国BDO行业政策环境、供需分析、竞争格局、进出口分析、价格走势、拟/在建项目情况及发展预测等;
- 全球及中国PTMEG行业供需分析、竞争格局、进出口分析、价格走势及拟/在建项目情况等;
- 全球及中国PBT/GBL行业供需分析、进出口分析及价格走势等;
- 全球及中国13家BDO生产企业的经营情况、BDO业务分析以及13家中国企业BDO项目进展情况等。
As an important organic and fine chemical, 1,4 - butanediol (BDO) is
widely used in pharmaceutical, chemical, textile and household chemical
fields. Thanks to high technical barriers and limited sources of
raw materials, the global BDO production is relatively concentrated. In
2012, the global BDO capacity was mainly distributed in Asia which
contributed 60% or more to the global capacity, the United States and
Europe. The combined BDO capacity of the world's five largest
manufacturers, namely Germany BASF, Taiwan Dairen Chemical Corporation,
LyondellBasell, ISP and Shanxi Sanwei, made up over 50% of the global
total capacity in 2012. In recent years, many companies have
implemented new or expansion plans in response to the growing demand for
BDO downstream products such as poly-tetrahydrofuran (PTMEG),
polybutyleneterephthalate (PBT) and γ-butyrolactone, so that China's BDO
production scale has bulged. In 2012, China's BDO capacity reached
744,000 tons, while the demand just hit about 490,000 tons, and the
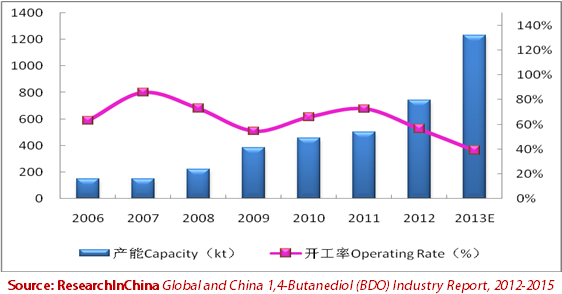
operating rate of plants was less than 60%. China's BDO Capacity and Operating Rate, 2006-2013
In
the next few years, China's new BDO capacity will be still
considerable. According to the published proposed / ongoing construction
plans, China’s new BDO capacity will reach 1.70 million tons or so in
2013 - 2015. If this is realized as scheduled, China’s BDO production
will see exceesive overcapacity and the market competition will prick up
further, which will lead to the suspension and shutdown of some
production devices. China BDO industry characterizes high
concentration. As of the end of July 2013, top three BDO producers had
contributed 42.8% to the total capacity in Mainland China together.
Markor Chem is China's largest BDO enterprise with the capacity of
160,000 tons /a including 100,000 tons /a realized in March, 2013. The
ranking No.2 Shanxi Sanwei is China's only BDO manufacturer that has
independent intellectual property rights of Reppe process with 75,000
tons / a Reppe-process and 75,000 tons / a maleic anhydride-process BDO
facilities. Nanjing Bluestar takes the third position with two sets of
55,000 tons / a maleic anhydride-process BDO production equipment. Global and China 1,4-Butanediol (BDO) Industry Report, 2012-2015 mainly covers the followings:  Regional distribution of capacity, supply and demand, competition patterns of the global BDO industry;
Policies, supply and demand, competition patterns, import and export,
price trend, proposed / ongoing construction projects, development
outlook of China BDO industry;
Supply and demand, competition patterns, import and export, price
trend, proposed / ongoing construction projects of the global and China
PTMEG industry; Supply and demand, import and export, price trend of the global and China PBT / GBL industry; Operation and BDO business of 13 BDO producers in the world and China as well as the BDO projects of 13 Chinese companies.
第一章 BDO概述
1.1 性质及用途
1.2 工艺简介
第二章 全球BDO行业发展概况
2.1 发展现状
2.2 供给
2.3 需求
2.4 竞争格局
第三章 中国BDO行业发展概况
3.1 政策环境
3.2 供给
3.3 需求
3.4 竞争格局
3.5 进出口分析
3.6 价格分析
3.7 发展趋势及预测
3.7.1 发展趋势
3.7.2 供需预测
第四章 BDO下游行业发展情况
4.1 THF/PTMEG
4.1.1 全球市场
4.1.2 中国市场
4.2 PBT
4.2.1 全球市场
4.2.2 中国市场
4.3 GBL
4.3.1 全球市场
4.3.2 中国市场
4.4 其他
第五章 海外BDO主要生产企业
5.1 巴斯夫
5.1.1 公司简介
5.1.2 经营情况
5.1.3 化学品部门经营情况
5.1.4 化学品部门营收构成
5.1.5 BDO业务
5.1.4 在华业务
5.2 大连化学
5.2.1 公司介绍
5.2.2 BDO业务
5.2.3 公司优势及发展前景
5.3 利安德巴塞尔
5.3.1 公司简介
5.3.2 经营情况
5.3.3 BDO业务
5.3.4 在华业务
5.4 亚什兰
5.4.1 公司简介
5.4.2 经营情况
5.4.3 功能性材料部门经营情况
5.4.4 BDO业务
5.4.5 在华业务
5.5 南亚塑胶
5.5.1 公司介绍
5.5.2 经营状况
5.5.3 BDO业务
5.5.4 发展前景
第六章 中国大陆BDO主要生产企业
6.1 山西三维
6.1.1 公司介绍
6.1.2 经营情况
6.1.3 营收构成
6.1.4 毛利率
6.1.5 客户与供应商
6.1.6 BDO业务
6.1.7 预测与展望
6.2 云维股份
6.2.1 公司简介
6.2.2 经营情况
6.2.3 营收构成
6.2.4 毛利率
6.2.5 BDO业务
6.2.7 预测与展望
6.3 美克化工
6.3.1 公司介绍
6.3.2 经营情况
6.3.3 BDO业务
6.4 中国新材
6.4.1 公司介绍
6.4.2 经营情况
6.4.3 BDO业务
6.5 福建湄洲湾
6.5.1 公司简介
6.5.2 经营情况
6.5.3 BDO业务
6.6 南京蓝星
6.6.1 公司简介
6.6.2 BDO业务
6.7 仪征化纤
6.7.1 公司简介
6.7.2 BDO业务
6.8 鹤煤集团
6.8.1 公司简介
6.8.2 BDO业务
6.9 其他公司
6.9.1 陕西比迪欧
6.9.2 四川天华
6.9.3 建峰化工
6.9.4 国电英力特
6.9.5 河南开祥
6.9.6 内蒙古中远
6.9.7 四川维厂
6.9.8 华宸能源
6.9.9 江山化工
6.9.10 新疆天业
6.9.11 延长石油
6.9.12 恒源煤电
6.9.13 潍焦集团
1 Profile of BDO
1.1 Properties and Purposes
1.2 Process
2 Overview of Global BDO Industry
2.1 Status Quo
2.2 Supply
2.3 Demand
2.4 Competition Pattern
3 Overview of China BDO Industry
3.1 Policy
3.2 Supply
3.3 Demand
3.4 Competition Pattern
3.5 Import and Export
3.6 Price
3.7 Development Trend and Forecast
3.7.1 Development Trend
3.7.2 Forecast for Supply and Demand
4 Development of BDO Downstream Industry
4.1 THF/PTMEG
4.1.1 World
4.1.2 China
4.2 PBT
4.2.1 World
4.2.2 China
4.3 GBL
4.3.1 World
4.3.2 China
4.4 Others
5 Major Overseas BDO Manufacturers
5.1 BASF
5.1.1 Profile
5.1.2 Operation
5.1.3 Operation of Chemical Division
5.1.4 Revenue Structure of Chemical Division
5.1.5 BDO Business
5.1.4 Business in China
5.2 Dairen Chemical
5.2.1 Profile
5.2.2 BDO Business
5.2.3 Advantages and Outlook
5.3 LyondellBasell
5.3.1 Profile
5.3.2 Operation
5.3.3 BDO Business
5.3.4 Business in China
5.4 Ashland
5.4.1 Profile
5.4.2 Operation
5.4.3 Operation of Functional Material Division
5.4.4 BDO Business
5.4.5 Business in China
5.5 Nan Ya Plastics
5.5.1 Profile
5.5.2 Operation
5.5.3 BDO Business
5.5.4 Outlook
6 Major BDO Manufacturers in Mainland China
6.1 Shanxi Sanwei
6.1.1 Profile
6.1.2 Operation
6.1.3 Revenue Structure
6.1.4 Gross Margin
6.1.5 Clients and Suppliers
6.1.6 BDO Business
6.1.7 Forecast and Outlook
6.2 Yunnan Yunwei
6.2.1 Profile
6.2.2 Operation
6.2.3 Revenue Structure
6.2.4 Gross Margin
6.2.5 BDO Business
6.2.7 Forecast and Outlook
6.3 Markor Chem
6.3.1 Profile
6.3.2 Operation
6.3.3 BDO Business
6.4 China New Materials
6.4.1 Profile
6.4.2 Operation
6.4.3 BDO Business
6.5 Fujian Meizhouwan
6.5.1 Profile
6.5.2 Operation
6.5.3 BDO Business
6.6 Nanjing Bluestar
6.6.1 Profile
6.6.2 BDO Business
6.7 Sinopec Yizheng Chemical Fibre
6.7.1 Profile
6.7.2 BDO Business
6.8 HNCC
6.8.1 Profile
6.8.2 BDO Business
6.9 Other Companies
6.9.1 Shaanxi BDO
6.9.2 Sichuan Tianhua
6.9.3 Jianfeng Chemical
6.9.4 Guodian Younglight
6.9.5 Henan Kaixiang
6.9.6 Inner Mongolia Zhongyuan
6.9.7 Sinopec Sichuan Vinylon Works
6.9.8 Zhongjia Huachen Energy
6.9.9 Jiangshan Chemical
6.9.10 Xinjiang Tianye
6.9.11 Yanchang Petroleum
6.9.12 Hengyuan Coal Industry and Electricity Power
6.9.13 Shandong Weijiao
图:BDO产业链示意图
表:BDO生产工艺优缺点比较
表:全球BDO生产技术应用情况
图:2012年全球BDO产能地区分布
图:2007-2013E全球BDO产能及其增长率
表:2012年全球BDO生产商产能及工艺技术
图:2007-2013E全球BDO需求量及增长率
图:2012年全球主要BDO厂商产能占比
表:中国BDO反倾销事件简述
表:中国对沙特和台湾地区BDO公司所征收的保证金税率和反倾销税率
表:截止2013年7月中国BDO生产企业及产能
图:截止2013年7月中国BDO产能占比(按生产工艺)
表:2013年中国BDO拟/在建BDO项目情况
图:2006-2013年中国BDO产能及增长率
图:2006-2013年中国BDO产量及开工率
图:2006-2013年中国BDO表观消费量及增长率
图:2012年中国BDO下游消费结构
表:2012年BDO主要下游用户情况
图:截止2013年7月底中国BDO主要生产厂商产能占比
图:2008-2013年中国其他二元醇进出口量
图:2008-2013年中国其他二元醇进出口平均价格
图:2006-2013年中国BDO进口量
图:2012年中国其他二元醇进口来源地区分布(按进口量)
图:2012年中国其他二元醇出口目的地分布(按出口量)
图:2012年中国进口其他二元醇主要地区及其进口量占比
图:2012年中国出口其他二元醇的主要地区及其出口量占比
图:2009-2013年山西三维BDO出厂价格
图:2012-2016年中国BDO供需预测
图:2012年全球PTMEG产能地区分布
图:2012年全球PTMEG主要生产商产能占比
图:2007-2012年全球PTMEG产能
图:2006-2012年中国PTMEG产能
图:2006-2012中国PTMEG产量及开工率
表:2012年中国大陆PTMEG生产企业及其产能
表:2013-2015年中国拟/在建PTMEG项目情况
图:2008-2012年中国PTMEG表观消费量及自给率
图:2012年中国PTMEG消费结构
图:2008-2013年中国PTMEG进出口数量
图:2008-2013年中国PTMEG进出口平均价格
图:2012年中国PTMEG进口来源分布(按进口量)
图:2012年中国PTMEG出口目的地分布(按出口量)
图:2012年中国主要进口PTMEG省市及其进口量占比
图:2012年中国主要出口PTMEG省市及其出口量占比
图:2008-2011年中国华东市场PTMEG(1800分子量)价格
图:2012-2013年中国PTMEG价格
图:2012年全球PBT消费结构
图:2012年全球PBT(分地区)消费量占比
表:2012年中国PBT生产商及其产能
图:2012年中国PBT消费结构
图:2008-2013年中国PBT进出口量
图:2008-2013年中国PBT进出口平均价格
图:2012年中国PBT进口来源分布(按进口量)
图:2012年中国PBT出口目的地分布(按出口量)
图:2012年中国主要进口PBT省市及其进口量占比
图:2012年中国主要出口PBT省市及其出口量占比
图:2010-2011年南通星辰PBT平均价格
表:2012年中国GBL主要生产企业及产能
图:2010-2012年BASF销售收入和净利润
图:2012年BASF(分部门)销售收入占比
图:2010-2012年BASF化学品部门销售收入和EBITDA
表:2010-2012年BASF化学品部门(分产品)销售收入
表:2010-2012年BASF化学品部门(分产品)销售收入占比
图:2010-2012年BASF中间体产品(分地区)销售收入占比
表:2012年BASF BDO装置地址、产能及工艺
表:2009年大连化学工业公司主要产品及产能
表:2012年大连化学BDO厂址及其产能
图:大连化学BDO产业链示意图
图:2011-2012年利安德巴塞尔营业收入和营业利润
图:2012年利安德巴塞尔(分部门)营业收入占比
图:2011-2012年利安德巴赛尔中间体及衍生物部门营业收入及营业利润
表:2012年利安德巴塞尔中间产品及衍生物部门主要产品及产能
图:2010-2012年亚什兰销售收入和营业利润
图:2010-2012年亚什兰(分部门)销售收入占比
图:2012年亚什兰功能性材料部门(分市场)销售收入占比
图:2012年亚什兰功能性材料部门(分产品)销售收入占比
图:2012年亚什兰功能性材料部门(分地区)销售收入占比
表:2012年美国ISP公司BDO装置地址、产能及工艺
表:南亚塑胶主要产品
图:2009-2011年南亚塑胶营业收入和净利润
图:2011年南亚塑胶主营产品销售收入及其营业收入占比
图:2008-2011年南亚塑胶BDO业务收入及其营收占比
图:2007-2011年南亚塑胶BDO产能、产量及开工率
图:2007-2010年南亚塑胶BDO产销量和产销率
图:2007-2010年南亚塑胶BDO自用量和外销量占总销量的比例
图:2008-2013年山西三维营业收入和净利润
表:2010-2012年山西三维(分产品)营业收入
图:2010-2012年山西三维(分产品)营业收入占比
表:2010-2012年山西三维(分地区)营业收入
图:2010-2012年山西三维(分地区)营业收入占比
图:2010-2012年山西三维主营产品毛利率
图:2010-2012年山西三维前五名客户贡献收入及占比
表:2012年山西三维前五名客户名称、收入贡献及占比
图:2010-2012年山西三维前五名供应商采购额及占比
表:2012年山西三维前五名供应商名称、采购金额及占比
表:山西三维BDO业务发展历程
图:2012年山西三维BDO及下游产品产能
图:2011-2015E山西三维营业收入及净利润预测
表:2012年云维股份主营产品及其产能
图:2008-2013年云维股份营业收入和净利润
表:2010-2012年云维股份(分产品)营业收入
图:2010-2012年云维股份(分产品)营业收入占比
表:2010-2012年云维股份(分地区)营业收入
图:2010-2012年云维股份(分地区)营业收入占比
图:2010-2012年云维股份主营产品毛利率
图:2010-2012年云维化工营业收入和净利润
图:2011-2015E云维股份营业收入及净利润预测
图:2008-2009年美克化工主营业务收入、主营业务成本及利润总额
图:2008-2009年东营胜利主营业务收入、主营业务成本及利润总额
表:东营胜利BDO相关业务发展历程
表:2012年福建湄洲湾主营产品产能
图:2007-2009年福建湄洲湾主营业务收入、主营业务成本及利润总额
BDO Industry Chain
Advantages and Disadvantages of BDO Production Process
Application of Global BDO Production Technology
Geographical Distribution of Global BDO Capacity, 2012
Global BDO Capacity and Growth Rate, 2007-2013E
Capacity and Technology of Global BDO Manufacturers, 2012
Global BDO Demand and Growth Rate, 2007-2013E
Capacity Share of Major BDO Manufacturers in the World, 2012
BDO Anti-dumping Cases in China
Deposit and Anti-dumping Tax Rates Levied by China on Saudi Arabian and Taiwanese BDO Companies
BDO Manufacturers and Their Capacity in China , by Jul 2012
BDO Capacity Breakdown (by Production Process) in China, by Jul 2012
Proposed / Ongoing BDO Projects in China, 2013
BDO Capacity and Growth Rate in China, 2006-2013
BDO Output and Operating Rate in China, 2006-2013
BDO Apparent Consumption and Growth Rate in China, 2006-2013
BDO Downstream Consumption Structure in China, 2012
Major BDO Downstream Users, 2012
Capacity Share of Major BDO Manufacturers in China, by end of Jul 2013
Import and Export Volume of Other Diols in China, 2008-2013
Average Import and Export Price of Other Diols in China, 2008-2013
BDO Import Volume in China, 2006-2013
Distribution of Import Sources of Other Diols (by Import Volume) in China, 2012
Distribution of Export Destinations of Other Diols (by Export Volume) in China, 2012
Main Other Diols Importing Provinces and Import Breakdown in China, 2012
Main Other Diols Exporting Provinces and Export Breakdown in China, 2012
BDO Ex-factory Price of Shanxi Sanwei, 2009-2013
BDO Supply and Demand in China, 2012-2016E
Geographical Distribution of Global PTMEG Capacity, 2012
Capacity Share of Major PTMEG Manufacturers in the World, 2012
Global PTMEG Capacity in China, 2007-2012
PTMEG Capacity in China, 2006-2012
PTMEG Output and Operating Rate in China, 2006-2012
PTMEG Manufacturers and Their Capacity in Mainland China, 2012
Proposed / Ongoing PTMEG Construction Projects in China, 2013-2015E
PTMEG Apparent Consumption and Self-sufficiency Rate in China, 2008-2012
PTMEG Consumption Structure in China, 2012
PTMEG Import and Export Volume in China, 2008-2013
Average PTMEG Import and Export Prices in China, 2008-2013
Distribution of PTMEG Import Sources (by Import Volume) in China, 2012
Distribution of PTMEG Export Destinations (by Export Volume) in China, 2012
Main PTMEG Importing Provinces and Import Breakdown in China, 2012
Main PTMEG Exporting Provinces and Export Breakdown in China, 2012
PTMEG (MW: 1800) Price in East China, 2008-2011
PTMEG Price in China, 2012-2013
Global PBT Consumption Structure, 2012
Global PBT Consumption Breakdown, 2012
PBT Manufacturers and Their Capacity in China, 2012
PBT Consumption Structure in China, 2012
PBT Import and Export Volume in China, 2008-2013
Average PBT Import and Export Prices in China, 2008-2013
Distribution of PBT Import Sources (by Import Volume) in China, 2012
Distribution of PBT Export destinations (by Export Volume) in China, 2012
Main PBT Importing Provinces and Import Breakdown in China, 2012
Main PBT Exporting Provinces and Export Breakdown in China, 2012
Average PBT Price of Nantong Xingchen, 2010-2011
Major GBL Manufacturers and Their Capacity in China, 2012
Revenue and Net Income of BASF, 2010-2012
Revenue Structure of BASF (by Division), 2012
Revenue and EBITDA of BASF’s Chemical Division (by Product), 2010-2012
Revenue of BASF’s Chemical Division (by Product), 2010-2012
Revenue Structure of BASF’s Chemical Division (by Product), 2010-2012
Intermediate Sales Structure of BASF (by Region), 2010-2012
Address, Capacity and Process of BDO Facilities of BASF, 2012
Main Products and Capacity of Dairen Chemical, 2009
Address and Capacity of BDO Plants of Dairen Chemical, 2012
BDO Industrial Chain of Dairen Chemical
Revenue and Operating Profit of LyondellBasell, 2011-2012
Revenue Breakdown of LyondellBasell (by Division), 2012
Revenue and Operating Profit of Intermediate and Derivative Division of LyondellBasell, 2011-2012
Main Products and Capacity of Intermediate and Derivative Division of LyondellBasell, 2012
Revenue and Operating Profit of Ashland, 2010-2012
Revenue Structure of Ashland (by Division), 2010-2012
Revenue Structure of Ashland’s Functional Material Division (by Market), 2012
Revenue Structure of Ashland’s Functional Material Division (by Product), 2012
Revenue Structure of Ashland’s Functional Material Division (by Region), 2012
Address, Capacity and Process of BDO Facilities of ISP, 2012
Main Products of Nan Ya Plastics
Revenue and Net Income of Nan Ya Plastics, 2009-2011
Revenue from Main Products of Nan Ya Plastics and % of Total Revenue, 2011
Revenue from BDO of Nan Ya Plastics and % of Total Revenue, 2008-2011
BDO Capacity, Output and Operating Rate of Nan Ya Plastics, 2007-2011
BDO Output, Sales Volume and Sales/Output Ratio of Nan Ya Plastics, 2007-2010
Proportion of BDO Self-used Quantity and External Sales Volume in Total Sales Volume of Nan Ya Plastics, 2007-2010
Revenue and Net Income of Shanxi Sanwei, 2008-2013
Revenue of Shanxi Sanwei (by Product), 2010-2012
Revenue Structure of Shanxi Sanwei (by Product), 2010-2012
Revenue of Shanxi Sanwei (by Region), 2010-2012
Revenue Structure of Shanxi Sanwei (by Region), 2010-2012
Gross Margin of Main Products of Shanxi Sanwei, 2010-2012
Shanxi Sanwei’s Revenue from Top 5 Cients and % of Total Revenue, 2010-2012
Name List and Revenue Contribution of Top 5 Clients of Shanxi Sanwei, 2012
Shanxi Sanwei’s Procurement from Top 5 Suppliers and % of Total Procurement, 2010-2012
Name List and Procurement of Shanxi Sanwei’s Top 5 Suppliers, 2012
BDO Business Development Course of Shanxi Sanwei
Capacity of BDO and Downstream Products of Shanxi Sanwei, 2012
Revenue and Net Income of Shanxi Sanwei, 2011-2015E
Main Products and Capacity of Yunnan Yunwei, 2012
Revenue and Net Income of Yunnan Yunwei, 2008-2013
Revenue of Yunnan Yunwei (by Product), 2010-2012
Revenue Structure of Yunnan Yunwei (by Product), 2010-2012
Revenue of Yunnan Yunwei (by Region), 2010-2012
Revenue Structure of Yunnan Yunwei (by Region), 2010-2012
Gross Margin of Main Products of Yunnan Yunwei, 2010-2012
Revenue and Net Income of Yunnan Yunwei, 2010-2012
Revenue and Net Income of Yunnan Yunwei, 2011-2015E
Operating Revenue, Operating Cost and Total Profit of Markor Chem, 2008-2009
Operating Revenue, Operating Cost and Total Profit of Dongying Shengli, 2008-2009
BDO-related Business Development Course of Dongying Shengli
Capacity of Main Products of Fujian Meizhouwan, 2012
Operating Revenue, Operating Cost and Total Profit of Fujian Meizhouwan, 2007-2009
如果这份报告不能满足您的要求,我们还可以为您定制报告,请 留言说明您的详细需求。
|