|
|
|
报告导航:研究报告—
制造业—化工
|
|
2013年全球及中国氯碱行业研究报告 |
 |
字数:3.9万 |
页数:137 |
图表数:163 |
|
中文电子版:8500元 |
中文纸版:4250元 |
中文(电子+纸)版:9000元 |
|
英文电子版:2300美元 |
英文纸版:2400美元 |
英文(电子+纸)版:2600美元 |
|
编号:WLQ004
|
发布日期:2013-08 |
附件:下载 |
 |
|
|
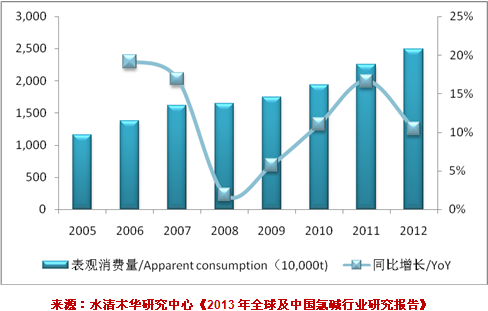
用电解原盐溶液来制取氢氧化钠(烧碱)、氯气和氢气,并以它们为原料生产一系列化工产品的工业称为氯碱工业。氯碱工业所涉及的产品包含:烧碱(NaOH)、聚氯乙烯(PVC)、盐酸、液氯、氢气、甲烷氯化物、环氧氯丙烷等产品200余种。在众多氯碱产品中,烧碱与聚氯乙烯PVC是最为重要的两种产品。 2012年,中国烧碱产能为3736万吨(同比增长9.5%),产量为2698.59万吨(同比增长9.42%),产能利用率72.2%。中国烧碱企业主要集中在华北、华东和西北地区。2012年烧碱产量排名前五的省市分别是山东、江苏、河南、内蒙古和浙江,烧碱产量占比分别为21.69%、15.36%、6.24%、6.06%和5.20%。 自2010年8月中旬开始,中国不断加大的限电、限产政策和节能减排政策,原料盐价格的持续高位以及较为稳定的下游需求直接推升了烧碱价格的上涨。2012年7-8月烧碱高端价达到960元/吨,相比2011年1-3月700元/吨的价格增加了260元/吨。 图:2005-2012年中国烧碱表观消费量及同比增长
2012年,中国PVC产能2341万吨(同比增长8.23%,全球产能占比为44.4%),产量1317.77万吨(同比增长1.74%)。2006-2009年,中国PVC产能利用率从71.1%下降到51.4%,2010-2011年产能利用率有所回升,2012年产能利用率为56.3%,同比下降3.6个百分点。2012年,中国PVC产能利用率基本上都低于70%,产能过剩趋势明显。 就整体氯碱产业来看,生产中心具有明显向中西部转移趋势,中、东部不具有资源优势地区的企业产能将逐渐萎缩。未来,在资源富集的西部地区,具备原料、成本、技术、资金、管理优势并具有产业链一体化的大型综合企业,在竞争中将于处于有利和控制地位。 水清木华研究中心《2013年中国氯碱行业研究报告》不仅分析了中国氯碱行业市场概况,还分析了全球氯碱行业市场概况;不仅介绍了主要氯碱产品(烧碱、PVC)的市场情况、还介绍了其他氯碱产品(液氯、盐酸、甲烷氯化物、环氧丙烷、TDI、MDI等)的市场情况,其主要内容包含: 1. 全球氯碱行业发展概况(包括全球分国家烧碱、PVC产能、产量、进出口量、表观消费量等);
2. 中国氯碱行业发展概况(包括发展现状、行业特点、行业主管部门、相关政策、发展瓶颈、发展趋势等);
3. 中国烧碱及PVC行业发展概况(包括产能、产量、进出口、表观消费量、价格走势、区域市场、竞争格局);
4. 中国烧碱及PVC上下游产品市场(包括电力、原盐、电石、乙烯等上游产品和氧化铝、纸浆、化纤、塑料制品等下游行业;
5. 中国氯碱行业10家主要企业(包括中泰化学、上海氯碱化工、天原集团等)的经营情况、主运营构成、毛利率、氯碱产品产销量、成本构成、前五大客户、竞争优势等)。
The industry producing chemicals with sodium hydroxide (caustic soda),
chlorine and hydrogen made through the electrolysis of crude salt
solution is known as the chlor-alkali industry, involving more than 200
product varieties including caustic soda (NaOH), polyvinyl chloride
(PVC), hydrochloric acid, liquid chlorine, hydrogen, methane chloride
and epichlorohydrin, among which, caustic soda and PVC are the most
important ones. In 2012, China’s caustic soda production
capacity was 37.36 million tons (up 9.5% year on year), the output was
26.99 million tons (up 9.42% year on year), and the capacity utilization
was 72.2%. Caustic soda enterprises are mainly concentrated in North
China, East China and Northwest China. In 2012, the top five provinces
by output were Shandong, Jiangsu, Henan, Inner Mongolia and Zhejiang,
accounting for 21.69%, 15.36%, 6.24%, 6.06% and 5.20% of total caustic
soda output respectively. Since mid-August 2010, China’s
increasing power limitation, production restriction, energy conservation
and emission reduction policies, high crude salt prices and stable
downstream demand have directly promoted the prices of caustic soda. In
July-August 2012, the price of caustic soda was up to RMB 960 / ton, an
increase of RMB 260 / ton compared with RMB 700 / ton in January-March
2011. Apparent Consumption and YoY Growth Rate of Caustic Soda in China, 2005-2012

In
2012, China’s PVC production capacity was 23.41 million tons (an
increase of 8.23% year on year, accounting for 44.4% of the global
total), and the output was 13.18 million tons (up 1.74% year on year).
China’s PVC capacity utilization declined from 71.1% to 51.4% in
2006-2009, and then picked up in 2010-2011, but declined by 3.6
percentage points year on year to 56.3% in 2012, and remained below 70%
in the year, with an evident trend of overcapacity. An overview
of the chlor-alkali industry shows that the production center is
obviously transferring towards the central and western regions, and the
capacity of enterprises in the central and eastern regions without
resource advantages will gradually shrink. In the future, in the
resource-rich western region, large conglomerates with raw material,
cost, technology, capital and management advantages as well as
integrated industrial chains will hold advantageous and controlling
positions in the competition. Global and China Chlor-alkali
Industry Report, 2013 of ResearchInChina analyzes the global and Chinese
chlor-alkali industry and market, introduces the market conditions of
main chlor-alkali products (caustic soda, PVC), and other chlor-alkali
products (liquid chlorine, hydrochloric acid, methane chloride,
propylene oxide, TDI, MDI). The main contents include: 1.
Development overview of global chlor-alkali industry (including caustic
soda and PVC capacity, output, import and export volume, apparent
consumption by country); 2. Development overview of Chinese
chlor-alkali industry (including development status, industry
characteristics, industry authorities, relevant policies, development
bottleneck, development trends); 3. Development overview of Chinese
caustic soda and PVC industries (including production capacity, output,
import and export, apparent consumption, price trends, regional markets,
competition pattern); 4. Upstream and downstream product markets of
caustic soda and PVC in China (including upstream products such as
electricity, crude salt, calcium carbide, ethylene, and downstream
industries like alumina, paper pulp, chemical fiber, plastic products); 5.
The operation, revenue structure, gross margin, output and sales volume
of chlor-alkali products, cost structure, top five customers, and
competitive advantages of ten major companies in Chinese chlor-alkali
industry.
第一章 氯碱行业相关概念
1.1 定义及相关产品
1.1.1 定义
1.1.2 相关产品
1.2 主要产品
1.2.1 烧碱
1.2.2 聚氯乙烯(PVC)
1.3 产业链
第二章 全球氯碱市场
2.1发展现状
2.2 烧碱
2.2.1 全球产能
2.2.2 全球供需分析
2.2.3 下游消费
2.3 聚氯乙烯(PVC)
2.3.1 全球产能
2.3.2 全球供需分析
2.4 其他氯碱产品
第三章 中国氯碱市场
3.1 发展现状
3.2 行业特点
3.2.1 产能过剩
3.2.2 烧碱市场好于PVC市场
3.3 行业主管部门及相关政策
3.3.1主管部门
3.3.2 相关政策
3.4 发展瓶颈及趋势
3.4.1 发展瓶颈
3.4.2 发展趋势
第四章 中国烧碱市场
4.1 发展现状
4.2 市场供需
4.2.1 产能
4.2.2 产量
4.2.3 表观消费量
4.3 价格走势
4.4 区域市场
4.4.1 产能
4.4.2 产量
4.4.3 价格
4.4.4 江苏市场
4.5 进出口分析
4.5.1 出口分析
4.5.2 进口分析
4.6 竞争格局
第五章 烧碱上下游分析
5.1 上游行业
5.1.1 电力
5.1.2 原盐
5.2 下游行业
5.2.1 概况
5.2.2 氧化铝
5.2.3 纸浆
5.2.4 化纤
第六章 中国聚氯乙烯市场
6.1 发展现状
6.2 市场供需
6.2.1 产能
6.2.2 产量
6.2.3 表观消费量
6.3 价格走势
6.4 区域市场
6.4.1 产能
6.4.2 产量
6.4.3 江苏市场
6.5 进出口分析
6.5.1 出口
6.5.2 进口
6.6 竞争格局
第七章 聚氯乙烯上下游分析
7.1 概况
7.2 上游行业
7.2.1 电石
7.2.2 乙烯
7.3 下游行业
7.3.1 概况
7.3.2 塑料型材及门窗
7.3.3 塑料管材
第八章 中国氯碱工业其他产品市场
8.1 液氯
8.2 盐酸(浓度31%)
8.3 氢气
8.4 其他耗氯产品
8.4.1 甲烷氯化物
8.4.2 环氧丙烷
8.4.3 环氧氯丙烷
8.4.4 异氰酸酯TDI和MDI
8.4.5氯乙酸
第九章 重点企业介绍
9.1 中泰化学
9.1.1 公司简介
9.1.2 经营状况
9.1.3 主营构成
9.1.4 毛利率
9.1.5 氯碱产品产销量及库存量
9.1.6 氯碱产品成本构成
9.1.7 前五大客户
9.1.8 竞争优势
9.1.9 发展前景
9.2 上海氯碱化工
9.2.1 公司简介
9.2.2 经营状况
9.2.3 主营构成
9.2.4 毛利率
9.2.5 氯碱产品产销量及库存量
9.2.6 氯碱产品成本构成
9.2.7 前五大客户
9.2.8 竞争优势
9.3 天原集团
9.3.1 公司简介
9.3.2 经营状况
9.3.3 主营构成
9.3.4 毛利率
9.3.5 氯碱产品产销量及库存量
9.3.6 氯碱产品成本构成
9.3.7 竞争优势
9.4 内蒙君正
9.4.1 公司简介
9.4.2 经营状况
9.4.3 主营构成
9.4.4 毛利率
9.4.5 氯碱产品产销量及库存量
9.4.6 氯碱产品成本构成
9.4.7 前五大客户
9.4.8 竞争优势
9.4.9 发展前景
9.5 新疆天业
9.5.1 公司简介
9.5.2 经营状况
9.5.3 主营构成
9.5.4 毛利率
9.5.5 氯碱产品产销量
9.5.6 前五大客户
9.5.7 竞争优势
9.6 太化股份
9.6.1 公司简介
9.6.2 经营状况
9.6.3 主营构成
9.6.4 毛利率
9.7 英力特
9.7.1 公司简介
9.7.2 经营状况
9.7.3 主营构成
9.7.4 毛利率
9.7.5 氯碱产品产销量及库存量
9.7.6 前五大客户
9.7.7 竞争优势
9.8 金路集团
9.8.1 公司简介
9.8.2 经营状况
9.8.3 主营构成
9.8.4 毛利率
9.8.5 氯碱产品产销量及库存量
9.8.6 前五大客户
9.9 云南盐化
9.9.1 公司简介
9.9.2 经营状况
9.9.3 主营构成
9.9.4 毛利率
9.9.5 竞争优势
9.10 *ST宝硕
9.10.1 公司简介
9.10.2 经营状况
9.10.3 主营构成
9.10.4 毛利率
1. Related Concepts in Chlor-alkali Industry
1.1 Definition and Related Products
1.1.1 Definition
1.1.2 Related Products
1.2 Major Products
1.2.1 Caustic Soda
1.2.2 Polyvinyl Chloride (PVC)
1.3 Industry Chain
2. Global Chlor-alkali Market
2.1 Status Quo
2.2 Caustic Soda
2.2.1 Global Capacity
2.2.2 Global Demand and Supply
2.2.3 Downstream Consumption
2.3 Polyvinyl Chloride (PVC)
2.3.1 Global Capacity
2.3.2 Global Supply and Demand
2.4 Other Chlor-alkali Products
3. Chinese Chlor-alkali Market
3.1 Status Quo
3.2 Industry Characteristics
3.2.1 Overcapacity
3.2.2 Caustic Soda Market Outperformed PVC Market
3.3 Industry Authority and Relevant Policies
3.3.1 Industry Authority
3.3.2 Relevant Policies
3.4 Development Bottleneck and Trend
3.4.1 Development Bottleneck
3.4.2 Development Trend
4. China Caustic Soda Market
4.1 Status Quo
4.2 Supply and Demand
4.2.1 Capacity
4.2.2 Output
4.2.3 Apparent Consumption
4.3 Price Trend
4.4 Regional Market
4.4.1 Capacity
4.4.2 Output
4.4.3 Prices
4.4.4 Jiangsu Market
4.5 Import and Export
4.5.1 Export
4.5.2 Import
4.6 Competition Pattern
5. Upstream and Downstream of Caustic Soda
5.1 Upstream Sectors
5.1.1 Electric Power
5.1.2 Crude Salt
5.2 Downstream Sectors
5.2.1 Overview
5.2.2 Alumina
5.2.3 Paper Pulp
5.2.4 Chemical Fiber
6. Chinese PVC Market
6.1 Status Quo
6.2 Supply and Demand
6.2.1 Capacity
6.2.2 Output
6.2.3 Apparent Consumption
6.3 Price Trend
6.4 Regional Market
6.4.1 Capacity
6.4.2 Output
6.4.3 Jiangsu Market
6.5 Import and Export
6.5.1 Export
6.5.2 Import
6.6 Competition Pattern
7. Upstream and Downstream of PVC
7.1 Overview
7.2 Upstream
7.2.1 Calcium Carbide
7.2.2 Ethylene
7.3 Downstream
7.3.1 Overview
7.3.2 Plastic Profiles, Doors and Windows
7.3.3 Plastic Pipes
8. Other Chlor-alkali Products
8.1 Liquid Chlorine
8.2 Hydrochloric Acid (31% HCI)
8.3 Hydrogen
8.4 Other Chloride Products
8.4.1 Chloromethane
8.4.2 Propylene Oxide (PO)
8.4.3 Epichlorohydrin (ECH)
8.4.4 Isocyanate Series (TDI/ MDI)
8.4.5 Chloroacetic Acid
9. Key Companies
9.1 Xinjiang Zhongtai Chemical Co., Ltd.
9.1.1 Profile
9.1.2 Operation
9.1.3 Revenue Structure
9.1.4 Gross Margin
9.1.5 Output, Sales Volume and Inventory of Chlor-alkali Products
9.1.6 Cost Structure of Chlor-alkali Products
9.1.7 Top 5 Clients
9.1.8 Competitive Edge
9.1.9 Development Prospect
9.2 Shanghai Chlor-Alkali Chemical Co., Ltd.
9.2.1 Profile
9.2.2 Operation
9.2.3 Revenue Structure
9.2.4 Gross Margin
9.2.5 Output, Sales Volume and Inventory of Chlor-Alkali Products
9.2.6 Cost Structure of Chlor-Alkali Products
9.2.7 Top 5 Customers
9.2.8 Competitive Edge
9.3 Yibin Tianyuan Group Co., Ltd.
9.3.1 Profile
9.3.2 Operation
9.3.3 Revenue Structure
9.3.4 Gross Margin
9.3.5 Output, Sales Volume and Inventory of Chlor-Alkali Products
9.3.6 Cost Structure of Chlor-Alkali Products
9.3.7 Competitive Edge
9.4 Inner Mongolia Junzheng Energy & Chemical Industry Co., Ltd.
9.4.1 Profile
9.4.2 Operation
9.4.3 Revenue Structure
9.4.4 Gross Margin
9.4.5 Output, Sales Volume and Inventory of Chlor-Alkali Products
9.4.6 Cost Structure of Chlor-Alkali Products
9.4.7 Top Five Clients
9.4.8 Competitive Edge
9.4.9 Outlook
9.5 Xinjiang Tianye Co., Ltd.
9.5.1 Profile
9.5.2 Operation
9.5.3 Revenue Structure
9.5.4 Gross Margin
9.5.5 Output and Sales Volume of Chlor-Alkali Products
9.5.6 Top Five Clients
9.5.7 Competitive Edge
9.6 Taiyuan Chemical Industry Co., Ltd.
9.6.1 Profile
9.6.2 Operation
9.6.3 Revenue Structure
9.6.4 Gross Margin
9.7 Ningxia Younglight Chemicals Co., Ltd
9.7.1 Profile
9.7.2 Operation
9.7.3 Revenue Structure
9.7.4 Gross Margin
9.7.5 Output, Sales Volume and Inventory of Chlor-alkali Products
9.7.6 Top 5 Clients
9.7.7 Competitive Edge
9.8 Sichuan Jinlu Group Co., Ltd.
9.8.1 Profile
9.8.2 Operation
9.8.3 Revenue Structure
9.8.4 Gross Margin
9.8.5 Output & Sales Volume and Inventory of Chlor-Alkali Products
9.8.6 Top 5 Clients
9.9 Yunnan Salt & Salt Chemical Industry Co., Ltd
9.9.1 Profile
9.9.2 Operation
9.9.3 Revenue Structure
9.9.4 Gross Margin
9.9.5 Competition Edge
9.10 Hebei Baoshuo Co., Ltd.
9.10.1 Profile
9.10.2 Operation
9.10.3 Revenue Structure
9.10.4 Gross Margin
表:隔膜法和离子膜法烧碱工艺技术优劣对比
图:氯碱行业产业链结构
图:2011年全球烧碱分区域产能占比
表:2011年全球主要烧碱厂商产能
表:2008年全球分国家和地区烧碱产能、产量及进出口
表:2011年全球分国家和地区烧碱产量、净出口量和消费量
表:2011年全球烧碱下游消费占比
图:2011年全球分区域PVC产能占比
图:2012年全球分区域PVC产能占比
图:2012年全球分区域PVC需求量占比
表:2005-2025E年北美PVC产能、产量及表观消费量
表:2011年全球氯消费构成
表:2005-2013年中国氯碱行业相关政策
图:2005-2012年中国烧碱产能及同比增长
图:2005-2012年中国烧碱产能利用率
图:2005-2012年中国烧碱产量及同比增长
图:2012年中国离子膜法烧碱产量及同比增长
图:2005-2012年中国离子膜法及隔膜法烧碱产量占比
图:2005-2012年中国烧碱表观消费量及同比增长
图:2005-2013年中国烧碱自给率
图:2010-2013年中国32%离子膜烧碱低、中、高端价格
表:2012年中国分省市和工艺烧碱新增产能及退出产能
表:2008-2012年中国分省市烧碱产量
图:2010-2013年中国分区域32%离子膜法烧碱中端价格
图:2005-2012年江苏省氯碱产量、同比增长及占全国产量比例
图:2010-2012年江苏烧碱进出口量及表观消费量
图:2011-2013年华东烧碱价格趋势
图:2005-2012年中国液体和固体烧碱出口量
图:2005-2013年中国液体和固体烧碱出口单价
表:2012年中国液体烧碱出口前十目的地国家出口量及出口额
表:2012年中国液体烧碱出口来源省市出口量及出口额
表:2012年中国固体烧碱出口前十目的地国家出口量及出口额
表:2012年中国固体烧碱出口前十来源省市出口量及出口额
图:2005-2012年中国液体和固体烧碱进口量
图:2005-2013年中国液体和固体烧碱进口单价
表:2012年中国液体烧碱进口前五来源国家和地区进口量及进口额
表:2012年中国液体烧碱进口前五目的省市进口量及进口额
表:2012年中国固体烧碱进口前五来源国家和地区进口量及进口额
表:2012年中国固体烧碱进口前五目的省市进口量及进口额
表:2011-2012年中国烧碱产能排名前十的企业产能
图:2005-2012年中国发电量及同比增长
图:2005-2012年中国原盐产量及表观消费量
图:2010-2013年中国原盐市场价格走势
图:2005-2011年中国氧化铝耗碱量
图:2005-2012年中国氧化铝产量及同比增长
表:2008-2012年中国氧化铝分省市产量
图:2005-2012年中国氧化铝表观消费量及进口量
图:2005-2012年中国纸浆产量及同比增长
图:2005-2012年中国化纤产品产量
图:2005-2012年中国PVC产能及同比增长
图:2012年中国PVC分工艺产能占比
图:2005-2012年中国PVC产能利用率
图:2005-2012年中国PVC产量及同比增长
图:2005-2012年中国PVC表观消费量及同比增长
图:2008-2013年中国PVC自给率及对外依存度
图:2008-2013年中国PVC低端价
图:2008-2013年中国PVC中端价
图:2008-2013年中国PVC高端价
图:2008和2012年中国PVC分区域产能占比
表:2012年中国分省市和工艺PVC产能(单位:万吨)
表:2012年中国分省市PVC产能增减
表:2012年中国分省市PVC企业数及产量
图:2008-2012年江苏PVC产量、同比增长及占全国产量的比例
图:2010-2012年江苏PVC进出口量及表观消费量
图:2011-2013年华东地区PVC价格趋势
表:2008-2012年中国PVC出口量、出口额及单价
表:2012年中国PVC出口前十目的地国家出口量和出口额
表:2012年中国PVC出口前十来源省市出口量和出口额
表:2008-2012年中国PVC进口量、进口额及单价
表:2012年中国PVC进口前十来源国家和地区进口量和进口额
表:2012年中国PVC进口前十目的省市进口量和进口额
表:2011-2012年中国PVC产能排名前十的省市
表:2012年中国PVC产能前十的企业产能
图:聚氯乙烯产业链
图:中国电石法生产PVC成本构成
表:2012年中国大型氯碱企业配套电石产能
图:2005-2012年中国电石产量与表观消费量
图:2008-2013年中国电石价格
图:中国乙烯法生产PVC成本构成
图:2005-2012年中国乙烯产量与表观消费量
表:2012年中国分省市乙烯企业数及产量
图:2008-2013年中国乙烯进口依赖度
图:2012年中国PVC下游消费构成
表:2005-2012年中国各种塑料制品产量
图:2011年中国液氯下游消费构成
图:2010-2013年中国液氯市场价格走势
图:2005-2012年中国盐酸(浓度31%)产量
图:2010-2013年中国盐酸市场价格走势
表:2007-2011年中国甲烷氯化物产能、产量、进出口量、表观消费量
图:2010-2013年中国甲烷氯化物市场价格走势
表:2005-2011年中国环氧丙烷产量、进口量、出口量、表观消费量
表:2005-2011年中国环氧氯丙烷产量、进口量、出口量及表观消费量
表:2005-2011年中国TDI产能、产量、表观消费量及进出口量
表:2005-2012年中国MDI产能、产量、表观消费量
表:2012-2016E年中国MDI企业产能
图:2008-2012年中泰化学营业收入及同比增长
图:2008-2012年中泰化学净利润及同比增长
图:2008-2012年中天化学分产品营业收入
表:2008-2012年中泰化学分区域营业收入
图:2008-2012年中泰化学分产品毛利率
表:2011-2012年中泰化学氯碱产品产销量及库存量
表:2008-2012年中泰化学氯碱产品成本构成
表:2012年中泰化学来自前五大客户的销售额及占比
表:2013-2016E中泰化学营业收入及净利润预测
图:2008-2012年上海氯碱化工营业收入及同比增长
图:2008-2012年上海氯碱化工净利润及同比增长
表:2008-2012年上海氯碱化工分产品营业收入
表:2008-2012年上海氯碱化工分产品毛利率
表:2011-2012年上海氯碱化工氯碱产品产销量及库存量
表:2011-2012年上海氯碱化工氯碱产品成本构成
表:2012年上海氯碱化工来自前五大客户的销售额及产比
图:2008-2012年天原集团营业收入及同比增长
图:2008-2012年天原集团净利润及同比增长
表:2008-2012年天原集团分产品营业收入
表:2008-2012年天原集团分区域营业收入
表:2008-2012年天原集团分产品毛利率
表:2008-2012年天原集团分区域毛利率
表:2011-2012年天原集团氯碱产品产销量及库存量
表:2011-2012年天原集团氯碱产品成本构成
图:2008-2012年内蒙君正营业收入及同比增长
图:2008-2012年内蒙君正净利润及同比增长
表:2008-2012年内蒙君正分产品营业收入
表:2008-2012年内蒙君正分产品毛利率
表:2011-2012内蒙君正氯碱产品产销量及库存量
表:2011-2012内蒙君正氯碱产品成本构成
表:2012年内蒙君正来自前五大客户的销售额及占比
表:2013-2016E年内蒙君正营业收入及净利润预测
图:2008-2012年新疆天业营业收入及同比增长
图:2008-2012年新疆天业净利润及同比增长
表:2008-2012年新疆天业分产品营业收入
表:2008-2012年新疆天业分区域营业收入
表:2008-2012年新疆天业分产品毛利率
表:2011-2012年新疆天业氯碱产品产量
表:2012年新疆天业来自前五大客户的营业收入及占比
图:2008-2012年太化股份营业收入及同比增长
图:2008-2012年太化股份净利润及同比增长
表:2008-2012年太化股份分品和业务营业收入
图:2008-2012年宝硕股份毛利率
图:2008-2012年英力特营业收入及同比增长
图:2008-2012年英力特净利润及同比增长
表:2008-2012年英力特分产品营业收入
表:2008-2012年英力特分区域营业收入
表:2008-2012年英力特分产品毛利率
表:2011-2012英力特氯碱产品产销量及库存量
表:2012年英力特来自前五大客户的销售额及占比
图:2008-2012年金路集团营业收入及同比增长
图:2008-2012年金路集团净利润及同比增长
图:2008-2012年金路集团分产品营业收入
图:2008-2012年金路集团分区域营业收入
图:2008-2012年金路集团分产品毛利率
表:2011-2012年金路集团氯碱产品产销量及库存量
表:2012年金路集团来自前五大客户的销售额及占比
图:2008-2012年云南盐化营业收入及同比增长
图:2008-2012年云南盐化净利润及同比增长
表:2008-2012年云南盐化分产品营业收入
图:2008-2012年云南盐化分区域营业收入
图:2009-2012年云南盐化分产品毛利率
图:2009-2012年云南盐化分区域毛利率
图:2008-2012年宝硕股份营业收入及同比增长
图:2008-2012年宝硕股份净利润及同比增长
表:2009-2012年宝硕股份分产品营业收入
表:2008-2012年宝硕股份分区域营业收入
图:2008-2012年宝硕股份毛利率
Advantages and Disadvantages of Diaphragm and Ionic Membrane Caustic Soda Technologies
Chlor-alkali Industry Chain
Capacity Proportion of Caustic Soda by Region, 2011
Capacity of Global Major Caustic Soda Producers, 2011
Global Caustic Soda Capacity, Output, Import and Export by Region, 2008
Global Caustic Soda Output, Net Export Volume and Consumption by Region, 2011
Proportion of Global Caustic Soda’s Downstream Consumption Fields, 2011
Regional Distribution of Global PVC Capacity, 2011
Regional Distribution of Global PVC Capacity, 2012
Regional Distribution of Global PVC Demand, 2012
PVC Capacity, Output and Apparent Consumption of North America, 2005-2025E 21
Global Chlorine Consumption Structure, 2011
Relevant Policies to Chinese Chlor-alkali Industry, 2005-2013
Caustic Soda Capacity and YoY Growth Rate in China, 2005-2012
Caustic Soda Capacity Utilization in China, 2005-2012
Caustic Soda Output and YoY Growth Rate in China, 2005-2012
Ionic Membrance Caustic Soda Output and YoY Growth Rate in China, 2012
Proportion of Ionic Membrance/Diaphragm Caustic Soda Output in China, 2005-2012
Caustic Soda Apparent Consumption and YoY Growth Rate in China, 2005-2012
Self-Sufficiency Rate of Caustic Soda in China, 2005-2013
32% Ionic Membrance Caustic Soda Prices in China, 2010-2013
New Capacity and Capacity Exit of Caustic Soda by Region and Process in China, 2012
Caustic Soda Output in China by Region, 2008-2012
Mid-Range Price of 32% Ionic Membrance Caustic Soda in China by Region, 2012-2013
Chlor-Alkali Output, YoY Growth Rate and Proportion in the National Total of Jiangsu Province, 2005-2012
Import & Export of Caustic Soda and Apparent Consumption in Jiangsu Province, 2010-2012
Caustic Soda Price Trend in East China, 2011-2013
Liquid/Solid Caustic Soda Export Volume in China, 2005-2012
Unit Export Price of Liquid/Solid Caustic Soda in China, 2005-2013
Top 10 Liquid Caustic Soda Export Destinations of China, 2012
Top 8 Liquid Caustic Soda Exporters in China by Region, 2012
Top 10 Solid Caustic Soda Export Destinations of China, 2012
Top 10 Solid Caustic Soda Exporters of China, 2012Import Volume of Liquid/Solid Caustic Soda in China, 2005-2012
Unit Import Price of Liquid/Solid Caustic Soda in China, 2005-2013
Top 5 Liquid Caustic Soda Import Origins in China, 2012
Top 5 Chinese Liquid Caustic Soda Importers, 2012
Top 5 Solid Caustic Soda Import Origins of China, 2012
Top 5 Solid Caustic Soda Chinese Importers by Region, 2012
Top 10 Caustic Liquid Enterprises by Capacity in China, 2011-2012
Generating Capacity and YoY Growth Rate in China, 2005-2012
Crude Salt Output and Apparent Consumption in China, 2005-2012
Crude Salt Price in China, 2010-2013
Alkali Consumption by Alumina in China, 2005-2011
Alumina Output and YoY Growth Rate in China, 2005-2012
Alumina Output by Province and Municipality in China, 2008-2012
Alumina Apparent Consumption and Import Volume in China, 2005-2012
Paper Pulp Output and YoY Growth Rate in China, 2005-2012
Output of Chemical Fiber Products in China, 2005-2012
PVC Capacity and YoY Growth Rate in China, 2005-2012
PVC Capacity in China by Method, 2012
PVC Capacity Utilization in China, 2005-2012
PVC Output and YoY Growth Rate in China, 2005-2012
PVC Apparent Consumption and YoY Growth Rate in China, 2005-2012
PVC Self-sufficiency and Foreign Dependence in China, 2008-2013
Price of Low-grade PVC in China, 2008-2013
Price of Medium-grade PVC in China, 2008-2013
Price of High-grade PVC in China, 2008-2013
PVC Capacity Structure by Region in China, 2008 and 2012
PVC Capacity by Province and City and Process in China, 2012
PVC Capacity Increase and Decrease by Province and City in China, 2012
Number of PVC Enterprises and Output by Province and City in China, 2012
PVC Output, YoY Growth Rate and % in National Total of Jiangsu, 2008-2012
PVC Import & Export Volume and Apparent Consumption of Jiangsu, 2010-2012
PVC Price Trend in East China, 2011-2013
PVC Export Volume, Export Value and Unit Price of China, 2008-2012
PVC Export Volume and Export Value to Top 10 Destination Countries of China, 2012
PVC Export Volume and Export Value from Top 10 Origin Provinces and Cities of China, 2012
PVC Import Volume, Import Value and Unit Price in China, 2008-2012
PVC Import Volume and Import Amount from Top 10 Origin Countries and Regions, 2012
PVC Import Volume and Import Value of Top 10 Import Provinces and Cities in China, 2012
Top 10 Provinces and Cities by PVC Capacity in China, 2011-2012
Capacity of Top 10 Enterprises by PVC Capacity in China, 2012
PVC Industry Chain
China Calcium Carbide Process PVC Production Cost Structure
Calcium Carbide Capacity of Large Chlor-Alkali Enterprises in China, 2012
Output and Apparent Consumption of Calcium Carbide in China, 2005-2012
China Calcium Carbide Price, 2008-2013
China Ethylene Process PVC Production Cost Structure
Output and Apparent Consumption of Ethylene in China, 2005-2012
Number of Ethylene Enterprises and Output by Province/City, 2012
Ethylene Import Dependence of China, 2008-2013
China PVC Downstream Consumption Structure, 2012
Output of Plastic Products in China, 2005-2012
China Liquid Chlorine Downstream Consumption Structure, 2011
China Liquid Chlorine Market Price Trend, 2010-2013
Output of Hydrochloric Acid (31% HCI) in China, 2005-2012
China Hydrochloric Acid Market Price Trend, 2010-2013
Capacity, Output, Import Volume, Export Volume and Apparent Consumption of Chloromethane in China, 2007-2011
China’s Chloromethane Market Prices, 2010-2013
Output, Import Volume, Export Volume and Apparent Consumption of Propylene Oxide in China, 2005-2011
Output, Import Volume, Export Volume and Apparent Consumption of Epichlorohydrin in China, 2005-2011
Capacity, Output, Apparent Consumption, Import Volume and Export Volume of TDI in China, 2005-2011
Capacity, Output and Apparent Consumption of MDI in China, 2005-2012
Capacity of Chinese MDI Companies, 2012-2016E
Revenue and YoY Growth Rate of Zhongtai Chemical, 2008-2012
Net Income and YoY Growth Rate of Zhongtai Chemical, 20080-2012
Revenue of Zhongtai Chemical by Product, 2008-2012
Revenue of Zhongtai Chemical by Region, 2008-2012
Gross Margin of Zhongtai Chemical by Product, 2008-2012
Output, Sales Volume and Inventory of Zhongtai Chemical’s Chlor-alkali Products, 2011-2012
Cost Structure of Zhongtai Chemical’s Chlor-alkali Products, 2008-2012
Zhongtai Chemical’s Revenue from Top 5 Clients and % of Total Revenue, 2012
Revenue and Net Income of Zhongtai Chemical, 2013-2016E
Revenue and YoY Growth Rate of Shanghai Chlor-Alkali Chemical, 2008-2012
Net Income and YoY Growth Rate of Shanghai Chlor-Alkali Chemical, 2008-2012
Revenue of Shanghai Chlor-Alkali Chemical by Product, 2008-2012
Gross Margin of Shanghai Chlor-Alkali Chemical by Product, 2008-2012
Output, Sales Volume and Inventory of Chlor-Alkali Products of Shanghai Chlor-Alkali Chemical, 2011-2012
Cost Structure of Chlor-Alkali Products of Shanghai Chlor-Alkali Chemical, 2011-2012
Shanghai Chlor-Alkali Chemical’s Revenue from Top 5 Customers and % of Total Revenue, 2012
Revenue and YoY Growth Rate of Tianyuan Group, 2008-2012
Net Income and YoY Growth Rate of Tianyuan Group, 2008-2012
Revenue of Tianyuan Group by Product, 2008-2012
Revenue of Tianyuan Group by Region, 2008-2012
Gross Margin of Tianyuan Group by Product, 2008-2012
Gross Margin of Tianyuan Group by Region, 2008-2012
Output, Sales Volume and Inventory of Chlor-Alkali Products of Tianyuan Group, 2011-2012
Cost Structure of Chlor-Alkali Products of Tianyuan Group, 2011-2012
Revenue and YoY Growth Rate of Inner Mongolia Junzheng, 2008-2012
Net Income and YoY Growth Rate of Inner Mongolia Junzheng, 2008-2012
Revenue of Inner Mongolia Junzheng by Product, 2008-2012
Gross Margin of Inner Mongolia Junzheng by Product, 2008-2012
Output, Sales Volume and Inventory of Chlor-Alkali Products of Inner Mongolia Junzheng, 2011-2012
Cost Structure of Chlor-Alkali Products of Inner Mongolia Junzheng, 2011-2012
Inner Mongolia Junzheng’s Revenue from Top 5 Clients and % of Total Revenue, 2012
Revenue and Net Income of Inner Mongolia Junzheng, 2013-2016E
Revenue and YoY Growth Rate of Xinjiang Tianye, 2008-2012
Net Income and YoY Growth Rate of Xinjiang Tianye, 2008-2012
Revenue of Xinjiang Tianye by Product, 2008-2012
Revenue of Xinjiang Tianye by Region, 2008-2012
Gross Margin of Xinjiang Tianye by Product, 2008-2012
Output of Chlor-Alkali Products of Xinjiang Tianye, 2011-2012
Xinjiang Tianye’s Revenue from Top 5 Clients and % of Total Revenue, 2012
Revenue and YoY Growth Rate of Taiyuan Chemical Industry, 2008-2012
Net Income and YoY Growth Rate of Taiyuan Chemical Industry, 2008-2012
Revenue Breakdown of Taiyuan Chemical Industry by Product and Business, 2008-2012
Gross Margin of Taiyuan Chemical Industry, 2008-2012
Revenue and YoY Growth Rate of NYCC, 2008-2012
Net Income and YoY Growth Rate of NYCC, 2008-2012
Revenue Breakdown of NYCC by Product, 2008-2012
Revenue Breakdown of NYCC by Region, 2008-2012
Gross Margin of NYCC by Product, 2008-2012
Chlor-Alkali Product Output, Sales Volume and Inventory of NYCC, 2011-2012
NYCC’s Revenue from Top 5 Clients and % of Total Revenue, 2012
Revenue and YoY Growth Rate of Sichuan Jinlu Group, 2008-2012
Net Income and YoY Growth Rate of Sichuan Jinlu Group, 2008-2012
Revenue of Sichuan Jinlu Group by Product, 2008-2012
Revenue of Sichuan Jinlu Group by Region, 2008-2012
Gross Margin of Sichuan Jinlu Group by Product, 2008-2012
Output & Sales Volume and Inventory of Chlor-Alkali Products of Sichuan Jinlu Group, 2011-2012
Revenue of Yunnan Salt & Salt Chemical Industry by Product, 2008-2012
Revenue and YoY Growth Rate of Yunnan Salt & Salt Chemical Industry, 2008-2012
Net Income and YoY Growth Rate of Yunnan Salt & Salt Chemical Industry, 2008-2012
Revenue of Yunnan Salt & Salt Chemical Industry by Region, 2008-2012
Gross Margin of Yunnan Salt & Salt Chemical Industry by Product, 2009-2012
Gross Margin of Yunnan Salt & Salt Chemical Industry by Region, 2009-2012
Revenue and YoY Growth Rate of Hebei Baoshuo, 2008-2012
Net Income and YoY Growth Rate of Hebei Baoshuo, 2008-2012
Revenue Breakdown of Hebei Baoshuo by Product, 2009-2012
Revenue Breakdown of Hebei Baoshuo by Region, 2008-2012
Gross Margin of Hebei Baoshuo, 2008-2012
如果这份报告不能满足您的要求,我们还可以为您定制报告,请 留言说明您的详细需求。
|