|
|
|
报告导航:研究报告—
农业与食品—农业
|
|
2013年中国番茄制品行业研究报告 |
 |
字数:3.7万 |
页数:60 |
图表数:68 |
|
中文电子版:5000元 |
中文纸版:2500元 |
中文(电子+纸)版:5500元 |
|
英文电子版:1500美元 |
英文纸版:1600美元 |
英文(电子+纸)版:1800美元 |
|
编号:QJC001
|
发布日期:2013-08 |
附件:下载 |
 |
|
|
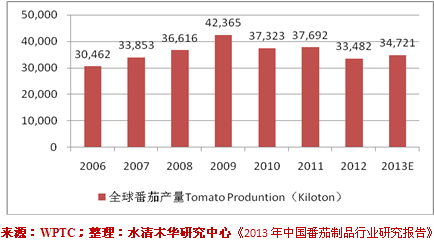
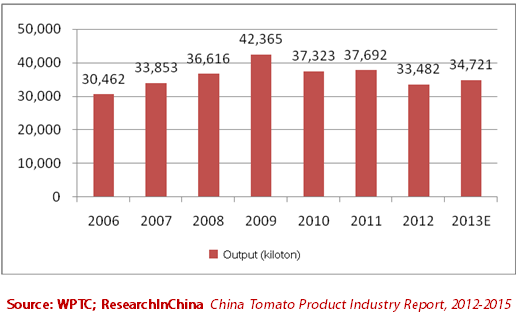
2012年,受主产区干旱影响,全球番茄产量降至3472.1万吨,是2007年以来产量最低的一年。地中海区域是全球加工番茄产量最高的地区,产量占全球总产量的41.4%;美国是全球加工番茄产量最高的国家,占全球番茄产量的35.6%;中国加工番茄产量占全球总产量的9.6%。 图:2006-2013年全球加工番茄产量
中国番茄酱加工厂现有166家左右,市场集中度较高,中粮屯河和新中基是番茄制品龙头企业,合计产量占中国总量的70%以上。 中国番茄制品以出口为主,出口目的地主要为欧盟国家、俄罗斯和日本。2012年主产区干旱导致中国番茄企业开工不足,番茄制品出口量较2011年下滑4.2%,小包装番茄酱、番茄沙司等出口量增长较快,出口结构更加合理。 2012年,中国番茄制品出口均价开始回升。2013年1-5月,出口均价达到900美元/吨以上,超过行业盈亏平衡线,但中国番茄加工业总体利润水平较低的状况难以改变。 《2012-2013年中国番茄制品行业研究报告》的内容主要包括以下几方面: - 全球加工番茄种植及番茄制品的发展现状、市场供需、进出口贸易、价格走势等;
- 中国加工番茄生产及番茄制品的发展现状、市场供需、进出口贸易、价格走势、发展前景等;
- 中国番茄制品行业竞争格局、利润水平以及市场竞争优劣势等;
- 全球2家、中国6家主要番茄制品企业经营现状、投资并购、番茄制品业务分析及发展预测等。
Affected by severe drought in major tomato production regions, the
global tomato output in 2012 dived to 34.721 million tons, hitting the
rock bottom since 2007. The Mediterranean boasts the world’s largest
processing tomato production region, with the output accounting for
41.4% of the world’s total, while the US is known as the world’s largest
processing tomato production country, with the output making up 35.6%
of the world’s total. In China, the output of processing tomato stood up
9.6% of the total in global terms. Processing Tomato Output Worldwide, 2006-2013
China
currently has around 166 tomato sauce processing factories, featuring
higher market concentration. COFCO Tunhe and Chalkis are flagship tomato
products enterprises, with the collective output accounting for over
70% of the total in China. China’s tomato products are mostly
exported to EU countries, Russia and Japan. In 2012, the severe drought
in major production regions caused the low operation of domestic tomato
enterprises, with the export volume of tomato products declining by 4.2%
over 2011. By contrast, the products like ketchup and tomato sauce in
small package saw rapid growth in export volume, and the export
structure appears to be more reasonable. In 2012, the average
export price of tomato products made in China began to pick up. In
Jan.-May, 2013, the average export price exceeded USD900/ton, starting
running at a profit. However, it is the truth indeed that the overall
profit of China tomato processing industry is relatively low. The report highlights: 
Status quo, supply & demand, import & export, and price trend
of worldwide processing tomato planting and tomato products;
Status quo, supply & demand, import & export, price trend and
development outlook of China processing tomato production and tomato
products; Competition pattern, profit level and advantages & disadvantages of market competition; Operation,
investment and M&A, tomato products business and development
outlook of major tomato products enterprises worldwide.
1. 番茄加工业概况
1.1 定义及特点
1.2 市场基本特点
1.3 产业链
2. 全球番茄制品行业现状
2.1 番茄生产概况
2.1.1 番茄生产概况
2.1.2 全球番茄主产区分布
2.2 全球番茄主产区生产情况
2.2.1 地中海区域
2.2.2 美国及加利福尼亚州
2.3 番茄及制品的国际贸易
2.2.1 全球番茄贸易
2.2.2 全球番茄制品贸易
2.4 价格趋势
2.4.1 番茄价格趋势
2.4.2 番茄制品价格趋势
3. 中国番茄制品行业现状
3.1 中国加工番茄生产概况
3.2 中国番茄加工业概况
3.2.1番茄加工产业集中程度较高
3.2.2 番茄加工企业成本控制压力增大
3.3 中国番茄产业进出口概况
3.3.1 出口
3.3.2 进口
3.4 中国番茄加工产业优势与劣势
3.4.1 优势
3.4.2 劣势
3.5 产业前景预期
4 重点企业分析
4.1 星辰公司(Morning Star)
4.1.1 公司简介
4.1.2 番茄制品业务
4.2 亨氏公司(Heinz)
4.2.1 公司简介
4.2.2 公司运营
4.2.3 营收构成分析
4.4.4 毛利率分析
4.2.4 番茄制品业务
4.3 中粮屯河
4.3.1公司简介
4.3.2公司运营
4.3.3 营收构成分析
4.3.4 毛利率分析
4.3.5 番茄制品业务
4.3.6 预测及展望
4.4 新中基
4.4.1 公司简介
4.4.2 公司运营
4.4.3 营收构成分析
4.4.4 毛利率分析
4.4.5 番茄制品业务
4.4.6预期与展望
4.5 昊汉集团
4.5.1 公司简介
4.5.2 公司运营
4.6 新疆天业
4.6.1 公司简介
4.6.2 公司运营
4.6.3 主营业务收入结构分析
4.6.4 毛利率分析
4.6.5 番茄制品业务
4.7 内蒙古富源农产品有限公司
4.7.1 公司简介
4.7.2 公司运营
4.7.3 番茄制品业务
4.8 泰顺兴业(内蒙古)食品有限公司
4.8.1 公司简介
4.8.2 公司运营
4.8.3 番茄制品业务
1. Tomato Processing Industry
1.1 Definition & Features
1.2 Basic Characteristics of Market
1.3 Industrial Chain
2. Status Quo of Global Tomato Products Industry
2.1 Production of Tomato
2.1.1 Production of Tomato
2.1.2 Major Tomato Production Regions Worldwide
2.2 Production of Major Tomato Production Regions Worldwide
2.2.1 Mediterranean
2.2.2 US & California
2.3 International Trade of Tomatoes & Tomato Products
2.3.1 Worldwide Tomato Trade
2.3.2 Tomato Products Trade Worldwide
2.4 Price Trend
2.4.1 Tomato Price Trend
2.4.2 Tomato Products Price Trend
3. China Tomato Products Industry
3.1 Production of Processing Tomatoes in China
3.2 China Tomato Processing Industry
3.2.1 Higher Concentration of Tomato Processing Industry
3.2.2 Increased Cost Control Pressure of Tomato Processing Enterprises
3.3 Import & Export of China Tomato Industry
3.3.1 Export
3.3.2 Import
3.4 Advantages & Disadvantages of China Tomato Processing Industry
3.4.1 Advantages
3.4.2 Disadvantages
3.5 Industrial Outlook
4. Key Enterprises
4.1 Morning Star
4.1.1 Profile
4.1.2 Tomato Products Business
4.2 Heinz
4.2.1 Profile
4.2.2 Operation
4.2.3 Revenue Structure
4.2.4 Gross Margin
4.2.5 Tomato Products Business
4.3 COFCO Tunhe
4.3.1 Profile
4.3.2 Operation
4.3.3 Revenue Structure
4.3.4 Gross Margin
4.3.5 Tomato Products Business
4.3.6 Estimation & Outlook
4.4 Chalkis
4.4.1 Profile
4.4.2 Operation
4.4.3 Revenue Structure
4.4.4 Gross Margin
4.4.5 Tomato Products Business
4.4.6 Estimation & Outlook
4.5 Haohan Group
4.5.1 Profile
4.5.2 Operation
4.6 Xinjiang Tianye
4.6.1 Profile
4.6.2 Operation
4.6.3 Operating Revenue Structure
4.6.4 Gross Margin
4.6.5 Tomato Products Business
4.7 Inner Mongolia Fuyuan Agriculture Products
4.7.1 Profile
4.7.2 Operation
4.7.3 Tomato Products Business
4.8 Taishun Industrial (Inner Mongolia) Food Co., Ltd.
4.8.1 Profile
4.8.2 Operation
4.8.3 Tomato Products Business
图:番茄制品产业链
图:2006-2013年全球加工番茄产量
图:2012年全球加工番茄主产区产量分布
表:2006-2012年地中海区域加工番茄产量
图:2012年地中海区域番茄产量分布
图:2012年美国加工番茄产量分布
图:2000-2010年全球番茄进出口量统计
表:2010年各大洲番茄进出口量及占比
表:2010年全球十大番茄净进口国与净出口国
表:2010年各大洲去皮番茄进出口量及占比
表:2010年各大洲浓缩番茄汁进出口量及占比
图:2000-2010年全球番茄进出口平均价格
图:2000-2011年美国鲜食番茄平均价格
图:2000-2010年全球去皮番茄进出口平均价格
图:2000-2010年全球浓缩番茄汁进出口平均价格
表:2007-2013财年美国番茄制品平均价格
图:2006-2013年中国加工番茄产量
图:1997-2013年大宗番茄价格走势
图:2010-2013年人民币/美元汇率中间价走势
表:2011-2012年中国番茄及番茄制品出口量
图:2007-2013年5月中国番茄制品出口均价
表:2012年中国大桶番茄酱出口前20国出口量、出口额及出口均价
表:2011-2012年中国番茄及番茄制品进口量
图:2007-2012年中国番茄沙司和番茄罐头(含番茄酱)进口量、进口金额
图:2007-2012年中国番茄沙司和番茄罐头(含番茄酱)进口均价
表:2011-2012年中国番茄沙司进口来源地进口量及占比
表:2011-2012年中国番茄罐头(含番茄酱)进口来源地进口量及占比
表:2011年人均番茄制品消费量
表:星辰公司(Morning Star)主要番茄制品
图:2008-2012财年亨氏公司营业收入和净利润
图:2008-2012财年亨氏公司(分产品)营业收入
图:2008-2012财年亨氏公司(分产品)营业收入占比
表:亨氏公司销售区域简介
图:2008-2012财年亨氏公司(分区域)营业收入
图:2008-2012财年亨氏公司(分区域)营业收入占比
表:2008-2012财年亨氏公司各地区毛利率
表:亨氏公司各地区加工厂数量
图:2008-2013Q1中粮屯河营业收入及净利润
图:2008-2012中粮屯河(分产品)营业收入
图:2008-2012年中粮屯河(分产品)营业收入占比
图:2008-2012年中粮屯河(分地区)营业收入
图:2008-2012年中粮屯河(分地区)营业收入占比
表:2008-2012年中粮屯河主要产品毛利率分析
表:2012年中粮屯河计划投资项目及投资额
表:2012年中粮屯河主要子公司、参股公司经营情况分析
表:2013-2015年中粮屯河营业收入及净利润预测
图:2008-2013Q1新中基营业收入及净利润
图:2008-2012新中基主营业务(分产品)收入
图:2008-2012 新中基(分产品)主营业务收入占比
图:2008-2012 新中基(分地区)主营业务收入
图:2008-2012 新中基(分地区)主营业务收入占比
表:2008-2012年新中基主要产品毛利率
表:2012年新中基主要子公司、参股公司经营分析
表:2013-2015年新中基营业收入及净利润预测
表:昊汉集团子公司产能概况
表:昊汉集团主要产品及技术参数
图:2008-2013Q1新疆天业营业收入及净利润
图:2008-2012年新疆天业主营业务收入与番茄酱业务收入
图:2008-2012年番茄酱业务主营业务收入占比
图:2008-2012年新疆天业(分地区)主营业务收入
图:2008-2012年新疆天业(分地区)主营业务收入占比
图:2008-2012年新疆天业番茄酱制品毛利率
表:2012年新疆天业主要子公司营业收入及净利润
图:2007-2008年富源实业营业收入及利润总额
图:2007-2008年富源实业净利润
图:2007-2009年泰顺兴业营业收入及利润总额
图:2007-2009年泰顺兴业毛利率
图:2007-2009年泰顺兴业资产及负债总额
Tomato Products Industrial Chain
Processing Tomato Output Worldwide, 2006-2013
Output Distribution of Major Processing Tomato Production Regions, 2012
Processing Tomato Output in Mediterranean, 2006-2012
Tomato Output in Mediterranean, 2012
Output Distribution of Processing Tomatoes in US, 2012
Import & Export Volume of Tomatoes Worldwide, 2000-2010
Import & Export Volume and Proportion of Tomatoes by Continent, 2010
Top 10 Net Tomato Importers and Top 10 Net Tomato Exporters In Global Terms, 2010
Import & Export Volume and Proportion of Peeled Tomato by Continent, 2010
Import & Export Volume and Proportion of Concentrated Tomato Juice by Continent, 2010
Average Import/Export Prices of Tomatoes Worldwide, 2000-2010
Average Price of Fresh Tomatoes in the US, 2000-2011
Average Import & Export Prices of Peeled Tomatoes Worldwide, 2000-2010
Average Import & Export Prices of Concentrated Tomato Juice Worldwide, 2000-2010
Average Prices of Tomato Products in the US, FY2007-FY2013
Output of Processing Tomatoes in China, 2006-2013
Bulk Tomato Prices, 1997-2013
CNY/USD Exchange Rate Parity, 2010-2013
Export Volume of Tomatoes and Tomato Products in China, 2011-2012
Average Export Prices of Tomato Products in China, 2007-May 2013
Export Volume, Export Value and Average Export Price of Vats of Tomato Sauce of China to Top 20 Export Destinations, 2012
Import Volume of Tomatoes and Tomato Products in China, 2011-2012
Import Volume and Import Value of Tomato Sauce and Tinned Tomato (Including Tomato Sauce) in China, 2007-2012
Average Import Price of Tomato Sauce and Tinned Tomato (Including Tomato Sauce) in China, 2007-2012
Import Volume of Tomato Sauce of China by Import Origins, 2011-2012
Import Volume of Tinned Tomatoes (Including Tomato Sauce) of China by Import Origins, 2011-2012
Per Capita Consumption of Tomato Products, 2011
Main Tomato Products of Morning Star
Revenue and Net Income of Heinz, FY2008-FY2012
Revenue of Heinz by Product, FY2008-FY2012
Revenue Structure of Heinz by Product, FY2008-FY2012
Profile of Sales Areas of Heinz
Revenue of Heinz by Region, FY2008-FY2012
Revenue Structure of Heinz by Region, FY2008-FY2012
Gross Margin of Heinz by Region, FY2008-FY2012
Number of Plants of Heinz by Region
Revenue and Net Income of COFCO Tunhe, 2008-2013Q1
Revenue of COFCO Tunhe by Product, 2008-2012
Revenue Structure of COFCO Tunhe by Product, 2008-2012
Revenue of COFCO Tunhe by Region, 2008-2012
Revenue Structure of COFCO Tunhe by Region, 2008-2012
Gross Margin of Major Products of COFCO Tunhe, 2008-2012
Planned Investment Projects and Investment of COFCO Tunhe, 2012
Operation of Major Subsidiaries and Joint-Stock Companies of COFCO Tunhe, 2012
Revenue and Net Income of COFCO Tunhe, 2013-2015E
Revenue and Net Income of Chalkis, 2008-2013Q1
Operating Revenue of Chalkis by Product, 2008-2012
Operating Revenue Structure of Chalkis by Product, 2008-2012
Operating Revenue of Chalkis by Region, 2008-2012
Operating Revenue Structure of Chalkis by Region, 2008-2012
Gross Margin of Major Products of Chalkis, 2008-2012
Operation of Major Subsidiaries and Joint-Stock Companies of Chalkis, 2012
Revenue and Net Income of Chalkis, 2013-2015E
Capacities of Subsidiaries under Haohan Group
Major Products and Their Specifications of Haohan Group
Revenue and Net Income of Xinjiang Tianye, 2008-2013Q1
Operating Revenue and Tomato Sauce Business Revenue of Xinjiang Tianye, 2008-2012
Proportion of Operating Revenue from Tomato Sauce Business of Xinjiang Tianye, 2008-2012
Operating Revenue of Xinjiang Tianye by Region, 2008-2012
Operating Revenue Structure of Xinjiang Tianye by Region, 2008-2012
Gross Margin of Tomato Sauce Products of Xinjiang Tianye, 2008-2012
Revenue and Net Income of Major Subsidiaries under Xinjiang Tianye, 2012
Revenue and Total Profit of Fuyuan Industrial, 2007-2008
Net Income of Fuyuan Industrial, 2007-2008
Revenue and Total Profit of Taishun Industrial (Inner Mongolia) Food, 2007-2009
Gross Margin of Taishun Industrial (Inner Mongolia) Food, 2007-2009
Assets and Total Liabilities of Taishun Industrial (Inner Mongolia) Food, 2007-2009
如果这份报告不能满足您的要求,我们还可以为您定制报告,请 留言说明您的详细需求。
|