|
|
|
报告导航:研究报告—
农业与食品—食品饮料
|
|
2013-2015年中国制糖行业研究报告 |
 |
字数:3.2万 |
页数:89 |
图表数:111 |
|
中文电子版:7500元 |
中文纸版:3750元 |
中文(电子+纸)版:8000元 |
|
英文电子版:2000美元 |
英文纸版:2100美元 |
英文(电子+纸)版:2300美元 |
|
编号:QJC002
|
发布日期:2013-08 |
附件:下载 |
 |
|
|
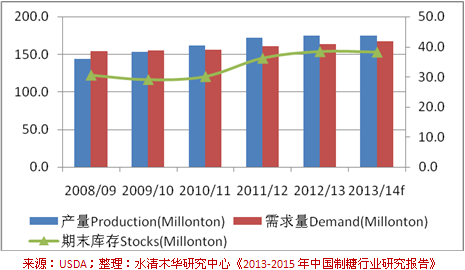
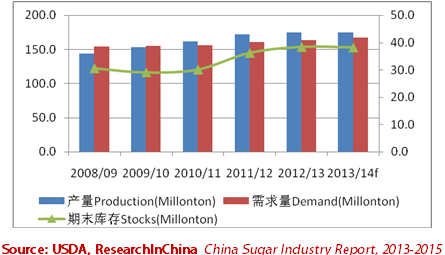
从2008/09到2013/14年度,全球糖供应经历了从供不应求到供给过剩的转变。全球原糖产量从2008/09年度的1.4亿吨提高至2012/13年度的1.7亿吨;而原糖需求量基本稳定在1.5亿吨左右。预计2013/14年度全球原糖产量可达1.749亿吨,原糖消费量将达1.673亿吨,全球原糖行业去库存化压力仍将继续。 图:2008/09-2013/14年度全球原糖产需量及库存
中国是全球重要的食糖生产国和进口国。2012/13年度,中国糖产量达1306.8万吨,同比增长13.5%。广西是中国最大食糖产区,产糖量占全国食糖产量的63.7%。其次为云南和广东,产糖量分别占全国的14.7%和8.4%。2012年,中国食糖进口量374.7万吨,创历史新高。 2012年以来,尽管下游需求保持增长,但受食糖价格走低和生产成本提高的影响,制糖企业亏损面提高。2013年1-6月,中国规模以上制糖企业数量296家,多达55.1%的企业出现亏损,如南华糖业、贵糖股份等上市公司仍面临去库存压力,制糖业务仍将面临困境。 《2013-2015年中国制糖行业研究报告》的内容主要包括以下几方面:- 全球制糖行业的发展现状、市场供需、进出口贸易、价格走势等;
- 中国制糖行业发展现状、市场供需、进出口贸易、价格走势、发展前景等;
- 中国制糖行业下游产业及竞争品行业发展现状、进出口贸易、发展前景等;
- 中国11家主要制糖企业经营现状、投资并购、业务分析及发展预测等。
From 2008/09 to 2013/14, the global supply of sugar has undergone
changes from short supply to excess supply: raw sugar production
increased from 140 million tons in 2008/09 to 170 million tons in
2012/13; while the demand for raw sugar was basically stabilized at
about 150 million tons. It is expected that in 2013/14 global production
of raw sugar may reach 174.9 million tons, with consumption to be 167.3
million tons, the global raw sugar industry continues to face
destocking pressure. Global Raw Sugar Production, Demand and Stocks, 2008/09-2013/14
As
the world’s significant producing and importing country of sugar,
China’s sugar output in 2012/13 climbed 13.5% YoY to 13.068 million
tons, of which, Guangxi was the largest sugar producing area, with sugar
production accounting for 63.7% of the total; followed by Yunnan
(14.7%) and Guangdong (8.4%). In 2012, China imported 3.747 million tons
of table sugar, hitting a record high. Since 2012, despite the
sustainable growth in downstream demand, sugar enterprises affected by
falling prices of table sugar and rising production costs have witnessed
increase of loss. From January to June 2013, among 296 domestic sugar
enterprises above designated size, as many as 55.1% of them suffered
losses, listed companies such as Guangxi Yangpu Nanhua Sugar Industry
Group Co., Ltd. and Guangxi Guitang (Group) Co., Ltd. still faced
destocking pressures, the sugar business would continue to face adverse
conditions. China Sugar Industry Report, 2013-2015 mainly covers the followings: Development status, market supply and demand, import and export trade, price trend, etc. of global sugar industry;
Development status, market supply and demand, import and export trade,
price trend, development prospect, etc. of sugar industry in China;
Development status, import and export trade, development prospect, etc.
of downstream industries and rival commodities industries of sugar
industry in China; Operating status, investment and M&A, business analysis, development forecast, etc. of 11 major sugar companies in China.
第一章 制糖相关概念
1.1 制糖相关概念
1.2 制糖产业链
第二章 国际制糖行业发展概况
2.1 全球糖料生产概况
2.1.1 甘蔗生产
2.1.2 甜菜生产
2.2 全球原糖生产概况
2.2.1 供需分析
2.2.2 供给结构
2.2.3 国际贸易
2.2.4 糖价走势
2.3 主要国家分析
2.3.1 巴西
2.3.2 印度
2.3.3 泰国
2.3.4 澳大利亚
2.3.5 欧盟27国
2.3.6 美国
2.3.7 俄罗斯
第三章 中国制糖行业发展概况
3.1 政策环境
3.1.1 制糖行业“十二五”发展规划
3.1.2 国家储备制度
3.1.3 食糖进口关税制度
3.2 中国糖料生产
3.2.1 甘蔗
3.2.2 甜菜
3.3 中国食糖生产概况
3.3.1 食糖生产
3.3.2 原糖需求
3.3.3 进出口
3.3.4 价格走势
3.4 制糖企业
第四章 下游产业及替代品行业分析
4.1 下游行业
4.1.1 饮料行业
4.1.2 糖果行业
4.1.3 糕点行业
4.1.4 乳制品行业
4.2 替代品行业
4.2.1 淀粉糖
4.2.2 木糖醇
第五章 重点企业分析
5.1 南宁糖业
5.1.1 公司介绍
5.1.2 经营状况
5.1.3 营收构成
5.1.4 毛利率
5.1.5 客户情况
5.1.6 制糖业务
5.1.7 预测与展望
5.2 贵糖股份
5.2.1 公司介绍
5.2.2 经营状况
5.2.3 营收构成
5.2.4 毛利率
5.2.5 客户情况
5.2.6 制糖业务
5.2.7 预测与展望
5.3 中粮屯河
5.3.1 公司介绍
5.3.2 经营状况
5.3.3 营收构成
5.3.4 毛利率
5.3.5 客户情况
5.3.6 制糖业务
5.3.7 预测与展望
5.4 华资实业
5.4.1 公司介绍
5.4.2 经营状况
5.4.3 营收构成
5.4.4 毛利率
5.4.5 客户情况
5.4.6 制糖业务
5.4.7预测与展望
5.5 冠农股份
5.5.1公司介绍
5.5.2经营状况
5.5.3营收构成
5.5.4毛利率
5.5.5客户情况
5.5.6制糖业务
5.5.7预测与展望
5.6 南华糖业
5.6.1 公司简介
5.6.2 子公司
5.6.3 募资项目
5.7 东糖集团
5.7.1 公司简介
5.7.2 子公司
5.8 农垦糖业
5.8.1 公司简介
5.8.2 子公司
5.9 英茂糖业
5.9.1 公司简介
5.9.2 经营情况
5.9.3 子公司
5.10 博天糖业
5.10.1 公司简介
5.10.2 子公司
5.11 恒福糖业
1. Sugar Related Concepts
1.1 Sugar Related Concepts
1.2 Sugar Industry Chain
2. Development of International Sugar Industry
2.1 Global Sugar Crop Production
2.1.1 Sugarcane
2.1.2 Beet
2.2 Global Raw Sugar Production
2.2.1 Supply & Demand
2.2.2 Supply Structure
2.2.3 International Trade
2.2.4 Sugar Price Trend
2.3 Major Countries
2.3.1 Brazil
2.3.2 India
2.3.3 Thailand
2.3.4 Australia
2.3.5 EU-27
2.3.6 USA
2.3.7 Russia
3. Development of China Sugar Industry
3.1 Policy Environment
3.1.1 12th Five-Year Development Plan for Sugar Industry
3.1.2 National Reserve System
3.1.3 Sugar Import Tariff System
3.2 Sugar Crop Production
3.2.1 Sugarcane
3.2.2 Beet
3.3 Overview of Table Sugar Production
3.3.1 Table Sugar Production
3.3.2 Demand for Raw Sugar
3.3.3 Import & Export
3.3.4 Price Trend
3.4 Sugar Enterprises
4. Downstream Industry & Alternatives Industry
4.1 Downstream Industry
4.1.1 Beverage
4.1.2 Confectionery
4.1.3 Pastry
4.1.4 Dairy
4.2 Alternatives Industry
4.2.1 Starch Sugar
4.2.2 Xylitol
5. Key Companies
5.1 Nanning Sugar Industry Co., Ltd.
5.1.1 Profile
5.1.2 Operation
5.1.3 Revenue Structure
5.1.4 Gross Margin
5.1.5 Clients
5.1.6 Sugar Business
5.1.7 Prospect & Outlook
5.2 Guangxi Guitang (Group) Co., Ltd.
5.2.1 Profile
5.2.2 Operation
5.2.3 Revenue Structure
5.2.4 Gross Margin
5.2.5 Clients
5.2.6 Sugar Business
5.2.7 Prospect & Outlook
5.3 COFCO Tunhe
5.3.1 Profile
5.3.2 Operation
5.3.3 Revenue Structure
5.3.4 Gross Margin
5.3.5 Clients
5.3.6 Sugar Business
5.3.7 Prospect & Outlook
5.4 Baotou Huazi Industrial Co., Ltd.
5.4.1 Profile
5.4.2 Operation
5.4.3 Revenue Structure
5.4.4 Gross Margin
5.4.5 Clients
5.4.6 Sugar Business
5.4.7 Prospect & Outlook
5.5 Xinjiang Guannong Fruit & Antler Group Co., Ltd
5.5.1 Profile
5.5.2 Operation
5.5.3 Revenue Structure
5.5.4 Gross Margin
5.5.5 Clients
5.5.6 Sugar Business
5.5.7 Prospect & Outlook
5.6 Guangxi Yangpu Nanhua Sugar Industry Group Co., Ltd.
5.6.1 Profile
5.6.2 Subsidiary
5.6.3 Fundraising Projects
5.7 Dongtang Group
5.7.1 Profile
5.7.2 Subsidiary
5.8 GuangXi State Farms Sugar Industrial Group Company Limited
5.8.1 Profile
5.8.2 Subsidiary
5.9 Yunnan Yinmore Sugar Group Company Ltd.
5.9.1 Profile
5.9.2 Operation
5.9.3 Subsidiary
5.10 Botian Sugar
5.10.1 Profile
5.10.2 Subsidiary
5.11 Guangdong Hengfu Sugar Industry Group Co., Ltd.
图:制糖工业产业链
图:2006-2012年全球甘蔗产量
图:2006-2012年全球各大洲甘蔗产量占比
图:2006-2012年美洲各区域甘蔗产量占比
图:2006-2012年亚洲各区域甘蔗产量占比
表:2010-2012年全球十大甘蔗主产国产量及占比
图:2006-2012年全球甜菜产量
图:2006-2012全球各大洲甜菜产量占比
图:2006-2012欧洲各区域甜菜产量占比
图:2006-2012亚洲各区域甜菜产量占比
图:2006-2012美洲各区域甜菜产量占比
表:2010-2012年全球十大甜菜主产国产量及占比
图:2008/09-2013/14年度全球原糖产需量及库存
图:1970s-2000s全球蔗糖、甜菜糖产量占比
图:2005-2013年全球甜菜糖、蔗糖产量占比
图:2008/09-2013/14年度全球原糖贸易量
图:2010-2013年ICE原糖主力合约月度平均价
图:2010-2013年LIFFE砂糖主力合约月度平均价
图:2008/09-2012/13年度巴西原糖产量及出口量
图:2012/13年度巴西原糖产量分布
图:2012/13年度巴西中南部各州原糖产量占比
图:2008/09-2012/13年度印度原糖产量及进出口量
图:2012/13年度印度各州甘蔗种植面积占比
图:2008/09-2012/13年度泰国原糖产量及出口量
图:2008/09-2012/13年度澳大利亚原糖产量及出口量
图:2008/09-2012/13年度欧盟27国原糖产量及进出口量
图:2008/09-2012/13年度美国原糖产量及进口量
图:2007/08-2013/14年度美国蔗糖、甜菜糖产量占比
图:FY2008-FY2013年美国糖进口结构
图:2008/09-2012/13年度俄罗斯原糖产量及进口量
图:2006-2012年中国甘蔗、甜菜种植面积占比
图:2003-2011年中国甘蔗种植面积及同比增长率
图:2012年中国甘蔗主产区种植面积占比
图:2003-2011年中国甜菜种植面积及同比增长率
图:2012年中国甜菜主产区种植面积占比
图:2006/07-2012/13年度中国糖产量及同比增长率
图:2012/13年度中国食糖主产区产量占比
图:2005/06-2012/13年度中国蔗糖、甜菜糖产量占比
图:2005/06-2012/13年度中国蔗糖、甜菜糖产量
图:2008/09-2012/13年度中国原糖需求量
图:2005-2013年中国食糖进出口量
图:2013年1-6月中国主要食糖进口国占比
图:2001-2013年中糖协综合糖价均价走势图
图:1999-2013年中国制糖企业数量(单位:家)
图:1999-2013年中国制糖行业亏损企业占比
图:2001-2013年中国饮料制造企业数量(单位:家)
图:2006-2013年中国软饮料产量及同比增长
图:2001-2013年中国糖果、巧克力、蜜饯制造企业数量(单位:家)
图:2006-2013年中国糖果产量及同比增长
图:2001-2013年中国糕点制造企业数量(单位:家)
图:2006-2010年中国糕点产量及同比增长
图:2003-2013年中国乳制品制造企业数量(单位:家)
图:2006-2012年中国乳制品产量及同比增长
图:2006-2012年中国淀粉糖产量及同比增长
图:2009-2013年中国木糖醇出口量及同比增长率
图:2008-2013年南宁糖业营业收入和净利润
图:2008-2013年南宁糖业(分产品)营业收入
表:2008-2013年南宁糖业(分产品)营业收入占比
图:2008-2013年南宁糖业(分地区)营业收入
图:2008-2013年南宁糖业(分地区)营业收入占比
图:2008-2013年南宁糖业主营产品毛利率
图:2008-2013年南宁糖业前五名客户销售收入贡献及占比
表:2013年南宁糖业前五名客户名称、收入贡献及占比
图:2008-2013年南宁糖业机制糖营业收入及毛利率
图:2008-2012年南宁糖业机制糖产销量
图:2010-2015年南宁糖业营业收入及净利润预测
图:2008-2013年贵糖股份营业收入和净利润
图:2010-2012年贵糖股份(分产品)营业收入
表:2010-2012年贵糖股份(分产品)营业收入占比
表:2010-2012年贵糖股份(分地区)营业收入
表:2010-2012年贵糖股份(分地区)营业收入占比
图:2008-2012年贵糖股份主营产品毛利率
图:2009-2012年贵糖股份前五名客户销售金额收入及占比
表:2012年贵糖股份前五名客户名称、收入贡献及占比
图:2010-2012年贵糖股份机制糖营业收入及毛利率
图:2008-2012年贵糖股份产糖量
图:2010-2015贵糖股份营业收入及净利润预测
图:2008-2013年中粮屯河营业收入和净利润
图:2010-2012年中粮屯河(分产品)营业收入
图:2008-2012年中粮屯河(分产品)营业收入占比
图:2008-2012年中粮屯河(分地区)营业收入
图:2008-2012年中粮屯河(分地区)营业收入占比
图:2008-2012年中粮屯河主营产品毛利率
图:2008-2012年中粮屯河前五名客户营业收入贡献及占比
表:2008-2012中粮屯河前五名客户名称、收入贡献及占比
图:2008-2012年中粮屯河糖营业收入及毛利率
表:2012年中粮屯河制糖相关子公司经营情况
表:2013-2015年中粮屯河营业收入及净利润预测
图:2008-2013年华资实业营业收入和净利润
图:2008-2012年华资实业(分产品)营业收入
图:2008-2012年华资实业(分产品)营业收入占比
图:2008-2012年华资实业(分地区)营业收入
图:2008-2012年华资实业(分地区)营业收入占比
图:2009-2012年华资实业制糖业毛利率
图:2008-2013年华资实业前五名客户销售收入贡献及占比
表:2012年华资实业前五名客户名称、收入贡献及占比
图:2008-2013年冠农股份营业收入和净利润
表:2008-2012年冠农股份(分产品)营业收入
图:2008-2012年冠农股份(分产品)营业收入占比
图:2008-2012年冠农股份(分地区)营业收入
图:2008-2012年冠农股份(分地区)营业收入占比
表:2008-2012年冠农股份主要产品毛利率
图:2008-2012年冠农股份前五名客户销售收入贡献及占比
表:2012年冠农股份前五名客户名称、收入贡献及占比
图:2008-2012年冠农股份制糖营业收入与毛利率
表:2010-2015年冠农股份营业收入及净利润预测
表:2011年南华糖业主要子公司及其制糖生产情况
表:2012年南华糖业募集资金投资项目情况表
图:2010-2011年英茂糖业销售收入及利润
表:2009/10-2012/13年英茂糖业甘蔗压榨量及糖产量
表:英茂糖业下属主要糖厂及其产能
Sugar Industry Chain
Global Sugarcane Output, 2006-2012
Global Sugarcane Output Structure by Continent, 2006-2012
American Sugarcane Output Structure by Region, 2006-2012
Asian Sugarcane Output Structure by Region, 2006-2012
World’s Top 10 Sugarcane Producing Countries and Proportion, 2010-2012
Global Beet Output, 2006-2012
Global Beet Output Structure by Continent, 2006-2012
European Beet Output Structure by Region, 2006-2012
Asian Beet Output Structure by Region, 2006-2012
American Beet Output Structure by Region, 2006-2012
World’s Top 10 Beet Producing Countries and Proportion, 2010-2012
Global Raw Sugar Production, Demand and Stocks, 2008/09-2013/14
Global Sugarcane and Beet Sugar Output Structure, 1970s-2000s
Global Beet Sugar and Sugarcane Output Structure, 2005-2013
Global Raw Sugar Trade Volume, 2008/09-2013/14
Monthly Average Price for ICE Raw Sugar Dominant Contracts, 2010-2013
Monthly Average Price for LIFFE Granulated Sugar Dominant Contracts, 2010-2013
Brazil’s Raw Sugar Output and Export Volume, 2008/09-2012/13
Distribution of Raw Sugar Production in Brazil, 2012/13
Raw Sugar Output Structure in Central and Southern Brazil by State, 2012/13
India’s Raw Sugar Output, Import and Export Volume, 2008/09-2012/13
India’s Sugarcane Acreage Structure by State, 2012/13
Thailand’s Raw Sugar Output and Export Volume, 2008/09-2012/13
Australia’s Raw Sugar Output and Export Volume, 2008/09-2012/13
EU-27’s Raw Sugar Output, Import and Export Volume, 2008/09-2012/13
U.S. Raw Sugar Output and Import Volume, 2008/09-2012/13
U.S. Sugarcane and Beet Sugar Output Structure, 2007/08-2013/14
U.S. Sugar Import Structure, FY2008-FY2013
Russia’s Raw Sugar Output and Import Volume, 2008/09-2012/13
China’s Sugarcane and Beet Acreage Structure, 2006-2012
China’s Sugarcane Acreage and YoY Growth Rate, 2003-2011
China’s Sugarcane Acreage Structure by Main Producing Area, 2012
China’s Beet Acreage and YoY Growth Rate, 2003-2011
China’s Beet Acreage Structure by Main Producing Area, 2012
China’s Sugar Output and YoY Growth Rate, 2006/07-2012/13
China’s Table Sugar Output Structure by Main Producing Area, 2012/13
China’s Sugarcane and Beet Sugar Output Structure, 2005/06-2012/13
China’s Sugarcane and Beet Sugar Output, 2005/06-2012/13
China’s Demand for Raw Sugar, 2008/09-2012/13
China’s Table Sugar Import and Export Volume, 2005-2013
Proportion of China’s Major Table Sugar Importing Countries, Jan.-Jun. 2013
CSA (China Sugar Association) Integrated Sugar Price Charts, 2001-2013
Number of Sugar Enterprises in China, 1999-2013
Proportion of Loss-Making Enterprises in China Sugar Industry, 1999-2013
Number of Beverage Producers in China, 2001-2013
China’s Soft Drinks Output and YoY Growth, 2006-2013
Number of Candy, Chocolate, Candied Fruit Producers in China, 2001-2013
China’s Candy Output and YoY Growth, 2006-2013
Number of Pastry Producers in China, 2001-2013
China’s Pastry Output and YoY Growth, 2006-2010
Number of Dairy Producers in China, 2003-2013
China’s Dairy Output and YoY Growth, 2006-2012
China’s Starch Sugar Output and YoY Growth, 2006-2012
China’s Xylitol Export Volume and YoY Growth Rate, 2009-2013
Revenue and Net Income of Nanning Sugar Industry, 2008-2013
Revenue Breakdown of Nanning Sugar Industry by Product, 2008-2013
Revenue Structure of Nanning Sugar Industry by Product, 2008-2013
Revenue Breakdown of Nanning Sugar Industry by Region, 2008-2013
Revenue Structure of Nanning Sugar Industry by Region, 2008-2013
Gross Margin of Major Products of Nanning Sugar Industry, 2008-2013
Nanning Sugar Industry’s Revenue from Top 5 Clients and % of Total Revenue, 2008-2013
Name List and Revenue Contribution of Nanning Sugar Industry’s Top 5 Clients, 2013
Revenue and Gross Margin of Machine-made Sugar of Nanning Sugar Industry, 2008-2013
Machine-made Sugar Output and Sales Volume of Nanning Sugar Industry, 2008-2012
Revenue and Net Income of Nanning Sugar Industry, 2010-2015E
Revenue and Net Income of Guangxi Guitang (Group), 2008-2013
Revenue Breakdown of Guangxi Guitang (Group) by Product, 2010-2012
Revenue Structure of Guangxi Guitang (Group)by Product, 2010-2012
Revenue Breakdown of Guangxi Guitang (Group) by Region, 2010-2012
Revenue Structure of Guangxi Guitang (Group) by Region, 2010-2012
Gross Margin of Major Products of Guangxi Guitang (Group), 2008-2012
Guangxi Guitang (Group)’s Revenue from Top 5 Clients and % of Total Revenue, 2009-2012
Name List and Revenue Contribution of Guangxi Guitang (Group)’s Top 5 Clients, 2012
Revenue and Gross Margin of Machine-made Sugar of Guangxi Guitang (Group), 2010-2012
Sugar Output of Guangxi Guitang (Group), 2008-2012
Revenue and Net Income of Guangxi Guitang (Group), 2010-2015E
Revenue and Net Income of COFCO Tunhe, 2008-2013
Revenue Breakdown of COFCO Tunhe by Product, 2010-2012
Revenue Structure of COFCO Tunhe by Product, 2008-2012
Revenue Breakdown of COFCO Tunhe by Region, 2008-2012
Revenue Structure of COFCO Tunhe by Region, 2008-2012
Gross Margin of Major Products of COFCO Tunhe, 2008-2012
COFCO Tunhe’s Revenue from Top 5 Clients and % of Total Revenue, 2008-2012
Name List and Revenue Contribution of COFCO Tunhe’s Top 5 Clients, 2008-2012
Revenue and Gross Margin of Sugar Industry of COFCO Tunhe, 2008-2012
Operation of Sugar Related Subsidiaries of COFCO Tunhe, 2012
Revenue and Net Income of COFCO Tunhe, 2013-2015E
Revenue and Net Income of Baotou Huazi Industrial, 2008-2013
Revenue Breakdown of Baotou Huazi Industrial by Product, 2008-2012
Revenue Structure of Baotou Huazi Industrial by Product, 2008-2012
Revenue Breakdown of Baotou Huazi Industrial by Region, 2008-2012
Revenue Structure of Baotou Huazi Industrial by Region, 2008-2012
Gross Margin of Sugar Industry of Baotou Huazi Industrial, 2009-2012
Baotou Huazi Industrial’s Revenue from Top 5 Clients and % of Total Revenue, 2008-2013
Name List and Revenue Contribution of Baotou Huazi Industrial’s Top 5 Clients, 2012
Revenue and Net Income of Xinjiang Guannong Fruit & Antler Group, 2008-2013
Revenue Breakdown of Xinjiang Guannong Fruit & Antler Group by Product, 2008-2012
Revenue Structure of Xinjiang Guannong Fruit & Antler Group by Product, 2008-2012
Revenue Breakdown of Xinjiang Guannong Fruit & Antler Group by Region, 2008-2012
Revenue Structure of Xinjiang Guannong Fruit & Antler Group by Region, 2008-2012
Gross Margin of Major Products of Xinjiang Guannong Fruit & Antler Group, 2008-2012
Xinjiang Guannong Fruit & Antler Group’s Revenue from Top 5 Clients and % of Total Revenue, 2008-2012
Name List and Revenue Contribution of Xinjiang Guannong Fruit & Antler Group’s Top 5 Clients, 2012
Revenue and Gross Margin of Sugar Business of Xinjiang Guannong Fruit & Antler Group, 2008-2012
Revenue and Net Income of Xinjiang Guannong Fruit & Antler Group, 2010-2015E
Sugar Production of Major Subsidiaries of Guangxi Yangpu Nanhua Sugar Industry Group, 2011
Fund-raising Projects of Guangxi Yangpu Nanhua Sugar Industry Group, 2012
Sales and Profit of Yunnan Yinmore Sugar Group, 2010-2011
Sugarcane Squeezing Amount and Sugar Output of Yunnan Yinmore Sugar Group, 2009/10-2012/13
Capacity of Major Sugar Factories Subordinate to Yunnan Yinmore Sugar Group
如果这份报告不能满足您的要求,我们还可以为您定制报告,请 留言说明您的详细需求。
|