|
|
|
报告导航:研究报告—
农业与食品—农业
|
|
2013-2015年全球及中国塑料包装行业研究报告 |
 |
字数:2.1万 |
页数:92 |
图表数:99 |
|
中文电子版:8000元 |
中文纸版:4000元 |
中文(电子+纸)版:8500元 |
|
英文电子版:2200美元 |
英文纸版:2300美元 |
英文(电子+纸)版:2500美元 |
|
编号:CHW008
|
发布日期:2013-09 |
附件:下载 |
 |
|
|
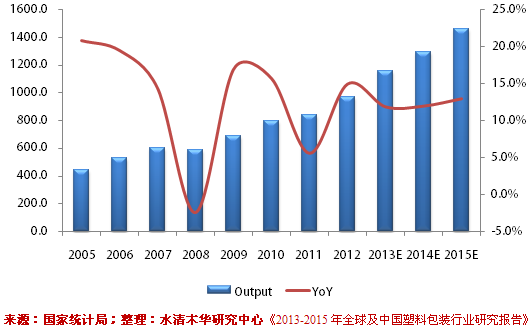
塑料包装的传统市场在美国和欧洲,但近年来在亚洲和拉丁美洲等地区的市场增长速度明显超过欧美地区。新兴市场不久将取代欧美市场,成为塑料包装产品的主要市场。 图:2005-2015年中国塑料薄膜产量及其增速(单位:万吨)
近年来,中国包装市场规模增长较快,已成为全球第二大包装市场,但塑料包装产业集中度并不高。以塑料软包装为例,其生产企业有18,000多家,但大多规模较小,存在产品同质化、产能过剩、竞争力不强等问题。目前,包括永新股份、上海紫江彩印包装公司、北京德宝商三包装印刷有限公司等在内的前五大企业的市场占有率合计不到15%。 本报告在预测全球及中国塑料包装市场规模及未来发展趋势的基础上,对全球及中国塑料包装市场竞争格局进行分析,并对海外及国内主要塑料包装企业进行了重点分析。 永新股份(002014)是中国主要塑料包装企业之一,主要生产经营塑胶彩印复合软包装材料、药品包装材料、真空镀铝膜、多功能高阻隔薄膜等产品。其中,彩印复合包装销售收入在总收入中占比为92.2%。2012年,受下游需求不旺盛等因素影响,彩印复合包装材料收入基本与2011年持平。 安姆科Amcor 是全球最顶尖的包装公司之一,2012年Amcor实现营业收入60.8亿澳元,较2011年下降3.7%。Amcor 在食品、药品、化妆品、烟草包装领域居于领先地位,其在中国设有七个生产基地,分布于广东惠州、中山、佛山、江苏江阴、四川成都及北京。
Traditional plastic packaging markets are founded in the United States
and Europe, however, market growth rates in Asia, Latin America and
other regions over the years have significantly exceeded that in
European and American area. Emerging markets will soon replace the U.S.
and European markets to be the main force for plastic packaging
products. Output and YoY Growth Rate of Plastic Film in China, 2005-2015 (Unit: 10kt)
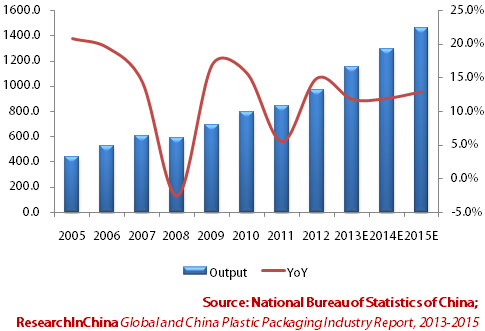
In
recent years, China has seen rapid development in packaging market
size, which has made it the world’s second largest packaging market, but
the plastic packaging industry concentration is not high. For example,
there are more than 18,000 flexible plastic packaging manufacturers, but
mostly with small scale, confronted with product homogeneity, excess
capacity, lack of competitiveness and other problems. For now, the top
five companies involving HuangShan NOVEL Co.,Ltd, Shanghai Zijiang Color
Printing & Packing Co., Ltd and VPS Propack Beijing Co., Ltd.
accounted for a total market share of less than 15%. Around the
global and China plastic packaging industries, this report makes an
analysis on market competition based on the prediction of market size
and future trends, but also focusing on major companies at home and
abroad. As one of China’s major plastic packaging enterprises,
HuangShan NOVEL Co.,Ltd, (002014) is mainly occupied in the production
and operation of plastic composite color printing flexible packaging
materials, pharmaceutical packaging materials, vacuum aluminised plastic
films, multifunctional high-barrier films, etc., of which, composite
color printing packaging sales occupied 92.2% of the total revenue. In
2012, influenced by the weak downstream demand and other factors,
revenue from composite color printing packaging materials was basically
flat with that in 2011. Being one of the top packing companies
in the world, Amcor’s revenue harvested AUD6.08 billion in 2012, down
3.7% from a year earlier. It holds a leading position in food,
pharmaceuticals, cosmetics, tobacco packaging and other fields, with
seven production bases in China, located in Huizhou (Guangdong),
Zhongshan (Guangdong), Foshan (Guangdong), Jiangyin (Jiangsu), Chengdu
(Sichuan) and Beijing.
第一章 塑料包装行业概述
1.1 定义及分类
1.2 行业地位
1.3 产业链
1.4 行业特征
第二章 全球塑料包装行业发展概况
2.1 发展现状
2.2 市场规模
2.3 竞争格局
2.4 发展动态
2.4.1 厂商动态
2.5 下游厂商特点
第三章 中国塑料包装行业发展概况
3.1 政策环境
3.2 供需情况
3.2.1 市场供给
3.2.2 市场需求
3.3 竞争格局
3.4 进出口
3.5 行业壁垒
3.6 发展前景及趋势
本章小结
第四章 塑料包装行业上下游分析
4.1 上游
4.2 下游
4.2.1食品饮料塑料包装
4.2.2药用塑料包装
4.2.3化妆品塑料包装
第五章 全球塑料包装企业分析
5.1 利乐 TETRA PAK
5.1.1 公司介绍
5.1.2 经营情况
5.1.3 在华发展
5.2安姆科AMCOR
5.2.1 公司介绍
5.2.2 经营情况
5.2.3 营收结构
5.2.4 硬塑料业务部
5.2.5 在华发展
5.3 东洋制罐TOYO SEIKAN GROUP
5.3.1 公司简介
5.3.2 经营情况
5.3.3 塑料包装业务
5.3.4 在华发展
5.4 雷盛集团REXAM
5.4.1 公司简介
5.4.2 经营情况
5.4.3 营收结构
5.4.4 医药包装业务
5.4.5 在华发展
5.5美国希悦尔 SEALED AIR
5.5.1 公司简介
5.5.2 经营情况
5.5.3 在华发展
本章小结
第六章 中国塑料包装企业分析
6.1 双星新材
6.1.1 公司简介
6.1.2 经营情况
6.1.3 营收结构
6.1.4 毛利率
6.1.5 发展前景
6.2 国风塑业
6.2.1 公司简介
6.2.2 经营情况
6.2.3 营收结构
6.2.4 毛利率
6.3浙江众成
6.3.1 公司简介
6.3.2 经营情况
6.3.3 营收结构
6.3.4 毛利率
6.3.5 发展前景
6.4 佛塑科技
6.4.1 公司简介
6.4.2 经营情况
6.4.3 营收结构
6.4.4 毛利率
6.4.5 发展前景
6.5 大东南
6.5.1 公司简介
6.5.2 经营情况
6.5.3 营收结构
6.5.4 毛利率
6.5.5 发展前景
6.6 珠海中富
6.6.1 公司简介
6.6.2 经营情况
6.6.3 营收结构
6.6.4 毛利率
6.6.5 发展前景
6.7 永新股份
6.7.1 公司简介
6.7.2 经营情况
6.7.3 营收结构
6.7.4 毛利率
6.7.5 发展前景
6.8 通产丽星
6.8.1 公司简介
6.8.2 经营情况
6.8.3 营收结构
6.8.4 毛利率
6.8.5 发展前景
6.9 紫江企业
6.9.1 公司简介
6.9.2 经营情况
6.9.3 营收结构
6.9.4 毛利率
6.9.5 发展前景
6.10浙江赐富集团有限公司
6.10.1 公司介绍
6.10.2 经营情况
6.10.3 薄膜子公司
6.11绍兴翔宇绿色包装有限公司
6.11.1 公司介绍
6.11.2 经营情况
6.12北京德宝商三包装印刷有限公司
6.12.1 公司介绍
6.12.2 经营情况
6.13中山环亚塑料包装有限公司
6.13.1 公司介绍
6.13.2 经营情况
6.14宏铭材料科技股份有限公司
6.14.1 公司介绍
6.14.2 经营情况
本章小结
1. Overview of Plastic Packaging Industry
1.1 Definition and Classification
1.2 Industry Position
1.3 Industry Chain
1.4 Industrial Characteristics
2. Development of Global Plastic Packaging Industry
2.1 Status Quo
2.2 Market Size
2.3 Competition Pattern
2.4 Dynamics
2.4.1 Manufacturers
2.5 Downstream Manufacturers
3. Development of China Plastic Packaging Industry
3.1 Policy
3.2 Supply and Demand
3.2.1 Supply
3.2.2 Demand
3.3 Competition Pattern
3.4 Import & Export
3.5 Industry Barriers
3.6 Prospect and Trend
Summary
4. Upstream and Downstream of Plastic Packaging Industry
4.1 Upstream
4.2 Downstream
4.2.1 Food & Beverage Plastic Packaging
4.2.2 Pharmaceutical Plastic Packaging
4.2.3 Cosmetic Plastic Packaging
5. Global Plastic Packaging Companies
5.1 Tetra Pak
5.1.1 Profile
5.1.2 Operation
5.1.3 Tetra Pak in China
5.2 Amcor
5.2.1 Profile
5.2.2 Operation
5.2.3 Revenue Structure
5.2.4 Rigid Plastic Segment
5.2.5 Amcor In China
5.3 Toyo Seikan Group
5.3.1 Profile
5.3.2 Operation
5.3.3 Packaging Business
5.3.4 Toyo Seikan Group In China
5.4 Rexam
5.4.1 Profile
5.4.2 Operation
5.4.3 Revenue Structure
5.4.4 Pharmaceutical Packaging Business
5.4.5 Rexam in China
5.5 Sealed Air
5.5.1 Profile
5.5.2 Operation
5.5.3 Sealed Air in China
Summary
6. Chinese Plastic Packaging Companies
6.1 Jiangsu Shuangxing Color Plastic New Materials Co., Ltd.
6.1.1 Profile
6.1.2 Operation
6.1.3 Revenue Structure
6.1.4 Gross Margin
6.1.5 Development Outlook
6.2 Anhui Guofeng Plastic Industry Co.,Ltd.
6.2.1 Profile
6.2.2 Operation
6.2.3 Revenue Structure
6.2.4 Gross Margin
6.3 Zhejiang Zhongcheng Packing Material Co., Ltd
6.3.1 Profile
6.3.2 Operation
6.3.3 Revenue Structure
6.3.4 Gross Margin
6.3.5 Development Outlook
6.4 FSPG Hi-Tech Co., Ltd.
6.4.1 Profile
6.4.2 Operation
6.4.3 Revenue Structure
6.4.4 Gross Margin
6.4.5 Development Outlook
6.5 Zhejiang Great Southeast Co.,Ltd
6.5.1 Profile
6.5.2 Operation
6.5.3 Revenue Structure
6.5.4 Gross Margin
6.5.5 Development Outlook
6.6 Zhuhai Zhongfu Enterprise Co.,Ltd
6.6.1 Profile
6.6.2 Operation
6.6.3 Revenue Structure
6.6.4 Gross Margin
6.6.5 Development Outlook
6.7 Huangshan Novel Co.,Ltd
6.7.1 Profile
6.7.2 Operation
6.7.3 Revenue Structure
6.7.4 Gross Margin
6.7.5 Development Outlook
6.8 Shenzhen Beauty Star Co.,Ltd
6.8.1 Profile
6.8.2 Operation
6.8.3 Revenue Structure
6.8.4 Gross Margin
6.8.5 Development Outlook
6.9 Shanghai Zijiang Enterprise Group Co.,Ltd
6.9.1 Profile
6.9.2 Operation
6.9.3 Revenue Structure
6.9.4 Gross Margin
6.9.5 Development Outlook
6.10 Zhejiang Cifu Group
6.10.1 Profile
6.10.2 Operation
6.10.3 Film Manfacturing Subsidiaries
6.11 Shaoxing Xiangyu Green Packing Co., Ltd.
6.11.1 Profile
6.11.2 Operation
6.12 VPS Propack Beijing Co., Ltd
6.12.1 Profile
6.12.2 Operation
6.13 Zhongshan Huanya Plastic Package Co., Ltd.
6.13.1 Profile
6.13.2 Operation
6.14 Guangzhou Hongming Materials Science and Technology Co., Ltd.
6.14.1 Profile
6.14.2 Operation
Summary
表:塑料软包装材料分类及应用
表:塑料硬包装材料分类及应用
图:2011年包装市场各子行业占比
图:塑料包装行业产业链
图:2006-2016年全球包装行业市场规模及其增速(单位:十亿美元)
图:2010-2015年全球塑料包装市场规模及其增速(单位:十亿美元)
表:2011-2012年全球包装行业主要公司情况
表:2010年欧美消费品制造业主要厂商及集中度
表:2005-2012年中国包装行业相关政策
图:2005-2015年中国塑料薄膜产量及其增速(单位:万吨)
图:2005-2015年中国塑料包装箱及容器产量及其增速(单位:万吨)
图:2005-2015年中国塑料丝、绳及编织品产量及其增速(单位:万吨)
图:2005-2015年中国塑料薄膜销量及其增速(单位:万吨)
表:2010年中国塑料软包装行业企业TOP5
表:2010年中国化妆品塑料包装行业企业TOP5
表:2010年中国塑料包装企业聚酯薄膜产能TOP8
图:2008-2015年中国塑料包装进口数量及金额
图:2008-2015年中国塑料包装出口数量及金额
图:2005-2015年塑料包装分产品产量增速
图:2008-2013年中国塑料包装净出口量(单位:百万吨)
图:2010-2013年聚酯切片与原油价格走势
图:2010-2013年聚酯薄膜与聚酯切片价格走势(单位:元/吨)
图:2011年中国塑料包装下游构成
2009-2013 中国食品制造业收入
表:2010年中国和发达国家主要消费品人均消费水平对比
图:2010年医药包装分材料占比
图:2008-2012年中国卫生总费用及其增速(单位:十亿元)
图:2008-2013年中国化妆品零售额及其增速(单位:亿元)
图:2007-2012 年中国化妆品塑料包装市场规模及增长(单位:十亿元)
图:2008-2012年利乐公司净销售额(单位:十亿欧元)
图:2010-2020年利乐公司营业收入分地区占比
图:2010-2020年发展中国家散装奶和包装奶占比
图:2007-2009年利乐包装(北京)有限公司主营业务收入和利润总额(单位:百万元)
图:Amcor公司运营结构图
图:2011-2012 公司主要财务指标
图:2012年安姆科分业务部门及分地区收入
图:2011-2012年硬塑料业务财务指标
图:2007-2009年安姆科软包装(北京)有限公司主营业务收入和利润总额(单位:百万元)
图:2012-2013 财年东洋制罐主要财务指标
图:2013财年东洋制罐分部门销售收入
图:2007-2009年重庆联合制罐有限公司主营业务收入和利润总额(单位:百万元)
图:2011-2012年雷盛集团主要财务指标(单位:百万欧元)
图:2011-2012年雷盛集团分部门收入
图:2011-2012 年医药包装业务主要财务指标
图:2011-2012年Rexam分地区销售收入
图:2007-2009年雷盛塑料包装(深圳)有限公司主营业务收入和利润总额(单位:百万元)
图:2008-2012年美国希悦尔净销售额(单位:百万美元)
图:2012年美国希悦尔净销售额分区域占比
图:2012年美国希悦尔净销售额分业务占比
图:2007-2009年希悦尔(佛山高明)包装主营业务收入和利润总额(单位:百万元)
表:2012年全球主要塑料包装企业销售收入和在华投资
图:2009-2013 年双星新材营业收入及净利润(单位:百万人民币)
表:2009-2012年双星新材分产品收入(单位:百万人民币)
表:2009-2012年双星新材分地区收入(单位:百万人民币)
表:2009-2012年双星新材分产品毛利率
表:2012-2015 年双星新材营业收入及净利润(单位:百万人民币)
图:2009-2013 年国风塑业营业收入及净利润(单位:百万人民币)
表:2009-2012年国风塑业分产品收入(单位:百万人民币)
表:2009-2012年国风塑业分地区收入(单位:百万人民币)
表:2009-2012年国风塑业分产品毛利率
图:2009-2013 年浙江众成营业收入及净利润(单位:百万人民币)
表:2009-2012年浙江众成分产品收入(单位:百万人民币)
表:2009-2012年浙江众成分地区收入(单位:百万人民币)
表:2009-2012年浙江众成分产品毛利率
表:2012-2015 年浙江众成营业收入及净利润(单位:百万人民币)
图:2009-2013 年佛塑科技营业收入及净利润(单位:百万人民币)
表:2011-2013年佛塑科技分产品收入(单位:百万人民币)
表:2011-2013年佛塑科技分产品毛利率
表:2012-2015 年佛塑科技营业收入及净利润(单位:百万人民币)
图:2009-2013 年大东南营业收入及净利润(单位:百万人民币)
表:2009-2012年大东南分产品收入(单位:百万人民币)
表:2009-2012年大东南分地区收入(单位:百万人民币)
表:2009-2012年大东南分产品毛利率
表:2012-2015 年大东南营业收入及净利润(单位:百万人民币)
图:2009-2013 年珠海中富营业收入及净利润(单位:百万人民币)
表:2010-2012年珠海中富分产品收入(单位:百万人民币)
表:2009-2012年珠海中富分地区收入(单位:百万人民币)
表:2010-2012年珠海中富分产品毛利率
表:2012-2015 年珠海中富营业收入及净利润(单位:百万人民币)
图:2009-2013 年永新股份营业收入及净利润(单位:百万人民币)
表:2009-2012年永新股份分产品收入(单位:百万人民币)
表:2009-2013年永新股份分地区收入(单位:百万人民币)
表:2009-2012年永新股份分产品毛利率
表:2012-2015 年永新股份营业收入及净利润(单位:百万人民币)
图:2009-2013 年通产丽星营业收入及净利润(单位:百万人民币)
表:2009-2013年通产丽星分产品收入(单位:百万人民币)
表:2009-2012年通产丽星分地区收入(单位:百万人民币)
表:2009-2013年通产丽星分产品毛利率
表:2012-2015 年通产丽星营业收入及净利润(单位:百万人民币)
图:2009-2013 年紫江企业营业收入及净利润(单位:百万人民币)
表:2009-2013年紫江企业分产品收入(单位:百万人民币)
表:2009-2013年紫江企业分产品毛利率
表:2012-2015 年紫江企业营业收入及净利润(单位:百万人民币)
图:2007-2009年浙江欧亚薄膜材料有限公司主营业务收入和利润总额(单位:百万元)
图:2007-2009年绍兴翔宇绿色包装有限公司主营业务收入和利润总额(单位:百万元)
图:2007-2009年北京德宝商三包装印刷有限公司主营业务收入和利润总额(单位:百万元)
图:2007-2009年中山环亚塑料包装有限公司主营业务收入和利润总额(单位:百万元)
图:2007-2009年宏铭材料科技股份有限公司主营业务收入和利润总额(单位:百万元)
表:2011-2012年塑料包装行业九家上市公司经营情况(单位:百万元)
Classification and Application of Flexible Plastic Packaging Material
Classification and Application of Rigid Plastic Packaging Material
Market Share of Sub-sectors of Packaging Industry in 2012
Plastic Packaging Industry Chain
Market Size and YoY Growth Rate of Global Packaging Industry, 2006-2016E
Market Size and YoY Growth Rate of Global Plastic Packaging Industry
Overview of Major Packaging Companies Worldwide, 2011-2012
Major Manufacturers and Concentration Ratio in European and American Consumer Goods Manufacturing Industry, 2010
Policy on Packaging Industry in China, 2005-2012
Output and YoY Growth Rate of China Plastic Film, 2005-2015E
Output and YoY Growth Rate of China Plastic Boxes and Containers, 2005-2015E
Output and YoY Growth Rate of China Plastic Wire, Rope and Woven Goods, 2005-2015E
Sales Volume and YoY Growth Rate of China Plastic film, 2005-2015E
Top 5 Companies in China Flexible Plastic Packaging Industry, 2010
Top 5 Companies in China Cosmetic Plastic Packaging Industry, 2010
Top 8 Plastic Packaging Companies by Polyester Film Capacity in China, 2010
Import Volume and Value of Plastic Packaging in China, 2008-2015E
Export Volume and Value of Plastic Packaging in China, 2008-2015
Growth Rate of China Plastic Packaging Output by Product, 2005-2015E
Net Export Volume of China Plastic Packaging, 2008-2013
Prices of Polyester Chip and Crude Oil, 2010-2013
Prices of Polyester Chips and Polyester Film, 2010-2013
Downstream Structure of China Plastic Packaging in 2011
Sales and YoY Growth Rate of China Food Manufacturing Industry, 2009-2013
Per Capita Consumption Levels of Key Consumer Goods in China and the Developed Countries, 2010
Proportion of Pharmaceutical Packaging Materials in 2010
China Total Health Expenditure and Growth Rate, 2008-2012
China Cosmetic Retailing and YoY Growth Rate, 2008-2013
China Cosmetic Plastic Packaging Market Size and YoY Growth Rate, 2007-2012
Net Sales of Tetra Pak, 2008-2012
Operating Revenue of Tetra Park by Region, 2010-2020
Bulk Milk and Packed Milk Proportions in the Developing Countries, 2010-2020
Operating Revenue and Total Profits of Tetra Park (Beijing), 2007-2009
Operational Structure of Amcor
Key Financial Indicators of Amcor, 2011-2012
Revenue of Amcor by Business Segment and Region in 2012
Financial Indicators of Amcor’s Rigid Plastic Business Segment, 2011-2012
Operating Revenue and Total Profits of Amcor (Beijing), 2007-2009
Key Financial Indicators of Toyo Seikan, FY2012-FY2013
Net Sales of Toyo Seikan by Segment in FY2013
Operating Revenue and Total Profits of Chongqing United Can, 2007-2009
Key Financial Indicators of Rexam, 2011-2012
Revenue of Rexam by Business Segment, 2011-2012
Key Financial Indicators of Healthcare Packaging Segment, 2011-2012
Revenue of Rexam by Region, 2011-2012
Operating Revenue and Total Profits of Rexam (Shenzhen), 2007-2009
Net Sales of Sealed Air, 2008-2012
Net Sales of Sealed Air by Region in 2012
Net Sales of Sealed Air by Business Segment in 2012
Operating Revenue and Total Profits of Sealed Air (Foshan Gaoming), 2007-2009
Sales and Investment in China of Global Leading Plastic Packaging Companies in 2012
Revenue and Net Income of Jiangsu Shuangxing Color Plastic New Materials, 2009-2013
Revenue of Jiangsu Shuangxing Color Plastic New Materials by Product, 2009-2012
Revenue of Jiangsu Shuangxing Color Plastic New Materials by Region, 2009-2012
Gross Margin of Jiangsu Shuangxing Color Plastic New Materials by Product, 2009-2012
Revenue and Net Income of Jiangsu Shuangxing Color Plastic New Materials, 2012-2015E
Revenue and Net Income of Guofeng Plastic, 2009-2013
Revenue of Guofeng Plastic by Product, 2009-2012
Revenue of Guofeng Plastic by Region, 2009-2012
Gross Margin of Guofeng Plastic by Product, 2009-2012
Revenue and Net Income of Zhejiang Zhongcheng Packing Material, 2009-2013
Revenue of Zhejiang Zhongcheng Packing Material by Product, 2009-2012
Revenue of Zhejiang Zhongcheng Packing Material by Region, 2009-2012
Gross Margin of Zhejiang Zhongcheng Packing Material by Product, 2009-2012
Revenue and Net Income of Zhejiang Zhongcheng Packing Material, 2012-2015E
Revenue of FSPG by Product, 2011-2013
Gross Margin of FSPG by Product, 2011-2013
Revenue and Net Income of FSPG, 2012-2015E
Revenue and Net Income of Zhejiang Great Southeast, 2009-2013
Revenue of Zhejiang Great Southeast by Product, 2009-2012
Revenue of Zhejiang Great Southeast by Region, 2009-2012
Gross Margin of Zhejiang Great Southeast by Product, 2009-2012
Revenue and Net Income of Zhejiang Great Southeast, 2012-2015E
Revenue and Net Income of Zhuhai Zhongfu, 2009-2013
Revenue of Zhuhai Zhongfu by Product, 2010-2012
Revenue of Zhuhai Zhongfu by Region, 2009-2012
Gross Margin of Zhuhai Zhongfu by Product, 2010-2012
Revenue and Net Income of Zhuhai Zhongfu, 2012-2015E
Revenue and Net Income of Huangshan Novel, 2009-2013
Revenue of Huangshan Novel by Product, 2009-2012
Revenue of Huangshan Novel by Region, 2009-2013
Gross Margin of Huangshan Novel by Product, 2009-2012
Revenue and Net Income of Huangshan Novel, 2012-2015E
Revenue and Net Income of Shenzhen Beauty Star, 2009-2013)
Revenue of Shenzhen Beauty Star by Product, 2009-2013
Revenue of Shenzhen Beauty Star by Region, 2009-2012
Gross Margin of Shenzhen Beauty Star by Product, 2009-2013
Revenue and Net Income of Shenzhen Beauty Star, 2012-2015E
Revenue and Net Income of Shanghai Zijiang, 2009-2013
Revenue of Shanghai Zijiang by Product, 2009-2013
Gross Margin of Shanghai Zijiang by Product, 2010-2013
Revenue and Net Income of Shanghai Zijiang, 2012-2015E
Revenue of xxx, 2009-2012 (Unit: CNY mln)
Operating Revenue and Total Profit of Zhejiang Ouya Thin Film Materials Co., Ltd., 2007-2009
Operating Revenue and Total Profit of Shaoxing Xiangyu Green Packing Co., Ltd., 2007-2009
Operating Revenue and Total Profit of VPS Propack Beijing Co., Ltd., 2007-2009
Operating Revenue and Total Profit of Zhongshan Huanya Plastic Package Co., Ltd., 2007-2009
Operating Revenue and Total Profit of Guangzhou Hongming Materials Science and Technology Co., Ltd., 2007-2009
Operation of Nine Listed Companies in China Plastic Packaging Industry, 2011-2012
如果这份报告不能满足您的要求,我们还可以为您定制报告,请 留言说明您的详细需求。
|