|
|
|
报告导航:研究报告—
TMT产业—消费电子
|
|
2013年全球及中国微型电声行业研究报告 |
 |
字数:3.0万 |
页数:110 |
图表数:115 |
|
中文电子版:8000元 |
中文纸版:4000元 |
中文(电子+纸)版:8500元 |
|
英文电子版:2300美元 |
英文纸版:2400美元 |
英文(电子+纸)版:2600美元 |
|
编号:ZYW099
|
发布日期:2013-09 |
附件:下载 |
 |
|
|
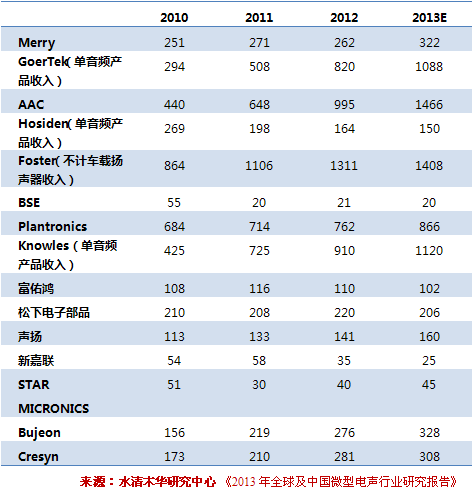
2012-2013年全球及中国微型电声行业研究报告包括以下内容: 1、微型电声简介 2、微型电声下游市场 3、微型电声行业研究 4、21家微型电声厂家研究 微型电声主要指手机、笔记本电脑等移动电子产品上的电声产品,主要包括免提听筒(Handfree)耳机听筒,受话器(Receiver),扬声器(Loudspeakers System)和麦克风(Microphone)四个主要零组件。随着智能手机的爆发,微型电声市场产值也出现了大幅度增长,2011年产值大约5160百万美元,2012年增长26.3%达到6347百万美元。预计2013年该市场的增幅将放缓到13.1%,达到7180百万美元,这其中Handfree和扬声器系统增长最强劲。 Handfree和扬声器系统这两项产品都需要使用大量人力,是劳动力密集型行业,需要企业有能力控制劳动力成本。小企业也难以与大企业竞争,小企业的竞争力越来越弱。例如:韩国的BSE,2009年收入还有156百万美元,2012年锐减到20百万美元上下。又如:A股上市的新嘉联2010年达到364百万人民币的收入后逐年下降,2012年只有223百万人民币,2013年继续下滑,预计低于200百万人民币。日本的STAR MICRONICS的电声业务也是如此,收入从2010财年的7646百万日元,下滑到2013财年的3233百万日元,于是STAR MICRONICS在2013年8月将电声业务转让给了Foster,预计日本Hosiden也会把电声业务转让给Foster。 很火热的MEMS麦克风领域,楼氏还是一枝独秀,占据了一半的市场。不过为了避免过分依赖单一供应商,大家都减少对楼氏的采购量,尤其是苹果。排名第二和第四的都是中国厂家,都是苹果的主供应商之一,都曾经生产ECM,都采用了德国Infineon的MEMS晶圆代工厂。 AAC有近1亿美元的收入,主要产品用在了iPhone 和 iPad mini。歌尔的MEMS麦克风主要用在iPhone上。ADI排名第三,主要生产高性能产品,售价也稍高,主要用在苹果的iPhone 5。Infineon的战略是为那些缺乏技术的公司提供MEMS晶圆代工,其客户众多,包括中国的AAC和歌尔,日本的Hosiden和韩国的BSE。意法半导体排名第五,主要客户是诺基亚,2012年出货量为6000万个,而2010年还是零。意法半导体的MEMS晶圆代工来自日本的欧姆龙,主要客户包括诺基亚,HTC、亚马逊的Kindle,还有笔记本电脑厂家。 2010-2013主要电声厂商营业收入(单位:百万美元)
The report includes the following aspects: 1, Introduction to Micro Electronic-Acoustics 2, Downstream Market of Micro Electronic-Acoustics 3, Micro Electronic-Acoustics Industry 4, 21 Micro Electronic-Acoustics Enterprises Micro
Electronic-Acoustics mainly refers to the electro-acoustic products
installed in mobile phones, laptops and other mobile electronic
products, including handsfree, earphone, receiver, speaker system and
microphone. In the wake of the outbreak of smart phone, the market value
of Micro Electronic-Acoustics soared to USD5,160 million in 2011 and
USD6,347 million with the growth rate of 26.3% in 2012. The growth of
the market is expected to slow down to 13.1% in 2013, valuing USD7,180
million, of which handsfree and speaker system will see the strongest
growth. Handsfree and speaker system industries are
labor-intensive industries, requiring enterprises to control labor
costs. Small enterprises feel difficult to compete with large companies,
and their competitiveness becomes increasingly weak. For
example, the revenue of South Korea BSE slumped from USD156 million in
2009 to USD20 million in 2012. The revenue of the listed company New
Jialian dropped from RMB364 million in 2010 to RMB223 million in 2012,
and is expected to fall below RMB200 million in 2013. The
electro-acoustic revenue of Japan STAR MICRONICS also descended from
JPY7,646 million in FY2010 to JPY3,233 million in FY2013, so STAR
MICRONICS transferred its electro-acoustic business to Foster in August
2013. Japan Hosiden may transfer the business to Foster as well. In
the booming MEMS microphone field, Knowles still performs outstandingly
with 50% market share. However, vendors represented by Apple have
reduced the procurement from Knowles in order to avoid the over-reliance
on it. The second and fourth positions in the market are occupied by
Chinese manufacturers as Apple's main suppliers; both of them have
produced ECM and used the MEMS foundries of Germany Infineon. AAC
has obtained nearly USD100 million in revenue, and its main products
are used in iPhone and iPad mini. GoerTek’s MEMS microphones are
basically applied to iPhone. The third-ranked ADI primarily produces
high-performance products at high selling prices, and these products
find application in Apple's iPhone 5. Infineon acts as a MEMS foundry of
the companies who lack technology, such as China's AAC and GoerTek,
Japan-based Hosiden and South Korea BSE. STMicroelectronics ranks fifth,
mainly serving Nokia, HTC, Amazon Kindle and laptop vendors. Its
shipments hit 60 million in 2012, breaking through the zero record in
2010. STMicroelectronics purchases MEMS wafers from Japan Omron. Revenue of Major Electronic-Acoustics Vendors, 2010-2013 (USD mln)
第一章、手机电声器件简介
1.1、手机受话器
1.2、手机扬声器
1.3、微型麦克风
1.4、MEMS麦克风简介
1.5、MEMS麦克风市场
1.6、微型扬声器
第二章、微型电声产品下游市场
2.1、中国手机市场
2.2、中国手机产业地域分布
2.3、全球手机市场规模
2.4、全球手机品牌市场占有率
2.5、智能手机市场与产业
2.6、全球PC与平板电脑市场
2.7、笔记本电脑产业
2.8、平板电脑产业
2.9、中国移动PC产业
第三章、微型电声产业
3.1、微型电声行业排名
3.2、电声各项产品市场占有率
3.3、手机电声器件厂家与手机厂家配套关系比例
3.4、笔记本电脑扬声器
第四章、微型电声厂家研究
4.1、DOVER
4.1.1、KNOWLES
4.2、美律MERRY
4.3、歌尔声学
4.4、AAC(瑞声)
4.5、HOSIDEN
4.6、FOSTER
4.7、BSE
4.8、BUJEON
4.9、CRESYN
4.10、富佑鸿
4.11、振耀科技
4.12、松下电子部品
4.13、声扬SONION
4.14、新嘉联
4.15、STAR MICRONICS
4.16、江苏裕成
4.17、共达
4.18、联声电子
4.19、莱特电子
4.20、三富电子
4.21、缤特力
1. Introduction to Mobile Electro-Acoustic Devices
1.1 Mobile Phone Receiver
1.2 Mobile Phone Loudspeaker System
1.3 Miniature Microphone
1.4 Introduction to MEMS Microphone
1.5 MEMS Microphone Market
1.6 Miniature Speaker
2 Downstream Micro Electronic-Acoustics Market
2.1 Chinese Mobile Phone Market
2.2 Geographical Distribution of China Mobile Phone Industry
2.3 Global Mobile Phone Market Size
2.4 Market Share of Global Mobile Phone Brands
2.5 Smart Phone Market and Industry
2.6 Global PC and Tablet PC Market
2.7 Laptop Industry
2.8 Tablet PC Industry
2.9 China Mobile PC Industry
3 Micro Electronic-Acoustics Industry
3.1 Industrial Ranking
3.2 Market share by Product
3.3 Relationship between Electro-Acoustic Device Companies and Mobile Phone Vendors
3.4 Laptop Loudspeaker
4 Micro Electronic-Acoustics Enterprises
4.1 Dover
4.1.1 Knowles
4.2 Merry
4.3 GoerTek
4.4 AAC
4.5 Hosiden
4.6 Foster
4.7 BSE
4.8 Bujeon
4.9 Cresyn
4.10 Fortune Grand Technology
4.11 Netronix
4.12 Panasonic Electronic Devices
4.13 Zsound Sonion
4.14 New Jialian
4.15 Star Micronics
4.16 Yucheng Electronic
4.17 Gettop
4.18 Liansheng Electronics
4.19 Wright Electronics
4.20 Sanfu Electronics
4.21 Plantronics
受话器制造工艺流程
2007-2015年全球ECM麦克风市场规模
2008-2010年全球主要ECM麦克风厂家产量
ECM与MEMS对比
2010-2011年全球MEMS麦克风采购商采购数量
2007-2015年全球微型扬声器/受话器市场规模
2008-2010年全球主要微型扬声器/受话器厂家产量
2012年6月-2013年7月中国手机市场出货量
2012年6月-2013年7月中国手机月度新机型数量
2013年中国手机市场出货量网络分布
2012年中国手机产量地域分布
2013年1-7月中国手机产量地域分布
2007-2014年全球手机出货量
2010-2013年全球CDMA/WCDMA手机出货量地域分布
2010-2011年每季度全球主要手机品牌出货量
2011-2012年全球主要手机厂家出货量
2013年2季度全球前十大品牌销量和市场占有率
2013年2季度智能手机操作系统出货量和市场占有率
2013年2季度主要安卓手机厂商出货量和市场占有率
2013年2季度主要WINDOWS PHONE 智能手机厂商出货量和市场占有率
2011-2012中国主要智能手机厂家出货量
2008-2015年全球PC市场规模
2010-2015年全球DESKTOP与LAPTOP电脑出货量
2010-2016年全球TABLETPC出货量
2012年全球笔记本电脑品牌厂家与代工厂家之间配套关系及出货比例
2013年全球笔记本电脑品牌厂家与代工厂家之间配套关系及出货比例
2012、2013年平板电脑主要厂家产量
2004-2012年中国笔记本电脑(包括平板电脑)产量
2010-2012年中国笔记本电脑产量(包括平板电脑)地域分布
微型电声行业排名
2012年微型电声产品下游分布
2012年全球手机微型扬声器厂家市场占有率(按金额)
2012年全球HANDFREE厂家市场占有率
2010-2011年全球蓝牙耳机厂家市场占有率
2010-2011年ECM麦克风主要厂家市场占有率
2012年全球MEMS麦克风厂家收入排名
六大手机厂家微型扬声器配套供应商供应比例
六大手机厂家免提听筒配套供应商供应比例
六大手机厂家麦克风配套供应商供应比例
2012年笔记本电脑用扬声器主要厂家市场占有率
2005-2013年DOVER公司收入与运营利润率
2010-2013年H1 DOVER收入业务分布
2010-2013年H1 DOVER营业利润业务分布
2010年1季度-2013年2季度DOVER DCT收入与运营利润率
2011年DOVER通讯科技部门收入下游应用分布
2012年DOVER通讯科技部门收入下游应用分布
2013年2季度DOVER通讯科技部门收入下游应用分布
2011年DOVER通讯科技部门收入地域分布
2012年DOVER通讯科技部门收入地域分布
2009-2013年KNOWLES收入产品分布
2009-2013年KNOWLES EBITDA
2003-2012年NXP声音事业部出货量增幅
2001-2007年NXP声音事业部收入
2001-2011年NXP声音事业部生产线数量
NXP声音事业部主要客户
2004-2013年美律收入与运营利润率
2011年7月-2013年7月美律每月收入与增幅
2005-2013年美律收入产品分布
2003-2010年美律主要产品平均价格
2004-2011年美律各项产品出货量
2006-2013年美律客户分布
2012年美律大陆子公司简要财务数据
2006-2013年歌尔声学收入与运营利润率
2011年1季度-2013年1季度歌尔声学季度收入与净利润
2011年1季度-2013年1季度歌尔声学季度毛利率与净利润率
2009-2012年歌尔声学毛利率与净利润率
2012年歌尔声学前五大客户
2007-2013年瑞声收入与毛利率
2003-2013年瑞声收入与税前利润率
2006-2012年瑞声收入产品分布
2008-2012年瑞声运营利润分布
2006-2012年瑞声收入地域分布
2007-2012年瑞声客户分布
2011年AAC收入下游应用分布
2006-2010年瑞声研发支出
2006-2010年瑞声专利数量
2008年瑞声子公司简要财务
2006-2013财年HOSIDEN收入与运营利润率
2006-2013财年 HOSIDEN收入产品分布
HOSIDEN中国子公司简要财务
2006-2014财年FOSTER收入与运营利润率
2009-2012财年FOSTER收入地域分布
2010-FY2013财年FOSTER收入业务分布
丰达电机中国子公司简要财务
2007-2012年BSE收入与运营利润
2009-2011年3季度BSE收入客户分布
2009-2011年3季度BSE出货量客户分布
2011年3季度BSE收入产品分布
2010年Q2-Q3 BSE收入产品分布
东莞大朗辉鸿电子厂2008年简要财务数据
苏州富鸿顺电子有限公司2008年简要财务数据
2005-2013年振耀科技收入与运营利润率
2011年7月-2013年7月振耀科技每月收入与增幅
2010-2013年振耀科技收入产品分布
2009-2013年SONION收入与毛利率
新嘉联控股子公司
2004-2013年新嘉联收入与运营利润率
STAR MICRONICS 2007-2012财年收入与运营利润率
2007-2012财年 STAR MICRONICS收入产品分布
2008-2013财年 STAR MICRONICS电声产品出货量下游分布
2008-2013财年 STAR MICRONICS电声产品收入下游分布
2008-2013年山东共达电声收入与运营利润
2012年2月公开上市后主要股东持股比例
共达电声2008-2010年麦克风产量销量
共达电声2008-2010年微型扬声器/受话器产量销量
2009-2011年上半年共达电声产粮\销量\产能\产能利用率
共达电声2009-2011年上半年前五大客户
莱特电子组织结构
2007-2013年 BLUECOM收入运营利润率
2006-2013年BLUECOM收入产品分布
2006-2012年BLUECOM收入客户分布
天津三富各种产品产能
2008-2010年3季度天津三富收入与利润
2006-2014财年缤特力收入与运营利润率
2005-2014财年1季度缤特力毛利率
2005-2014财年1季度缤特力运营利润率
2011财年-2014财年缤特力收入业务分布
Receiver Manufacturing Process
Global ECM Microphone Market Size, 2007-2015E
Output of Major Global ECM Microphone Companies, 2008-2010
Comparison between ECM and MEMS
Purchase Quantity of Global MEMS Microphone Buyers, 2010-2011
Global Miniature Speaker / Receiver Market Size, 2007-2015E
Output of Major Global Miniature Speaker / Receiver Companies, 2008-2010
China’s Mobile Phone Shipment, Jun 2012-Jul 2013
Monthly Number of New Mobile Phone Models in China, Jun 2012-Jul 2013
Distribution of China’s Mobile Phone Shipment, 2013
Geographical Distribution of China's Mobile Phone Output, 2012
Geographical Distribution of China's Mobile Phone Output, Jan-Jul 2013
Global Mobile Phone Shipment, 2007-2014E
Geographical Distribution of Global CDMA / WCDMA Mobile Phone Shipment, 2010-2013
Quarterly Shipment of Major Global Mobile Phone Brands, 2010-2011
Shipment of Major Global Mobile Phone Vendors, 2011-2012
Sales Volume and Market Share of Global Top Ten Mobile Phone Brands, Q2 2013
Shipment and Market Share of Smartphone Operating systems, Q2 2013
Shipment and Market Share of Major Android Smartphone Vendors, Q2 2013
Shipment and Market Share of Major Windows Phone Smartphone Vendors, Q2 2013
Shipment of Major Smartphone Vendors in China, 2011-2012
Global PC Market Size, 2008-2015E
Global Desktop and Laptop Shipment, 2010-2015E
Global Tablet PC Shipment, 2010-2016E
Relationship between Global Notebook Brand Vendors and OEMs and Shipment Ratio, 2012
Relationship between Global Notebook Brand Vendors and OEMs and Shipment Ratio, 2013
Output of Major Tablet PC Manufacturers, 2012-2013
China’s Laptop (including Tablet PC) Output, 2004-2012
China’s Laptop (including Tablet PC) Output by Region, 2010-2012
Ranking of Micro Electronic-Acoustics Industry
Downstream Distribution of Micro Electronic-Acoustics Products, 2012
Market Share of Global Mobile Phone Miniature Speaker Companies by Value, 2012
Market Share of Global Handfree Companies , 2012
Market Share of Global Bluetooth Headset Companies, 2010-2011
Market Share of Major ECM Microphone Companies, 2010-2011
Ranking of Global MEMS Microphone Companies by Revenue, 2012
Supply Breakdown of Miniature Speaker Suppliers of Six Major Mobile Phone Vendors
Supply Breakdown of Handfree Suppliers of Six Major Mobile Phone Vendors
Supply Breakdown of Microphone Suppliers of Six Major Mobile Phone Vendors
Market Share of Major Laptop Loudspeaker Companies, 2012
Revenue and Operating Profit Margin of Dover, 2005-2013
Revenue of Dover by Business, 2010- H1 2013
Operating Profit of Dover by Business, 2010- H1 2013
Revenue and Operating Profit Margin of Dover DCT , Q1 2010-Q2 2013
Revenue of Dover’s Communication Technology Division by Application, 2011
Revenue of Dover’s Communication Technology Division by Application, 2012
Revenue of Dover’s Communication Technology Division by Application, Q2 2013
Revenue of Dover’s Communication Technology Division by Region, 2011
Revenue of Dover’s Communication Technology Division by Region, 2012
Revenue of Knowles by Product, 2009-2013
EBITDA of Knowles, 2009-2013
Shipment Growth Rate of NXP Sound Division, 2003-2012
Revenue of NXP Sound Division, 2001-2007
Number of Production Lines of NXP Sound Division, 2001-2011
Major Clients of NXP Sound Division
Revenue and Operating Profit Margin of Merry, 2004-2013
Monthly Revenue and Growth Rate of Merry, Jul 2011-Jul 2013
Revenue of Merry by Product, 2005-2013
Average Prices of Merry’s Main Products, 2003-2010
Shipment of Merry by Product, 2004-2011
Distribution of Clients of Merry, 2006-2013
Brief Financial Data of Merry’s Subsidiaries in Mainland China, 2012
Revenue and Operating Profit Margin of GoerTek, 2006-2013
Quarterly Revenue and Net Income of GoerTek, Q1 2011- Q1 2013
Quarterly Gross Margin and Net Profit Margin of GoerTek, Q1 2011- Q1 2013
Gross Margin and Net Profit Margin of GoerTek, 2009-2012
Top 5 Clients of GoerTek, 2012
Revenue and Gross Margin of AAC, 2007-2013
Revenue and Pretax Profit Margin of AAC, 2003-2013
Revenue of AAC by Product, 2006-2012
Operating Profit Distribution of AAC, 2008-2012
Revenue of AAC by Region, 2006-2012
Distribution of Clients of AAC, 2007-2012
Revenue of AAC by Application, 2011
R & D Expenditures of AAC, 2006-2010
Number of Patents of AAC, 2006-2010
Brief Financial Data of AAC’s Subsidiaries, 2008
Revenue and Operating Profit Margin of HOSIDEN, FY2006-2013
Revenue of HOSIDEN by Product, FY2006-2013
Summary Financial Data of HOSIDEN’s Chinese Subsidiaries
Revenue and Operating Profit Margin of FOSTER, FY2006-2014
Revenue of FOSTER by Region, FY2009-2012
Revenue of FOSTER by Business, FY 2010-2013
Brief Financial Data of Chinese Subsidiaries of Foster Electric
Revenue and Operating Profit of BSE, 2007-2012
Revenue of BSE by Client, 2009-Q3 2011
Shipment of BSE by Client, 2009-Q3 2011
Revenue of BSE by Product, Q3 2011
BSE Revenue of by Product, Q2-Q3 2010
Brief Financial Data of Dongguan Dalang Huihong Electronics Factory, 2008
Summary Financial Data of Suzhou Fu Hong Shun Electronics Co., Ltd., 2008
Revenue and Operating Profit Margin of Netronix, 2005-2013
Monthly Revenue and Growth Rate of Netronix, Jul 2011-Jul 2013
Revenue of Netronix by Product, 2010-2013
Revenue and Gross Margin of SONION, 2009-2013
Subsidiaries of New Jialian
Revenue and Operating Profit Margin of New Jialian, 2004-2013
Revenue and Operating Profit Margin of Star Micronics, FY2007-2012
Revenue of Star Micronics By Product, FY2007-2012
Shipment Distribution of Electro-Acoustic Products of Star Micronics, FY2008-2013
Revenue Distribution of Electro-Acoustic Products of Star Micronics, FY2008-2013
Revenue and Operating Profit of Gettop, 2008-2013
Shareholding Ratio of Major Shareholders of Gettop after Listing, Feb 2012
Microphone Output and Sales Volume of Gettop, 2008-2010
Output and Sales Volume of Miniature Speakers / Receivers of Gettop, 2008-2010
Gettop’s Output \ Sales Volume \ Capacity \ Capacity Utilization, 2009-H1 2011
Top 5 Clients of Gettop, 2009-H1 2011
Organizational Structure of Wright Electronics
Revenue and Operating Profit Margin of BLUECOM, 2007-2013
Revenue of BLUECOM by Product, 2006-2013
Revenue of BLUECOM by Client, 2006-2012
Capacity of Tianjin Sanfu by Product
Revenue and Profit of Tianjin Sanfu, 2008-Q3 2010
Revenue and Operating Profit Margin of Plantronics, FY2006-2014
Gross Margin of Plantronics, FY2005-Q1 2014
Operating Margin of Plantronics, FY2005-Q1 2014
Revenue of Plantronics by Business, FY2011-2014
如果这份报告不能满足您的要求,我们还可以为您定制报告,请 留言说明您的详细需求。
|