|
|
|
报告导航:研究报告—
生命科学—制药医疗
|
|
2013-2015年中国骨科器械行业研究报告 |
 |
字数:3.0万 |
页数:94 |
图表数:124 |
|
中文电子版:8000元 |
中文纸版:4000元 |
中文(电子+纸)版:8500元 |
|
英文电子版:2000美元 |
英文纸版:2100美元 |
英文(电子+纸)版:2300美元 |
|
编号:LT006
|
发布日期:2013-09 |
附件:下载 |
 |
|
|
受惠于人口老龄化,消费升级和政策扶持,中国骨科器械行业近年来快速发展。中国骨科医疗器械市场总规模由2006年的32.8亿元增长至2012年98.5亿元。 创伤产品、脊柱产品和关节产品是中国骨科器械行业三大细分市场。2012年创伤、脊柱和关节三大产品合计市场份额约为82.2%。创伤产品市场份额最高,2012年市场占比约35.5%,市场规模同比增长18.24%;脊柱、关节产品分居第二、三位,市场规模同比分别增长12.6%和12.4%。 图:2012年中国主要骨科创伤器械企业及市场份额
近年来外资企业加大在华投资,中国市场被外资垄断的趋势愈加明显。强生在2012年收购辛迪思后,已成为中国骨科器械市场最大的厂商,其创伤和脊柱产品市场份额均占第一位。 2012年11月,美敦力以8.16亿美元收购康辉医疗,迈出在中国骨科器械市场本土化的重要一步。相比美敦力定位高端,价格经济的康辉产品可助美敦力拓展全球新兴国家和地区(包括中国)的中低端市场。2012年,美敦力(包括康辉医疗)占中国脊柱市场15.9%份额。 史塞克是全球知名骨科器械企业,其关节产品约占全球20%市场份额。2013年1月,史塞克以7.64亿美元收购了创生股份,借助创生的研发、制造能力及分销网络优势,进一步扩大了其中国市场份额,预计2013年可占中国骨科市场8%-10%份额。 威高股份凭借强大的研发实力和成熟的分销网络,目前已成为中国本土最大的骨科器械供应商,2012年威高骨科器械业务实现营收2.23亿元,其创伤器械产品市场份额约为5.1%。 未来中国骨科器械市场的竞争将更加激烈,小企业往往研发水平较差,生产能力不足,质量控制不规范,在竞争中将逐渐被淘汰,市场将进一步集中到资金和技术实力俱佳的行业巨头手中。 水清木华研究中心《2013-2015年中国骨科器械行业研究报告》主要包括以下几个内容:- 全球骨科器械行业总体概况、市场结构及发展前景分析等;
- 中国骨科器械行业市场结构、竞争格局、进入壁垒及进出口分析等;
- 中国骨科器械行业发展环境(包括政策环境、发展前景及上下游行业发展情况)分析等;
- 中国12家骨科器械厂商(包括强生、美敦力、史塞克、威高股份、凯利泰、爱康宜城、联合骨科等)的经营状况分析等。
Benefiting from aging of population, consumption upgrade and policy
support, China's orthopedic instrument industry has seen rapid
development over the years, with total market size rising from 3.28
billion yuan in 2006 to 9.85 billion yuan in 2012. Trauma
products, spine products and joint products constitute the three major
market segments of Chinese orthopedic instrument industry. In 2012, the
three principal products accounted for an aggregate market share of
about 82.2%, of which, trauma products showed the highest, approximately
35.5%, with market size up 18.24% YoY; spine and joint products ranked
second (up 12.6% YoY) and third (up 12.4% YoY), respectively. Market Share of Major Orthopedic Trauma Instrument Enterprises in China, 2012 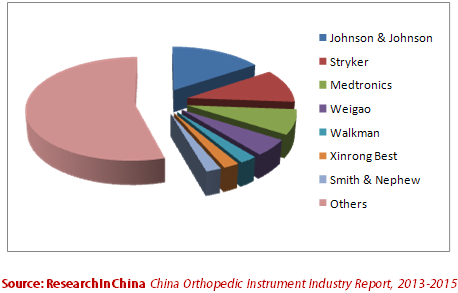 In
recent years, along with the increasing investment of foreign-funded
enterprises in China, the trend of foreign monopoly has been more
evident. After the acquisition of Synthes in 2012, Johnson & Johnson
has turned into the largest company in China's orthopedic instrument
market, with market share of both trauma and spine products occupying
the first place. In November 2012, Medtronic purchased KangHui
Medical for $816 million, thus making an important step in Chinese
orthopedic instrument market localization. Compared with Medtronic's
high-end positioning, affordable KangHui products can help Medtronic
expand low- and medium-end markets in emerging countries and regions
(including China). In 2012, Medtronic (including KangHui Medical)
occupied 15.9% of China's spine market. Stryker is a
world-renowned orthopedic instrument enterprise, and its joint products
account for about 20% of global market share. In January 2013, Stryker
acquired Trauson Holdings for $764 million, and in virtue of the
latter’s R&D and manufacturing capacity and distribution network
advantages further expanded its market share in China, expected to
occupy 8%-10% of China's orthopedic market in 2013. Relying on
powerful R&D strength and mature distribution network, Weigao has
already become the largest local supplier of orthopedic devices in
China. In 2012, its orthopedic device business achieved revenue of 223
million yuan, and trauma equipment products occupied market share of
5.1% or so. In future, the Chinese orthopedic instrument market
will encounter more fierce competition, in which small companies due to
low R&D level, insufficient production capacity and non-standard
quality control tend to be gradually eliminated, and the market will be
further concentrated in industry magnates with superb financial and
technical strength. China Orthopedic Instrument Industry Report, 2013-2015 of ResearchInChina mainly covers the followings: Overview, market structure and development prospect, etc. of global orthopedic instrument industry; Market structure, competition pattern, barriers to entry, import & export, etc. of China orthopedic instrument industry;
Development environment (including policy environment, development
prospects as well as development of upstream and downstream industries)
for China orthopedic instrument industry;
Operating conditions, etc. of 12 orthopedic instrument companies
(including Johnson & Johnson, Medtronic, Stryker, Weigao, Shanghai
Kinetic, Beijing AKEC Medical, United Orthopedic Corporation, etc.) in
China.
第一章 骨科器械行业概述
1.1 定义
1.2 分类
1.3 产业链
第二章 全球骨科器械行业发展分析
2.1 总体概况
2.2 发展前景
第三章 中国骨科器械行业发展分析
3.1 总体概况
3.2 市场结构
3.3 进出口分析
3.3.1 进口情况
3.3.2 出口情况
3.4 竞争格局
3.5 进入壁垒
3.5.1 技术工艺壁垒
3.5.2 市场准入壁垒
3.5.3 销售渠道壁垒
3.5.4 人才壁垒
3.6 销售模式
第四章 中国骨科器械行业发展环境
4.1 政策环境
4.1.1 监管政策
4.1.2 行业政策
4.2 上下游行业
4.2.1 上游行业
4.2.2 下游行业
4.3 发展前景
第五章 中国骨科器械行业主要企业
5.1 强生
5.1.1 企业简介
5.1.2 经营情况
5.1.3 骨科器械业务
5.1.4 在华业务
5.2 美敦力
5.2.1 企业简介
5.2.2 经营情况
5.2.3 骨科器械业务
5.2.4 营收构成
5.2.5 在华业务
5.3 史赛克
5.3.1 企业简介
5.3.2 经营情况
5.3.3 营收构成
5.3.4 在华业务
5.4 威高股份
5.4.1 企业简介
5.4.2 运营情况
5.4.3 营收构成
5.4.4 骨科器械业务
5.4.5 毛利率
5.4.6 研发与投资
5.4.7 客户
5.4.8 预测与展望
5.5 凯利泰
5.5.1 公司简介
5.5.2 运营情况
5.5.3 营收构成
5.5.4 骨科器械业务
5.5.5 毛利率
5.5.6 研发与投资
5.5.7 客户与供应商
5.5.8 预测与展望
5.6 联合骨科
5.6.1 公司简介
5.6.2 运营情况
5.6.3 营收构成
5.6.4 骨科器械业务
5.6.5 毛利率
5.6.6 研发与投资
5.6.7 客户与供应商
5.7 爱康宜诚
5.7.1 企业简介
5.7.2 经营情况
5.7.3 营收构成分析
5.7.4 毛利率分析
5.7.5 研发和投资分析
5.7.6 客户和供应商分析
5.8 欣荣博尔特
5.8.1 企业简介
5.8.2 经营情况
5.9 天津威曼
5.9.1 企业简介
5.9.2 经营情况
5.10 蒙太因
5.10.1 企业简介
5.10.2 经营情况
5.11 力达康
5.11.1 企业简介
5.11.2 经营情况
5.12人立骨科
5.12.1 企业简介
5.12.2 经营情况
1. Overview of Orthopedic Instrument Industry
1.1 Definition
1.2 Classification
1.3 Industry Chain
2. Development of Global Orthopedic Instrument Industry
2.1 Overview
2.2 Development Prospect
3. Development of China Orthopedic Instrument Industry
3.1 Overview
3.2 Market Structure
3.3 Import & Export
3.3.1 Import
3.3.2 Export
3.4 Competition Pattern
3.5 Barriers to Entry
3.5.1 Technology
3.5.2 Market Access
3.5.3 Sales Channel
3.5.4 Talent
3.6 Sales Model
4. Development Environment for China Orthopedic Instrument Industry
4.1 Policy Environment
4.1.1 Regulatory Policy
4.1.2 Industry Policy
4.2 Upstream and Downstream Industries
4.2.1 Upstream
4.2.2 Downstream
4.3 Development Prospects
5. Key Companies in China
5.1 Johnson & Johnson
5.1.1 Profile
5.1.2 Operation
5.1.3 Orthopedic Instrument Business
5.1.4 Business in China
5.2 Medtronic
5.2.1 Profile
5.2.2 Operation
5.2.3 Orthopedic Instrument Business
5.2.4 Revenue Structure
5.2.5 Business in China
5.3 Stryker
5.3.1 Profile
5.3.2 Operation
5.3.3 Revenue Structure
5.3.4 Business in China
5.4 Weigao
5.4.1 Profile
5.4.2 Operation
5.4.3 Revenue Structure
5.4.4 Orthopedic Instrument Business
5.4.5 Gross Margin
5.4.6 R&D and Investment
5.4.7 Clients
5.4.8 Forecast and Outlook
5.5 Shanghai Kinetic Medical Co., Ltd. (KMC)
5.5.1 Profile
5.5.2 Operation
5.5.3 Revenue Structure
5.5.4 Orthopedic Instrument Business
5.5.5 Gross Margin
5.5.6 R&D and Investment
5.5.7 Clients and Suppliers
5.5.8 Forecast and Outlook
5.6 United Orthopedic Corporation
5.6.1 Profile
5.6.2 Operation
5.6.3 Revenue Structure
5.6.4 Orthopedic Instrument Business
5.6.5 Gross Margin
5.6.6 R&D and Investment
5.6.7 Clients and Suppliers
5.7 Beijing AKEC Medical Co. Ltd. (AKEC)
5.7.1 Profile
5.7.2 Operation
5.7.3 Revenue Structure
5.7.4 Gross Margin
5.7.5 R&D and Investment
5.7.6 Clients and Suppliers
5.8 Suzhou Xinrong Best Medical Instrument Co,. Ltd.
5.8.1 Profile
5.8.2 Operation
5.9 Tianjin Walkman Biomaterial Co., Ltd.
5.9.1 Profile
5.9.2 Operation
5.10 Beijing Montagne Medical Device Co., Ltd.
5.10.1 Profile
5.10.2 Operation
5.11 Beijing Lidakang Science and Technology Co., Ltd.
5.11.1 Profile
5.11.2 Operation
5.12 Renli Orthopedics Medical Instrument Limited Company
5.12.1 Profile
5.12.2 Operation
表:骨科器械行业类别
图:骨科器械行业产业链
图:2007-2016年全球医疗器械行业市场规模
图:2002-2012年全球骨科器械市场规模及增速
图:2012年全球骨科器械(分产品)市场份额
图:2015年全球骨科器械(分地区)市场规模
图:2015年全球骨科器械(分产品)市场规模
图:2006-2012年中国骨科器械行业市场规模及增长率
图:2007-2012年中国骨科器械(分产品)市场规模
图:2006-2013年1-7月中国矫形或骨折用器具进口量及进口额
表:2012年中国矫形或骨折用器具进口量前10国家和地区
图:2007-2013年1-7月中国人工关节进口量及进口额
图:2007-2013年1-7月中国矫形或骨折用器具出口量及出口额
表:2012年中国矫形或骨折用器具出口量前10国家和地区
图:2007-2013年1-7月中国人工关节出口量及出口额
图:2012年中国主要骨科创伤器械企业市场份额
图:2012年中国主要骨科脊柱器械企业市场份额
图:骨科器械产品批文申请流程
图:中国骨科器械销售流程
表:2007-2012年中国骨科器械行业政策及主要内容
图:2000-2012年中国医疗卫生总费用及占GDP比重
图:1982-2012年中国65岁及以上人口数及占总人口比例
图:2001-2012年中国城镇居民人均可支配收入和农村居民家庭人均纯收入
表:2012年中国医保覆盖人群及支出水平
表:2011年中国部分省市骨科植入器械医保覆盖额度
图:2008-2014年中国骨科器械行业市场规模
图:2007-2012年中国汽车保有量
图:2011-2014年中国骨科器械行业(分产品)市场规模
图:2008-2012年强生公司营业收入及净利润
图:2012年强生公司(分产品)营收构成
图:2010-2012年强生公司骨科业务营业收入及占比
表:强生公司在华企业及主要产品
图:2008-2009年强生苏州营业收入及利润总额
图:2008-2009年强生苏州毛利率
图:2008-2009年强生苏州资产总额及负债总额
图:2008-2013财年美敦力营业收入及净利润
图:2009-2013财年美敦力毛利率
图:2008-2013财年美敦力脊椎产品营业收入及占比
图:2011-2013财年美敦力(分产品)营收占比
图:2009-2013财年美敦力(分地区)营收占比
图:2008-2011年康辉医疗营业收入和净利润
图:2008-2011年康辉医疗(分产品)营收构成
图:2008-2011年康辉医疗(分地区)营收构成
图:2008-2011年康辉医疗毛利率
图:2008-2011年康辉医疗研发支出及占营收占比
图:2008-2012年史赛克营业收入及净利润
图:2010-2012年史塞克骨科器械业务营业收入及占比
图:2009-2012年史塞克(分产品)营收占比
图:2009-2012年史塞克(分地区)营收占比
表:2008-2011年创生控股主要产品产量
表:2008-2011年创生控股主要产品产能利用率
图:2008-2012年创生控股营业收入和净利润
图:2008-2012年创生控股(分产品)营收构成
图:2008-2012年创生控股(分地区)营收构成
图:2009-2012年创生控股代理商及授权医院数量
表:2008-2011年创生中国、常州奥斯迈(分地区)营收占比
图:2008-2012年创生控股毛利率
图:2008-2012年创生控股研发支出及营收占比
表:威高股份产品种类及主要产品
图:2008-2013年威高股份营业收入及净利润
图:2012年威高股份销售及分销网络分布
图:2009-2013年威高股份(分产品)营收占比
表:2009-2012年威高股份常规医疗耗材(分产品)产量增速
图:2006-2012年威高股份常规医疗耗材产品收入构成
表:威高股份常规医疗耗材主要高附加值产品
表:2008-2012年威高股份(分地区)营业收入
图:2008-2012年威高股份骨科器械产量
图:2008-2013年威高股份骨科器械营业收入及增速
图:2004-2012年威高股份毛利率及净利率
图:2008-2012年威高股份研发投入及营收占比
表:2007-2012年威高股份专利和注册证书
图:2007-2012年威高股份各类客户基数
表:2012年威高股份(分级别)医院客户
图:2008-2012年威高股份每客户平均销售额及增速
图:2012-2015年威高股份营业收入及净利润
图:2008-2013年凯利泰营业收入及净利润
图:2008-2013年凯利泰(分产品)营收占比
图:2009-2012年凯利泰(分地区)营收占比
表:PKP/PVP手术系统与常规疗法成本及手术效果比较
图:2009-2012年凯利泰PKP及PVP手术系统销量
表:中国和美国椎体成形产品使用量比较
图:中国医保纳入PKP省份分布
图:2008-2013年凯利泰毛利率
图:2008-2011年凯利泰(分产品)毛利率
图:2010-2012年凯利泰研发投入资金及营收占比
图:凯利泰储备研发项目
表:2010-2012年凯利泰专利情况
图:2009-2012年凯利泰前五名客户营收贡献及占比
图:2009-2011年凯利泰主要原料采购额
图:2012-2015年凯利泰营业收入及净利润
图:2008-2012年联合骨科营业收入及净利润
图:2008-2012年联合骨科(分地区)营收占比
图:2011-2012年联合骨科(分产品)营收占比
图:2010-2011年联合骨科人工关节产能、产量及产值
图:2008-2012年联合骨科毛利率
图:2009-2012年联合骨科研发投入及其营收占比
图:2010-2012年联合骨科前三名供应商采购额及占比
图:2010-2012年联合骨科前三名客户营收贡献及占比
表:2009-2011年爱康宜诚产能、产量及产能利用率
表:2009-2011年爱康宜诚疫苗产量、销量及产销率
图:2009-2011年爱康宜诚营业收入和净利润
图:2008-2011年爱康宜诚(分产品)营收构成
图:2008-2011年爱康宜诚(分地区)营收构成
表:2009-2011年爱康宜诚毛利率
表:2009-2011年爱康宜诚主要产品毛利率
图:2009-2011年爱康宜诚研发支出及占营业收入比例
表:2012年爱康宜诚拟在建项目及投资额
表:2009-2011年爱康宜诚前五名客户名单、贡献收入及占比
表:2009-2012年爱康宜诚前五名供应商名单、采购金额及占比
图:2007-2009年欣荣博尔特营业收入及利润总额
图:2007-2009年欣荣博尔特毛利率
图:2007-2009年欣荣博尔特资产总额及负债总额
图:2007-2009年威曼营业收入及利润总额
图:2007-2009年威曼毛利率
图:2007-2009年威曼资产总额及负债总额
图:2007-2009年蒙太因营业收入及利润总额
图:2007-2009年蒙太因毛利率
图:2007-2009年蒙太因资产总额及负债总额
图:2007-2009年力达康营业收入及利润总额
图:2007-2009年力达康毛利率
图:2007-2009年力达康资产总额及负债总额
图:2007-2009年人立骨科营业收入及利润总额
图:2007-2009年人立骨科毛利率
图:2007-2009年人立骨科资产总额及负债总额
Orthopedic Instrument Industry Category
Orthopedic Instrument Industry Chain
Global Medical Device Industry Market Size, 2007-2016
Global Orthopedic Instrument Market Size and Growth Rate, 2002-2012
Global Orthopedic Instrument Market Share (by Product), 2012
Global Orthopedic Instrument Market Size (by Region), 2015
Global Orthopedic Instrument Market Size (by Product), 2015
China’s Orthopedic Instrument Industry Market Size and Growth Rate, 2006-2012
China’s Orthopedic Instrument Market Size (by Product), 2007-2012
China’s Import Volume and Value of Orthopedic or Fracture Appliances, 2006 – Jan.-Jul. 2013
Top 10 Countries (Regions) by China’s Import Volume of Orthopedic or Fracture Appliances, 2012
China’s Import Volume and Value of Artificial Joints, 2007 – Jan.-Jul. 2013
China’s Export Volume and Value of Orthopedic or Fracture Appliances, 2007 – Jan.-Jul. 2013
Top 10 Countries (Regions) by China’s Export Volume of Orthopedic or Fracture Appliances, 2012
China’s Export Volume and Value of Artificial Joints, 2007 – Jan.-Jul. 2013
Market Share of Major Orthopedic Trauma Instrument Enterprises in China, 2012
Market Share of Major Spine Orthopedic Instrument Enterprises in China, 2012
Orthopedic Instrument Product Approval Application Process
China’s Orthopedic Instrument Sales Process
Main Content of Orthopedic Instrument Industry Policies in China, 2007-2012
China's Total Health Care Expenditure As a Percentage of GDP, 2000-2012
Population Aged 65 and Above (% of Total) in China, 1982-2012
China’s Per Capita Disposable Income of Urban Residents and Per Capita Net Income of Rural Households, 2001-2012
Chinese Health Insurance Coverage and Spending Levels, 2012
Health Insurance Coverage Limits for Orthopedic Implants in Some Provinces and Cities of China, 2011
China’s Orthopedic Instrument Industry Market Size, 2008-2014
China’s Car Ownership, 2007-2012
China’s Orthopedic Instrument Industry Market Size (by Product), 2011-2014
Revenue and Net Income of Johnson & Johnson, 2008-2012
Revenue Structure of Johnson & Johnson, (by Product), 2012
Johnson & Johnson’s Revenue from Orthopedic Business and % of Total Revenue, 2010-2012
Major Products of Johnson & Johnson’s Companies in China
Revenue and Total Profit of Johnson & Johnson Medical (Suzhou), 2008-2009
Gross Margin of Johnson & Johnson Medical (Suzhou), 2008-2009
Total Assets and Total Liabilities of Johnson & Johnson Medical (Suzhou), 2008-2009
Revenue and Net Income of Medtronic, FY2008-FY2013
Gross Margin of Medtronic, FY2009-FY2013
Medtronic’s Revenue from Spine Products and % of Total Revenue, FY2008-FY2013
Revenue Structure of Medtronic (by Product), FY2011-FY2013
Revenue Structure of Medtronic (by Region), FY2009-FY2013
Revenue and Net Income of KangHui Medical, 2008-2011
Revenue Structure of KangHui Medical (by Product), 2008-2011
Revenue Structure of KangHui Medical (by Region), 2008-2011
Gross Margin of KangHui Medical, 2008-2011
R&D Costs and % of Total Revenue of KangHui Medical, 2008-2011
Revenue and Net Income of Stryker, 2008-2012
Stryker’s Revenue from Orthopedic Instrument Business and % of Total Revenue, 2010-2012
Revenue Structure of Stryker (by Product), 2009-2012
Revenue Structure of Stryker (by Region), 2009-2012
Output of Major Products of Trauson Holdings, 2008-2011
Capacity Utilization of Major Products of Trauson Holdings, 2008-2011
Revenue and Net Income of Trauson Holdings, 2008-2012
Revenue Structure of Trauson Holdings (by Product), 2008-2012
Revenue Structure of Trauson Holdings (by Region), 2008-2012
Number of Agents and Authorized Hospitals of Trauson Holdings, 2009-2012
Revenue Structure of Trauson (China) Medical Instrument and Changzhou Orthmed Medical Instrument (by Region), 2008-2011
Gross Margin of Trauson Holdings, 2008-2012
R&D Costs and % of Total Revenue of Trauson Holdings, 2008-2012
Product Categories and Major Products of Weigao
Revenue and Net Income of Weigao, 2008-2013
Sales and Distribution Network of Weigao, 2012
Revenue Structure of Weigao (by Product), 2009-2013
Output Growth of Weigao’s Conventional Medical Supplies (by Product), 2009-2012
Revenue Structure of Weigao’s Conventional Medical Supplies, 2006-2012
Major High Value-added Products of Weigao’s Conventional Medical Supplies
Revenue Breakdown of Weigao (by Region), 2008-2012
Orthopedic Instrument Production of Weigao, 2008-2012
Orthopedic Instrument Revenue and Growth of Weigao, 2008-2013
Gross Margin and Net Profit Margin of Weigao, 2004-2012
R&D Costs and % of Total Revenue of Weigao, 2008-2012
Weigao’s Patents and Registration Certificates, 2007-2012
Client Bases of Weigao, 2007-2012
Hospital Customers of Weigao (by Grade), 2012
Average Sales per Customer and Growth of Weigao, 2008-2012
Revenue and Net Income of Weigao, 2012-2015
Revenue and Net Income of KMC, 2008-2013
Revenue Structure of KMC (by Product), 2008-2013
Revenue Structure of KMC (by Region), 2009-2012
Cost and Effect Comparison: PKP/PVP Surgery System vs. Conventional Treatment
PKP and PVP Surgery System Sales Volume of KMC, 2009-2012
Comparison of Vertebroplasty Product Consumption: China vs. United States
Provinces with PKP Covered by Medical Insurance in China
Gross Margin of KMC, 2008-2013
Gross Margin Breakdown of KMC (by Product), 2008-2011
R&D Costs and % of Total Revenue of KMC, 2010-2012
KMC’s Reserve R&D Projects
KMC’s Patents, 2010-2012
KMC’s Revenue from Top 5 Clients and % of Total Revenue, 2009-2012
Main Raw Material Purchases of KMC, 2009-2011
Revenue and Net Income of KMC, 2012-2015
Revenue and Net Income of United Orthopedic Corporation, 2008-2012
Revenue Structure of United Orthopedic Corporation (by Region), 2008-2012
Revenue Structure of United Orthopedic Corporation (by Product), 2011-2012
Capacity, Output and Output Value of Artificial Joints of United Orthopedic Corporation, 2010-2011
Gross Margin of United Orthopedic Corporation, 2008-2012
R&D Costs and % of Total Revenue of United Orthopedic Corporation, 2009-2012
United Orthopedic Corporation’s Procurement from Top 3 Suppliers and % of Total Procurement, 2010-2012
United Orthopedic Corporation’s Revenue from Top 3 Clients and % of Total Revenue, 2010-2012
Capacity, Output and Capacity Utilization of AKEC, 2009-2011
Vaccine Output, Sales Volume and Sales-output Ratio of AKEC, 2009-2011
Revenue and Net Income of AKEC, 2009-2011
Revenue Structure of AKEC (by Product), 2008-2011
Revenue Structure of AKEC (by Region), 2008-2011
Gross Margin of AKEC, 2009-2011
Gross Margin of Major Products of AKEC, 2009-2011
R&D Costs and % of Total Revenue of AKEC, 2009-2011
AKEC’s Planned/Ongoing Projects and Investment, 2012
Name List and Revenue Contribution of AKEC’s Top 5 Clients, 2009-2011
AKEC’s Procurement from Top 5 Suppliers and % of Total Procurement, 2009-2012
Revenue and Total Profit of Suzhou Xinrong Best Medical Instrument, 2007-2009
Gross Margin of Suzhou Xinrong Best Medical Instrument, 2007-2009
Total Assets and Total Liabilities of Suzhou Xinrong Best Medical Instrument, 2007-2009
Revenue and Total Profit of Tianjin Walkman Biomaterial, 2007-2009
Gross Margin of Tianjin Walkman Biomaterial, 2007-2009
Total Assets and Total Liabilities of Tianjin Walkman Biomaterial, 2007-2009
Revenue and Total Profit of Beijing Montagne Medical Device, 2007-2009
Gross Margin of Beijing Montagne Medical Device, 2007-2009
Total Assets and Total Liabilities of Beijing Montagne Medical Device, 2007-2009
Revenue and Total Profit of Beijing Lidakang Science and Technology, 2007-2009
Gross Margin of Beijing Lidakang Science and Technology, 2007-2009
Total Assets and Total Liabilities of Beijing Lidakang Science and Technology, 2007-2009
Revenue and Total Profit of Renli Orthopedics, 2007-2009
Gross Margin of Renli Orthopedics, 2007-2009
Total Assets and Total Liabilities of Renli Orthopedics, 2007-2009
如果这份报告不能满足您的要求,我们还可以为您定制报告,请 留言说明您的详细需求。
|