|
|
|
报告导航:研究报告—
制造业—工业机械
|
|
2013-2015年中国余热利用设备行业研究报告 |
 |
字数:2.1万 |
页数:97 |
图表数:102 |
|
中文电子版:7500元 |
中文纸版:3750元 |
中文(电子+纸)版:8000元 |
|
英文电子版:2100美元 |
英文纸版:2200美元 |
英文(电子+纸)版:2400美元 |
|
编号:ZJF053
|
发布日期:2013-09 |
附件:下载 |
 |
|
|
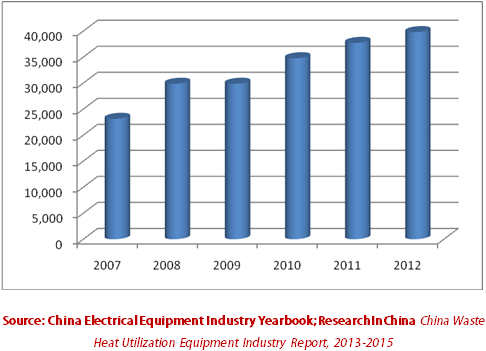
中国余热资源丰富,特别是在钢铁、有色、化工、水泥、建材、石油与石化、轻工、煤炭等行业,余热资源约占其燃料消耗总量的17%~67%,其中可回收利用的余热资源约占余热总资源的60%。目前中国余热资源利用比例低,大型钢铁企业余热利用率约为30%~50%,其他行业则更低,余热利用提升潜力大。 根据余热温度不同,余热利用设备可分两类:一是余热锅炉,主要利用中高温余热;二是溴冷机(或热泵)以及螺杆膨胀机,主要利用低温余热。其中余热锅炉是余热利用设备中最大的一块,2012年余热锅炉产量约为812台,合计39788蒸吨。 2007-2012年中国余热锅炉产量及变化情况(单位:蒸吨)
国务院《节能减排“十二五“规划》指出,到2015年将新增余热余压发电能力2000万千瓦,“十二五”时期形成5700万吨标准煤的节能能力。规划的提出为余热利用行业注入了新的发展动力,带动了以溴冷机和螺杆膨胀机为代表的低温余热利用设备的发展。 在溴化锂吸收装置方面,2012年市场容量达到了 33.2亿元。该市场的领先者为烟台荏原,其市场占有率达到27%,超越双良与远大。 而螺杆膨胀机在中国乃至全球范围内都处在市场推广阶段。中国厂商主要包括江西华电、开山股份与汉钟精机。最早做螺杆膨胀机的是江西华电,其第一台螺杆膨胀机于 2002年投运,目前产品功率范围覆盖 50KW到 1500KW,在电力、钢铁、冶炼、石化、轻工等领域布点应用已经超过 60 台套。 《2013年中国余热利用设备行业研究报告》主要进行了以下研究:- 中国余热利用设备产业整体概况,包括行业发展历程、政策法规、市场规模、发展现状及未来发展趋势;
- 中国余热利用设备主要细分市场分析,包括余热锅炉、溴冷机、以及螺杆膨胀机等细分市场规模,竞争格局以及发展趋势;
- 海陆重工、杭州锅炉、烟台荏原、双良节能、江西华电、开山股份、汉钟精机等10家公司分析, 包括公司简介,财务数据,产能布局,产品优势以及最新发展战略等。
China has rich waste heat resources. Especially in steel, nonferrous,
chemical, cement, building materials, oil & petrochemical, light
industry, coal and other sectors, waste heat resources approximately
occupy 17%-67% of the total fuel consumption, of which, recyclable waste
heat resource roughly stand up 60% of the total waste heat resources.
At present, China’s waste heat utilization ratio is rather low, with the
figure in large steel enterprises being 30%-50%. But the waste heat
utilization in other sectors is even lower. Thus, China is expected to
see a huge potential to improve its waste heat utilization. By
temperture of waste heat, the waste heat utilization equpments fall
into two categories: the first comes to waste heat bolier which uses
medium-and high-temperature waste heat; the second refers to lithium
bromide refrigerator (heat pump) and screw expander, both of which use
low-temperature waste heat. Of these, waste heat boiler occupies a
lion’s share in waste heat utilization equipments. In 2012, the output
of waste heat boiler approximated 812 sets, totaling 39,788 steam tons. Output of Waste Heat Boilers in China, 2007-2012 (steam tons)
According
to the 12th Five-Year Plan On Energy Conservation And Emission
Reduction by the State Council, China will increase its capacity of
waste heat/pressure power generation by 20 million KW as of 2015,
expecting to save 57 million tons of coal equivalents. The release of
the planning injects new development motives for the waste heat
utilization field, leading to the development of low-temperature waste
heat utilization equipments represented by lithium bromide refrigerators
and screw expanders. When it comes to lithium bromide
absorption device, Chinese market capacity reached RMB3.32 billion in
2012, with leading industrial players including Yantai EBARA, the market
occupancy of which realizes 27%, far above Shuangliang Group and Henan
Yuanda Boiler. The screw expander industry is at a stage for
promotion in China and beyond, with major domestic industrial players
including Jiangxi Huadian Electric Power, Kaishan and Shanghai Hanbell
Precise Machinery. In particular, Jiangxi Huadian Electric Power was the
first involved in the production of screw expanders. And its first
screw expander was put into use in 2002. Thus far, its screw expanders’
power range from 50KW to 1,500KW, and the application in fields like
electricity, steel, smelting, petrochemical and light industry has
exceeded 60 sets. The report highlights the followings: 
Overview of China waste heat utilization equipment industry, including
development history, polices and regulations, market scale, status quo
and development outlook; China waste heat utilization equipment market segments, including market size, competition pattern and development tendency;
10 industrial players such as Suzhou Hailu Heavy Industry, Hangzhou
Boiler Group, Yantai EBARA, Shuangliang Group, Jiangxi Huadian Electric
Power, Kaishan, Shanghai Hanbell Precise Machinery in terms of profile,
fiscal data, capacity distribution, product strength and latest
development strategy.
第一章 余热利用行业相关概念
1.1余热资源来源及应用
1.1.1 余热资源的来源及分布
1.1.2 余热资源的应用
1.2 余热利用设备定义及分类
1.3 余热利用设备经济效益评价
第二章 余热利用设备运行环境分析
2.1 宏观经济发展态势良好
2.2 余热利用提升潜力大
2.3 国家政策支持余热利用
第三章 余热锅炉行业发展概况
3.1 市场特点
3.2 市场规模
3.3 竞争格局
3.4 主要相关行业余热发电测算
3.4.1 钢铁行业
3.4.2 焦化行业
3.4.3 水泥行业
第四章 溴冷机(热泵)行业发展概况
4.1 发展现状
4.2 市场规模
4.3 竞争格局
4.4 发展展望
第五章 螺杆膨胀机行业发展概况
5.1 发展现状
5.2 产品经济性分析
5.3 竞争格局
第六章 余热利用设备重点企业介绍
6.1 海陆重工
6.1.1 Introduction
6.1.2 经营状况
6.1.3 Main Business
6.1.4毛利率分析
6.1.5 研发支出
6.1.6客户和供应商分析
6.1.7 公司战略
6.2 杭州锅炉
6.2.1 Introduction
6.2.2 经营状况
6.2.3 Main Business
6.2.4毛利率分析
6.2.5 订单情况
6.2.6客户和供应商分析
6.2.7 发展优势
6.3 双良集团
6.3.1 Introduction
6.3.2 经营状况
6.3.3 Main Business
6.3.4毛利率分析
6.3.5 Main Product
6.3.6客户和供应商分析
6.3.7 发展优势
6.4 太湖锅炉
6.4.1 Introduction
6.4.2 Main Product
6.4.3 发展优势
6.5 川润股份
6.5.1 公司简介
6.5.2 经营状况
6.5.3 Main Business
6.5.4 Main Product
6.5.5毛利率分析
6.5.6客户和供应商分析
6.5.7 研发支出
6.5.8发展优势及战略
6.6 华光股份
6.6.1 Introduction
6.6.2 经营状况
6.6.3 Main Business
6.6.4 Main Product
6.6.5 产销及订单分析
6.6.6毛利率分析
6.6.7 发展战略
6.7 开山股份
6.7.1 Profile
6.7.2 Operation
6.7.3 Main Business
6.7.4 Main Product
6.7.5毛利率分析
6.7.6 成本分析
6.7.7 研发支出
6.7.8客户和供应商分析
6.7.9 Development in 2012-2013
6.8荏原
6.8.1 Introduction
6.8.2 经营状况
6.8.3 烟台荏原
6.8.4 Main Product
6.8.5 发展优势
6.9 汉钟精机
6.9.1 Profile
6.9.2 Operation
6.9.3 Main Business
6.9.4毛利率分析
6.9.5 研发支出
6.9.6 成本分析
6.9.7客户和供应商分析
6.9.8 Main Product
6.10 江西华电
6.10.1 Profile
6.10.2 Main Product
6.10.3 主要应用项目
1. Brief Introduction to Waste Heat Utilization Industry
1.1 Sources and Application of Waste Heat Resources
1.1.1 Sources of Waste Heat Resources and Distribution
1.1.2 Application of Waste Heat Resources
1.2 Definition and Classification of Waste Heat Utilization Equipment
1.3 Assessment on Economic Benefit of Waste Heat Utilization Equipment
2. Operating Environment of Waste Heat Utilization Equipments
2.1 Sound Macro-Economic Development
2.2 Huge Potential
2.3 Policy Support
3. Waste Heat Boiler Development
3.1 Market Features
3.2 Market Scale
3.3 Competition Pattern
3.4 Cogeneration Calculation of Major Related Industries
3.4.1 Steel Industry
3.4.2 Coking Industry
3.4.3 Cement Industry
4. Development of Lithium Bromide Refrigerator (Heat Pump) Industry
4.1 Status Quo
4.2 Market Scale
4.3 Competition Pattern
4.4 Development Prospect
5. Development of Screw Expander Industry
5.1 Status Quo
5.2 Economic Benefits
5.3 Competition Pattern
6. Key Waste Heat Utilization Equipment Companies
6.1 Suzhou Hailu Heavy Industry
6.1.1 Profile
6.1.2 Operation
6.1.3 Main Business
6.1.4 Gross Margin
6.1.5 R&D Expenditure
6.1.6 Clients & Suppliers
6.1.7 Business Strategy
6.2 Hangzhou Boiler Group
6.2.1 Profile
6.2.2 Operation
6.2.3 Main Business
6.2.4 Gross Margin
6.2.5 Orders
6.2.6 Clients & Suppliers
6.2.7 Development Edge
6.3 Shuangliang Group
6.3.1 Profile
6.3.2 Operation
6.3.3 Main Business
6.3.4 Gross Margin
6.3.5 Main Products
6.3.6 Clients & Suppliers
6.3.7 Development Edge
6.4 Jiangsu Taihu Boiler
6.4.1 Profile
6.4.2 Main Products
6.4.3 Development Edge
6.5 Sichuan Crun
6.5.1 Profile
6.5.2 Operation
6.5.3 Main Business
6.5.4 Main Products
6.5.5 Gross Margin
6.5.6 Clients & Suppliers
6.5.7 R&D Expenditure
6.5.8 Development Edge & Strategies
6.6 Wuxi Huaguang Boiler
6.6.1 Profile
6.6.2 Operation
6.6.3 Main Business
6.6.4 Main Products
6.6.5 Output & Sales and Orders
6.6.6 Gross Margin
6.6.7 Development Strategy
6.7 Zhejiang Kaishan Compressor
6.7.1 Profile
6.7.2 Operation
6.7.3 Main Business
6.7.4 Main Products
6.7.5 Gross Margin
6.7.6 Cost Analysis
6.7.7 R&D Expenditure
6.7.8 Clients & Suppliers
6.7.9 Development in 2012-2013
6.8 EBARA
6.8.1 Profile
6.8.2 Operation
6.8.3 Yantai EBARA
6.8.4 Main Products
6.8.5 Development Edge
6.9 Shanghai Hanbell Precise Machinery
6.9.1 Profile
6.9.2 Operation
6.9.3 Main Business
6.9.4 Gross Margin
6.9.5 R&D Expenditure
6.9.6 Cost Analysis
6.9.7 Clients & Suppliers
6.9.8 Main Products
6.10 Jiangxi Huadian Electric Power
6.10.1 Profile
6.10.2 Main Products
6.10.3 Major Application Projects
余热资源分布情况
余热资源的特点
余热资源分级利用的回收方式及热功转化效率
余热利用设备的分类、特点及用途
有机工质双循环螺杆膨胀机发电系统
水泥行业余热发电投资回报预算
1999-2013年GDP同比增速
2007-2013年中国规模以上工业增加值同比增长
2000-2013年固定资产投资同比增速
高耗能行业余热发电渗透率及未来发展目标
2010-2013年8月中国政府出台的与余热回收利用相关政策及内容
2007-2012年中国余热锅炉产量及变化情况(单位:台)
2007-2012年中国余热锅炉产量及变化情况(单位:蒸吨)
2011-2015年中国余热锅炉产量及变化情况(单位:台、蒸吨)
2011年中国余热锅炉产品市场格局(按台计)
2011年中国余热锅炉产品市场格局(按蒸吨计)
2011年中国各类别余热锅炉产量及主要厂商
2010及2015年烧结机余热发电预测
2010及2015年炼铁高炉余压发电预测
2010及2015年煤气优化利用发电预测
2010及2015年干熄焦余热发电预测
十二五期间中国水泥行业余热发电装机容量预测
2008-2012年中国溴化锂市场容量及变化情况(单位:亿元)
2011-2015年中国溴化锂市场容量及变化情况(单位:亿元)
2010-2013年中国溴冷机主要厂商市场份额(%)
影响螺杆膨胀机推广进程的关键因素
国内主要螺杆膨胀机厂商对比
2008-2013年海陆重工营业收入与净利润(百万元)
Revenue and Net Income Forecast of Hailu,2012-2016(RMB mln)
2012年海陆重工主营业收入产品结构
2012年海陆重工营业收入区域结构(百万元)
2008-2013年海陆重工综合及各主要产品毛利率
Main Waste Heat Boiler of Hailu
2011-2012年海陆重工研发支出
2010-2012年海陆重工前五名客户销售金额及占比(百万元)
2010-2012年海陆重工前五名供应商采购额及占比(百万元)
2008-2013年杭州锅炉主营收入与利润(单位:百万元)
Revenue and Net Income Forecast of Hangzhou Boiler,2012-2016(RMB mln)
2012年杭州锅炉主营业收入产品结构
2012年杭州锅炉营业收入区域结构(百万元)
2008-2013年杭锅股份综合及各主要产品毛利率
Main Waste Heat Boiler of HBG
2012年底杭州锅炉公司在手订单情况
2010-2012年杭锅股份前五名客户销售金额及占比(百万元)
2012年杭锅股份前五名客户销售额及占比(百万元)
2010-2012年杭锅股份前五名供应商采购额及占比(百万元)
2012年杭锅股份前五名供应商采购额及占比(百万元)
2008-2013年双良节能收入与净利润(单位:百万元)
Revenue and Net Income Forecast of Shuangliang 2012-2016(RMB mln)
2012年双良节能主营业收入产品结构
2012年双良股份营业收入区域结构(百万元)
2008-2013年双良节能综合及各主要产品毛利率
Main Waste Heat Boiler of Shuangliang Boiler
双良节能主要吸收式热泵产品
2010-2012年双良节能前五名客户销售金额及占比(百万元)
2010-2012年双良节能前五名供应商采购额及占比(百万元)
Main Waste Heat Boiler Products of Taihu Boiler
2008-2013年川润股份营业收入与利润变化情况(百万元)
Revenue and Net Income Forecast of Crun, 2012-2016(RMB mln)
2012年川润股份主营业收入产品结构
2012年川润股份主营业务区域构成
2011-2012年川润股份主要产品产量及销量
Main Waste Heat Boiler of CRUN
2008-2013年川润股份综合及各主要产品毛利率
2010-2012年川润股份前五名客户销售金额及占比(百万元)
2012年川润股份前五名客户销售额及占比
2010-2012年川润股份前五名供应商采购额及占比(百万元)
2012年川润股份前五名供应商采购额及占比
2011-2012年川润股份研发支出(元)
2008-2013年华光股份收入与净利润(百万元)
Revenue and Net Income Forecast of Huaguang, 2012-2016(RMB mln)
2012年华光股份收入产品构成(百万元)
2012年华光股份营业收入区域构成(百万元)
Main Waste Heat Boiler Project of Huaguang Boiler
2012年华光股份产品订单分析(RMB mln)
2008-2013年华光股份综合及各主要产品毛利率
Revenue and Net Income of Kaishan,2009-2013(RMB mln)
Revenue and Net Income Forecast of Kaishan, 2011-2016(RMB mln)
Main Business Revenue Structure of Kaishan by Product, 2012 (RMB mln)
Main Business Revenue Structure of Kaishan by Region, 2012 (RMB mln)
开山蒸汽用ORC螺杆膨胀发电站标准型号(50赫兹)
2008-2013年开山股份综合及各主要产品毛利率
2011-2012年开山股份成本构成
2010-2012年开山股份研发支出
2010-2012年开山股份前五名客户销售金额及占比(百万元)
2010-2012年开山股份前五名供应商采购额及占比(百万元)
2010-2014年财年荏原收入与净利润(JPY mln)
Main Business Revenue Structure of Ebara by Product, FY2013 (JPY mln)
Main Business Revenue Structure of Ebara by Region, FY2013 (JPY bln)
Yantai Ebara主要热泵产品信息
Revenue and Net Income of Hanbell,2009-2013(RMB mln)
Revenue and Net Income Forecast of Hanbell, 2011-2016(RMB mln)
Main Business Revenue Structure of Hanbell by Product, 2012 (RMB mln)
Main Business Revenue Structure of Hanbell by Region, 2012 (RMB mln)
2008-2013年汉钟精机综合及各主要产品毛利率
2010-2012年汉钟精机研发支出(元)
2011-2012年汉钟精机成本构成
2010-2012年川润股份前五名客户销售金额及占比(百万元)
2010-2012年汉钟精机前五名供应商采购额及占比(百万元)
江西华电螺杆膨胀动力机主机
江西华电主要产品系列
江西华电部分工程案例
Distribution of Waste Heat Resources
Features of Waste Heat Resources
Recycle of Waste Heat Resources’ Classified Utilization and Thermal Power Conversion Efficiency
Classification, Characteristics and Application of Waste Heat Utilization Equipments
Organic Working Medium Bicirculating Screw Expander Power Generation System
Budget of Return on Investment in Heat Waste Power Generation in the Cement Industry
YoY Growth Rate of China’s GDP, 1999-2013
YoY Growth Rate for Industrial Added Value of Chinese Enterprises Above Designated Scale, 2007-2013
YOY Growth Rate of Fixed Asset Investments, 2000- 2013
Penetration Rate of Waste Heat Power Generation in High Energy-Consuming Industries and Future Development Target
Policies and Contents Regarding Waste Heat Reclamation and Utilization, 2010-Aug.2013
Output of Waste Heat Boilers in China and Output Change, 2007-2012 (set)
Output of Waste Heat Boilers in China and Output Change, 2007-2012 (steam tons)
Output of Waste Heat Boilers in China and Output Change, 2011-2015E (sets, steam tons)
Market Pattern of Waste Heat Boilers in China, 2011 (set)
Market Pattern of Waste Heat Boilers in China, 2011 (steam tons)
Output of Waste Heat Boilers of All Varieties and Major Manufacturers in China, 2011
Sintering Machine Cogeneration, 2010 vs.2015E
BF Ironmaking Top Pressure Power Generation, 2010 vs.2015E
Coal Gas Optimal Utilization Power Generation, 2010 vs.2015E
Dry Quenching Waste Heat Power Generation, 2010 vs.2015E
Waste Heat Installed Power Generation Capacity in China Cement Industry, 12th Five-Year Plan Period (2011-2015E)
China Lithium Bromide Market Capacity & Change, 2008-2012
China Lithium Bromide Market Capacity & Change, 2011-2015
Market Share of Major Lithium Bromide Refrigerator Manufacturers in China, 2010-2013
Key Drives to the Promotion of Screw Expanders
Major Screw Expander Manufacturers in China
Revenue and Net Income of Suzhou Hailu Heavy Industry, 2008-2013
Revenue and Net Income Forecast of Suzhou Hailu Heavy Industry, 2012-2016E
Operating Revenue of Suzhou Hailu Heavy Industry by Product, 2012
Revenue Structure of Suzhou Hailu Heavy Industry by Region, 2012
Gross Margin of Suzhou Hailu Heavy Industry by Product, 2008-2013
Main Waste Heat Boilers of Suzhou Hailu Heavy Industry
R&D Expenditure of Suzhou Hailu Heavy Industry, 2011-2012
Suzhou Hailu Heavy Industry’s Revenue from Top 5 Clients and % of Total Revenue, 2010-2012
Suzhou Hailu Heavy Industry’s Procurement from Top 5 Suppliers and % of Total Procurement, 2010-2012
Operating Revenue and Profit of Hangzhou Boiler Group, 2008-2013
Revenue and Net Income of Hangzhou Boiler Group, 2012-2016E
Revenue Structure of Hangzhou Boiler Group by Product, 2012
Revenue Structure of Hangzhou Boiler Group by Region, 2012
Gross Margin of Hangzhou Boiler Group by Product, 2008-2013
Main Waste Heat BoilerS of Hangzhou Boiler Group
Backlog Orders of Hangzhou Boiler Group, End-2012
Hangzhou Boiler Group’s Revenue from Top 5 Clients and % of Total Revenue, 2010-2012
Hangzhou Boiler Group’s Revenue from Top 5 Clients and % of Total Revenue, 2012
Hangzhou Boiler Group’s Procurement from Top 5 Suppliers and % of Total Procurement, 2010-2012
Hangzhou Boiler Group’s Procurement from Top 5 Suppliers and % of Total Procurement, 2012
Revenue and Net Income of Shuangliang Group, 2008-2012
Revenue and Net Income of Shuangliang Group, 2012-2016E
Operating Revenue Structure of Shuangliang Group by Product, 2012
Revenue Structure of Shuangliang Group by Region, 2012
Gross Margin of Shuangliang Group by Product, 2008-2013
Main Waste Heat Boilers of Shuangliang Group
Main Absorption Heat Pumps of Shuangliang Group
Shuangliang Group s’ Revenue from Top 5 Clients and % of Total Revenue, 2010-2012
Shuangliang Group’ Procurement from Top 5 Suppliers and % of Total Procurement, 2010-2012
Main Waste Heat Boilers of Taihu Boiler
Revenue and Profit of Sichuan Crun, 2008-2013
Revenue and Net Income of Sichuan Crun, 2012-2016E
Operating Revenue Structure of Sichuan Crun by Product, 2012
Primary Business Structure of Sichuan Crun by Region, 2012
Output and Sales Volume of Major Products of Sichuan Crun, 2011-2012
Main Waste Heat Boilers of Sichuan Crun
Gross Margin of Sichuan Crun by Product, 2008-2013
Sichuan Crun’s Revenue from Top 5 Clients and % of Total Revenue, 2010-2012
Sichuan Crun’s Revenue from Top 5 Clients and % of Total Revenue, 2012
Sichuan Crun’s Procurement from Top 5 Suppliers and % of Total Procurement, 2010-2012
Sichuan Crun’s Procurement from Top 5 Suppliers and % of Total Procurement, 2012
R&D Expenditure of Sichuan Crun, 2011-2012
Revenue and Net Income of Wuxi Huaguang Boiler, 2008-2013
Revenue and Net Income of Wuxi Huaguang Bolier, 2012-2016E
Revenue Breakdown of Wuxi Huaguang Boiler by Product, 2012
Revenue Breakdown of Wuxi Huaguang Boiler by Region, 2012
Main Waste Heat Boiler Projects of Wuxi Huaguang Boiler
Orders of Wuxi Huaguang Boiler, 2012
Gross Margin of Wuxi Huaguang Boiler by Product, 2008-2013
Revenue and Net Income of Kaishan, 2009-2013
Revenue and Net Income of Kaishan, 2011-2016E
Operating Revenue Structure of Kaishan by Product, 2012
Operating Revenue Structure of Kaishan by Region, 2012
Standard Model of ORC Screw Expander Power Station for Kaishan (50 Hertz)
Gross Margin of Kaishan by Product, 2008-2013
Cost Structure of Kaishan, 2011-2012
R&D Expenditure of Kaishan, 2010-2012
Kaishan’s Revenue from Top 5 Clients and % of Total Revenue, 2010-2012
Kaishan’s Procurement from Top 5 Suppliers and % of Total Procurement, 2010-2012
Revenue and Net Income of EBARA, FY2010-FY2014
Operating Revenue Structure of Ebara by Product, FY2013
Operating Revenue Structure of Ebara by Region, FY2013
Major Heat Pumps of Yantai Ebara
Revenue and Net Income of Hanbell, 2009-2013
Revenue and Net Income of Hanbell, 2011-2016E
Operating Revenue Structure of Hanbell by Product, 2012
Operating Revenue Structure of Hanbell by Region, 2012
Gross Margin of Shanghai Hanbell Precise Machinery by Product, 2008-2013
R&D Expenditure of Shanghai Hanbell Precise Machinery, 2010-2012
Cost Structure of Shanghai Hanbell Precise Machinery, 2011-2012
Hanbell’s Revenue from Top 5 Clients and % of Total Revenue, 2010-2012
Hanbell’s Procurement from Top 5 Suppliers and % of Total Procurement, 2010-2012
Screw Expander Engines Made by Jiangxi Huadian Electric Power
Main Product Series of Jiangxi Huadian Electric Power
Project Cases of Jiangxi Huadian Electric Power
如果这份报告不能满足您的要求,我们还可以为您定制报告,请 留言说明您的详细需求。
|