|
|
|
报告导航:研究报告—
金融与服务业—零售与日用
|
|
2013-2016年中国化妆品市场研究报告 |
 |
字数:5.7万 |
页数:158 |
图表数:136 |
|
中文电子版:8500元 |
中文纸版:4250元 |
中文(电子+纸)版:9000元 |
|
英文电子版:2250美元 |
英文纸版:2350美元 |
英文(电子+纸)版:2550美元 |
|
编号:CYH020
|
发布日期:2013-09 |
附件:下载 |
 |
|
|
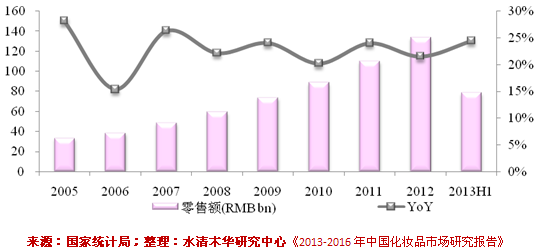
受全球经济复苏及中国经济增长放缓等影响,2012年中国化妆品行业增速有所变缓,全年规模以上企业零售总额达1340.1亿元,同比增长21.5%。目前,外资品牌仍占据中国化妆品市场主导地位。巴黎欧莱雅、玉兰油及玫琳凯分别是中国化妆品消费的前三大品牌,其合计零售额占中国化妆品市场零售总额的12.45%。 图:2005-2013年中国化妆品零售额及同比增速
护肤品是中国化妆品细分市场第一大类产品。2012年,中国护肤品市场规模达804.8亿元人民币,同比增长9.9%;面霜及抗衰老产品为护肤品占比最高的两大类产品,合计占中国护肤品市场销售额的60%以上。中国彩妆市场虽然起步较晚,但发展增速明显,2012年实现销售总额达234亿元,同比增幅达20%左右。 而男士化妆品、婴童化妆品等新兴细分市场销售额占中国化妆品市场销售额的比例仍不高,2012年,中国男士化妆品销售额占中国化妆品销售额不足5%;而婴童护理占比仅5.3%,但增速较快。 《2013-2016年中国化妆品市场研究报告》在分析中国化妆品市场规模、进出口、企业与品牌竞争格局、渠道发展、细分市场(如护肤品、彩妆等)的基础上,对4家跨国企业及中国16家主要化妆品企业经营情况、化妆品业务发展情况进行重点分析。 欧莱雅是目前全球最大的化妆品企业,公司自1997年进入中国,在华业务一直稳定增长,至2012年底,公司在中国上市运营品牌达到20个,包含巴黎欧莱雅、美宝莲等国际知名品牌,全年在华实现销售额达120.5亿元,同比增长12.4%。 上海家化是中国本土主要化妆品企业,旗下运营的知名品牌有六神、佰草集、美加净等。2013年,公司清理了清妃、可采、露美、珂珂4个老品牌,同时全新推出了启初、恒妍、茶颜三个新品,实现从中端到高端,从女士/男士到婴童,从百货、商超、大流通到化妆品专营店、网络渠道及母婴店等全面的战略布局。
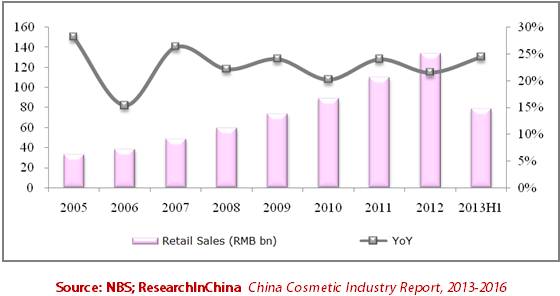
Impacted by global economic recovery as well as China’s economic growth
slowdown, the growth of China cosmetic industry hit a downturn, with the
gross retail sales of industrial players above designated scale
increasing by 21.5% year-on-year to RMB134.01 billion. At present,
foreign brands are still the mainstream in China cosmetic market, with
the top three ones coming to LOREAL PARIS, OLAY and Mary Kay which
collectively occupy 12.45% of retail sales. Retail Sales and YoY Growth in China Cosmetic Market, 2005-2013
Skin
care product is the largest category in China cosmetic market, with the
market scale in 2012 hitting RMB 80.48 billion, up 9.9% year-on-year;
among skin care products, cream and anti-aging products occupy a lion’s
share, with the sales standing at above 60% collectively in China skin
care product market. As to China’s makeup market, it started late but
has developed rapidly, with the sales in 2012 grossing RMB23.4 billion, a
year-on-year rise of around 20%. By contrast, the sales of
emerging market segments, such as men’s cosmetics and children’s and
infants’ cosmetics, still occupy a relatively small share in China
cosmetic market by sales. In 2012, China’s sales of men’s cosmetics
stood at less than 5%, while that of children’s and infants’ skin care
products accounted for no more than 5.3%, but the growth was fast. The
report analyzes the scale, import & export, brand and enterprise
competition pattern, channel development, market segments (such as
skincare products, makeup, etc.) of China cosmetic market, and
highlights the operation and cosmetic business performance of four
multinational companies and 16 domestic enterprises. L’Oréal is
currently the world’s largest cosmetic enterprise. Since its marching
into the Chinese market in 1997, L’Oréal has maintained stable business
growth in this emerging country. As of late 2012, the company had 20
brands in operation in China, including LOREAL PARIS, Maybelline and
other world-renowned ones, with the sales in China growing by 12.4%
year-on-year to RMB12.05 billion. Shanghai Jahwa United Co.,
Ltd. is a leading homegrown cosmetic enterprise with famous brands
including Liushen, Herborist and Maxam. In 2013, the company eliminated
four old brands, i.e. Chinfie, Cortry, Ruby and Cocool, and launched
three new ones including Giving, Soft Sense and Tea Beauty, a move to
realize its all-around strategic layout from middle range to high end,
from men/women to infants and children, from department stores,
supermarkets and massive circulation to franchise cosmetic stores,
network channel and maternal and infant stores.
1. 概述
1.1 定义
1.2 分类
2. 中国化妆品市场发展
2.1 供给
2.2 需求
2.3 进出口
2.3.1 出口
2.3.2 进口
2.4 地区结构
2.5 竞争格局
2.5.1 企业格局
2.5.2 品牌格局
2.5.3 外资在华发展
2.6 关税及政策
2.7 发展趋势
3. 化妆品市场渠道分析
3.1 百货专柜
3.1.2 百货专柜渠道特点
3.1.2 百货渠道操作模式
3.1.3 百货渠道发展趋势
3.2 超市
3.2.1 发展现状
3.2.2发展趋势
3.3 专营店
3.3.1 发展现状
3.3.2 渠道拓展方式
3.3.3 发展趋势
3.4 电商
3.4.1 市场规模
3.4.2 电商格局
3.4.3 主要电商
3.5 其他渠道
3.5.1 直销
3.5.2 药店
4. 化妆品细分市场
4.1 护肤品
4.1.1 市场规模
4.1.2 市场结构
4.1.3 竞争格局
4.1.4 大众护肤品
4.2 彩妆类
4.2.1 市场现状
4.2.2 品牌格局
4.2.3 跨国企业彩妆品牌发展动态
4.2.4 中国本土彩妆品牌发展动态
4.3 香水
4.3.1 消费现状
4.3.2 竞争格局
4.3.3 进出口
4.3.4 渠道发展
5. 其他新兴细分市场
5.1 男士化妆品
5.1.1 市场规模
5.1.2 市场结构
5.1.3 竞争格局
5.1.4 渠道
5.1.5 市场特点
5.2 药妆
5.2.1 市场现状
5.2.2 市场结构
5.2.3 主要企业
5.2.4 渠道发展
5.3 婴童护理用品
5.3.1 发展现状
5.3.2 行业格局
5.3.3 渠道
6. 全球主要化妆品企业
6.1 欧莱雅
6.1.1 企业简介
6.1.2 经营情况
6.1.3 营收构成
6.1.4 研发
6.1.5 化妆品业务
6.1.6 在华发展
6.2 雅诗兰黛
6.2.1 企业简介
6.2.2 经营情况
6.2.3 营收构成
6.2.4 研发
6.2.5 销售渠道
6.2.6 在华发展
6.3 宝洁
6.3.1 企业简介
6.3.2 经营情况
6.3.3 营收构成
6.3.4 毛利率
6.3.5 研发
6.3.6 化妆品业务
6.3.7 渠道
6.3.8 在华发展
6.4 资生堂
6.4.1 企业简介
6.4.2 经营情况
6.4.3 营收构成
6.4.4 渠道
6.4.5 研发
6.4.6 化妆品业务
6.4.7 在华发展
7. 中国主要化妆品企业
7.1 上海家化联合股份有限公司(600315)
7.1.1 企业简介
7.1.2 经营情况
7.1.3 营收构成
7.1.4 毛利率
7.1.5 渠道
7.1.6 分品牌分析
7.1.7 发展前景
7.2 江苏隆力奇集团有限公司
7.2.1 企业简介
7.2.2 经营情况
7.3 上海相宜本草化妆品股份有限公司
7.3.1 企业简介
7.3.2 经营情况
7.3.3 营收构成
7.3.4 毛利率
7.3.5 渠道
7.3.6 产销量
7.3.7 投资
7.4 伽蓝集团股份有限公司
7.4.1 企业简介
7.4.2 渠道
7.5 浙江欧诗漫集团有限公司
7.5.1 企业简介
7.5.2 经营情况
7.5.3 渠道建设
7.5.4 旗下品牌
7.6 珀莱雅化妆品股份有限公司
7.7 天津郁美净集团有限公司
7.8 上海华银日用品有限公司
7.9 索芙特股份有限公司(000662)
7.9.1 企业简介
7.9.2 经营情况
7.9.3 营收构成
7.9.4 毛利率
7.9.5 发展动态
7.10 霸王国际(集团)控股有限公司
7.10.1 企业简介
7.10.2 经营情况
7.10.3 营收构成
7.10.4 品牌
7.10.5 渠道
7.10.6 发展前景
7.11 广州环亚化妆品科技有限公司
7.12 北京大宝化妆品有限公司
7.13 广东丸美生物技术股份有限公司
7.14 高丝化妆品有限公司
7.15 珈侬生化科技(中国)有限公司
7.16 妮维雅(上海)有限公司
1. Overview
1.1 Definition
1.2 Classification
2. Development of China Cosmetic Market
2.1 Supply
2.2 Demand
2.3 Import & Export
2.3.1 Export
2.3.2 Import
2.4 Regional Structure
2.5 Competition Pattern
2.5.1 Corporate Pattern
2.5.2 Brand Pattern
2.5.3 Development of Foreign Companies in China
2.6 Tariff & Policies
2.7 Development Trend
3. Cosmetic Market Channel
3.1 Department Stores
3.1.1 Features
3.1.2 Operation Mode
3.1.3 Development Trend
3.2 Supermarket
3.2.1 Status Quo
3.2.2 Development Trend
3.3 Franchise Stores
3.3.1 Status Quo
3.3.2 Ways of Channel Expansion
3.3.3 Development Trend
3.4 e-Business
3.4.1 Market Scale
3.4.2 Pattern of e-Business
3.4.3 Major e-Businesses
3.5 Other Channels
3.5.1 Direct Selling
3.5.2 Drugstore
4. Cosmetic Market Segments
4.1 Skin Care Products
4.1.1 Market Scale
4.1.2 Market Structure
4.1.3 Competition Pattern
4.1.4 Popular Skin Care Products
4.2 Makeup
4.2.1 Market Status
4.2.2 Brand Pattern
4.2.3 Development Dynamic of Makeup Brands of Multinational Companies
4.2.4 Development Dynamic of Makeup Brands of Local Enterprises
4.3 Perfume
4.3.1 Consumption
4.3.2 Competition
4.3.3 Import & Export
4.3.4 Channel Development
5. Other Emerging Market Segments
5.1 Men’s Cosmetics
5.1.1 Market Scale
5.1.2 Market Structure
5.1.3 Competition Pattern
5.1.4 Channel
5.1.5 Market Features
5.2 Cosmeceuticals
5.2.1 Market Status
5.2.2 Market Structure
5.2.3 Key Enterprises
5.2.4 Channel Development
5.3 Babycare Products
5.3.1 Development Status
5.3.2 Industry Structure
5.3.3 Channel
6. Key Cosmetic Enterprises Worldwide
6.1 L’Oréal
6.1.1 Profile
6.1.2 Operation
6.1.3 Revenue Structure
6.1.4 R&D
6.1.5 Cosmetic Business
6.1.6 Development in China
6.2 The Estée Lauder Companies Inc.
6.2.1 Profile
6.2.2 Operation
6.2.3 Revenue Structure
6.2.4 R&D
6.2.5 Marketing Channel
6.2.6 Development in China
6.3 Procter & Gamble (P&G)
6.3.1 Profile
6.3.2 Operation
6.3.3 Revenue Structure
6.3.4 Gross Margin
6.3.5 R&D
6.3.6 Cosmetic Business
6.3.7 Channel
6.3.8 Development in China
6.4 Shiseido Company, Limited
6.4.1 Profile
6.4.2 Operation
6.4.3 Revenue Structure
6.4.4 Channel
6.4.5 R&D
6.4.6 Cosmetic Business
6.4.7 Development in China
7. Main Cosmetic Enterprises in China
7.1 Shanghai Jahwa United Co., Ltd. (600315)
7.1.1 Profile
7.1.2 Operation
7.1.3 Revenue Structure
7.1.4 Gross Margin
7.1.5 Channel
7.1.6 Brand
7.1.7 Development Prospect
7.2 Jiangsu LONGLIQI Bio-Science Co., Ltd. (Longrich)
7.2.1 Profile
7.2.2 Operation
7.3 Shanghai Inoherb Cosmetics Co., Ltd.
7.3.1 Profile
7.3.2 Operation
7.3.3 Revenue Structure
7.3.4 Gross Margin
7.3.5 Channel
7.3.6 Output & Sales Volume
7.3.7 Investment
7.4 JALA Corporation
7.4.1 Profile
7.4.2 Channel
7.5 Zhejiang Osmun Group
7.5.1 Profile
7.5.2 Operation
7.5.3 Channel Building
7.5.4 Brands
7.6 PROYA Company
7.7 Tianjin Yumeijing Group
7.8 Shanghai Huayin Commodity Co., Ltd.
7.9 Softto Co., Ltd. (000662)
7.9.1 Profile
7.9.2 Operation
7.9.3 Revenue Structure
7.9.4 Gross Margin
7.9.5 Development Dynamic
7.10 Bawang Group
7.10.1 Profile
7.10.2 Operation
7.10.3 Revenue Structure
7.10.4 Brand
7.10.5 Channel
7.10.6 Development Prospect
7.11 Guangzhou Huanya Cosmetics Technology Co., Ltd.
7.12 Beijing Dabao Cosmetics Co., Ltd.
7.13 Guangdong Marubi Biotechnology Co., Ltd.
7.14 Kose Cosmetics Co., Ltd. (China)
7.15 Ganon Biotech (China) Co., Ltd.
7.16 Nivea (Shanghai) Co., Ltd.
表:化妆品分类
图:2008-2012年中国化妆品规模以上企业工业总产值
图:2005-2013年中国化妆品零售额及同比增速
图:2006-2012年中国化妆品出口量及出口额
图:2006-2012年中国化妆品进口量及进口金额
图:中国化妆品消费零售额分地区占比
图:中国化妆品企业结构
表:2008-2012年中国日化市场集中度
表:2012年中国本土主要化妆品企业销售额及占比
图:2012年中国化妆品Top8品牌市场零售额及市场份额
表:化妆品跨国企业在华发展比较
表:2003-2013年国际企业并购中国本土化妆品品牌事记
表:2013年中国主要化妆品关税税率
表:2007-2013年中国化妆品相关政策
图:2011-2016年中国规模以上化妆品零售总额
表:中国化妆品各销售渠道情况比较
表:中国化妆品(分企业/分品牌)渠道分布
表:2010与2012年中国化妆品(分渠道)销售额占比
图:中国消费者购买化妆品选择渠道
表:化妆品百货渠道操作模式
表:中国主要化妆品专营店比较
表:2003-2013年跨国品牌渗透专营店渠道的阶段
图:2008-2016年中国化妆品网购市场交易规模
图:中国化妆品电商成本构成
图:中国消费者网上购买化妆品考虑因素占比
表:中国化妆品网络销售渠道分析
表:2011-2012年中国主要直销化妆品企业在中国销售收入(RMB bn)
图:2012年中国化妆品细分市场结构(按照零售额)
图:2009-2012年中国护肤品市场规模
图:中国护肤品(分产品)市场销售额占比
图:中国美白产品(分品类)占比
表:中国面膜市场(按价格)分类
表:2009-2012年中国面膜市场领先品牌
图:2009-2012年中国前十大护肤品市场集中度
表:2012年中国化妆品市场Top10护肤品品牌零售额及市场份额
图:中国化妆品市场(按价位)品牌分布(RMB)
表:大众护肤品代表品牌
图:2006-2012年中国彩妆市场规模
图:2013年中国消费者彩妆用途关注度
图:2013Q2中国彩妆(分品牌)关注度
图:2013Q2中国香水类化妆品品牌关注度
图:2008-2013年中国香水及花露水进口数量及金额
图:2008-2013年中国香水及花露水出口数量及金额
图:中国男士化妆品市场结构
图:2013Q2中国网民男士化妆品(分产品)关注度
表:中国男士化妆品品牌格局
图:2013Q2中国男士化妆品品牌关注度
图:男士产品渠道格局
图:2006-2013年中国药妆市场规模
图:2011年中国药妆(分领域)销售额占比
表:中国涉足药妆生产的企业及产品
表:儿童产品行业格局
图:儿童产品大众及高端占比
图:婴童化妆品渠道格局
图:2012年欧莱雅业务结构
图:2006-2013年欧莱雅营业收入与净利润
表:2010-2013年欧莱雅(分业务)营业收入及占比
表:2010-2012年欧莱雅(分地区)营业收入及占比
图:2012年欧莱雅(分币种)营业收入占比
表:2010-2012年欧莱雅专利数量
图:2008-2013年欧莱雅研发投入及占比
图:2009-2013年欧莱雅化妆品业务营业收入与营业利润
图:2010-2013年欧莱雅化妆品业务(分部门)营业收入及占比
图:2010-2012年欧莱雅化妆品(分业务)营业收入及占比
表:2010-2013年欧莱雅化妆品业务(分地区)营业收入及占比
图:2012年欧莱雅化妆品业务(分地区)产量占比
图:2007-2012年欧莱雅在中国营业收入
图:2006-2013财年雅诗兰黛净收入及营业利润
图:2007-2013财年雅诗兰黛(分产品)净收入及占比
图:2007-2013财年雅诗兰黛(分地区)营业收入
图:FY2010-FY2013年雅诗兰黛研发投入及占比
表:雅诗兰黛在华发展
图:2008-2013财年宝洁净收入及净利润
图:2011-2013财年宝洁(分业务)净收入及占比
图:2011-2013财年宝洁(分地区)净收入占比
图:2008-2013财年宝洁毛利率
图:2008-2013财年宝洁研发投入及占比
表:宝洁化妆品业务分类及品牌
图:2010-2013财年宝洁化妆品业务净收入及净收益
表:宝洁在中国品牌分布
图:2007-2013财年资生堂净收入及净利润
表:2010-2013财年资生堂(分产品)收入及占比
图:2008-2013财年资生堂(分地区)净收入
图:2008-2013财年资生堂海外收入及占比
图:资生堂在日本销售渠道分布
表:2013财年资生堂(分品牌)渠道分布
图:2008-2012财年资生堂研发投入及占比
图:资生堂(分国家)研发机构分布
图:资生堂化妆品业务分类
图:品牌SHISEIDO国家分布
图:2010-2012年资生堂在中国净收入
表:2013财年资生堂在中国的子公司
图:2008-2013年上海家化营业收入及净利润
表:2008-2013年上海家化(分行业)营业收入
表:2008-2013年上海家化(分地区)营业收入
图:2008-2013年上海家化(分行业)毛利率
表:上海家化(分品牌)定位及销售渠道
图:2010年上海家化分品牌销售收入占比
表:2010年上海家化(分品牌)销售收入及毛利率(百万元)
图:上海家化品牌
表:上海家化主要品牌价位
图:2001-2009年六神沐浴系列市场份额
图:2001-2009年美加净手部护理产品市场份额
图:佰草集品牌产品
表:2011-2016年上海家化营业收入与净利润
表:隆力奇旗下品牌
表:2002-2013年隆力奇发展概况
表:隆力奇全球科研中心
图:2007-2012年隆力奇主营业务收入
图:2009-2012年相宜本草营业收入与净利润
表:2009-2012年相宜本草(分产品)营业收入及占比
图:2009-2012年相宜本草(分地区)营业收入
表:相宜本草(分产品)毛利率
图:2011年相宜本草(分渠道)收入占比
表:相宜本草产品渠道模式及销售终端
表:2009-2011年相宜本草产品(分工厂)生产产能
表:2009-2011年相宜本草(分产品)产销量
表:伽蓝集团生产基地
图:2010-2012年欧诗漫销售额
图:2007-2012郁美净集团营业收入
图:2007-2009年上海华银主营业务收入
图:2008-2013年索芙特营业收入及净利润
表:2008-2013年索芙特(分产品)营业收入
图:2008-2013年索芙特(分地区)营业收入
表:2008-2013年索芙特(分产品)毛利率
图:2008-2013年霸王营业收入及净利润
表:2010-2013年霸王(分产品)营业收入及占比
表:2011-2012年霸王(分地区)收入及占比
表:霸王品牌分布
表:2010-2013年霸王(分品牌)营业收入与占比
表:截止2013年6月霸王集团(分品牌)渠道分布
图:霸王集团发展目标
图:2008-2009年广州环亚主营业务收入
表:2013年4月广东丸美生物科技股份有限公司核查范围内企业及募投项目概况
表:高丝化妆品(分渠道)品牌分布
图:2007-2010高丝化妆品有限公司主营业务收入
Classification of Cosmetics
Gross Industrial Output Value of Chinese Enterprises Above Designated Scale, 2008-2012
Retail Sales and YoY Growth in China Cosmetic Industry, 2005-2013
Export Volume/Value in China Cosmetic Industry, 2006-2012
Import Volume/Value in China Cosmetic Industry, 2006-2012
Retail Sales in China Cosmetic Industry
Structure of Chinese Cosmestic Enterprises
Concentration of China Daily-use Chemicals Market, 2008-2012
Sales and % of Leading Home-Grown Cosmetic Enterprises, 2012
Retail Sales and Market Share of Top 8 Brands in China Cosmetic Industry, 2012
Development of Transnational Cosmetic Enterprises in China
M&A Cases (International Enterprises’ Takeover of Home-Grown Cosmetic Brands), 2003-2013
Customs Duty Rates of Main Cosmetics in China, 2013
Policies Regarding Cosmetics in China, 2007-2013
Gross Retail Sales of Chinese Cosmetic Enterprises above Designated Scale, 2011-2016
China Cosmetic Market by Marketing Channel
Channel Distribution of Cosmestics in China by Enterprises/Brand
Sales of China Cosmetic Market by Channel, 2010/2012
Channels of Chinese Consumers to Purchase Cosmetics
Operation Model of Department Store as a Sales Channel for Cosmetics
Major Cosmetic Franchise Stores in China
Stages of Multinational Brands Penetrating Franchise Stores, 2003-2013
Transaction Scale of China Cosmetic Online Shopping Market, 2008-2016
Cost Structure of Cosmetic e-Businesse in China
Considerations for Chinese Consumers to Purchase Cosmestics Online
Network Sales Channels of Cosmetics in China
Sales of China’s Major Cosmetic Direct-Selling Enterprises in China, 2011-2012
China Cosmestic Market Structure by Retail Sales, 2012
Market Scale of Skin Care Products in China, 2009-2012
Sales Structure of China Skin Care Product Market by Product
Percentage of Skin Whitening Products in China by Category
Classification of China Mask Market by Price
Leading Brands in China Facial Mask Market, 2009-2012
Market Concentration of Top 10 Skin Care Products in China, 2009-2012
Retail Sales and Market Share of Top 10 Skin Care Brands in China Cosmetic Market, 2012
Brand Distribution in China Cosmetic Market by Pricing
Representative Brands of Popular Skin Care Products
China Makeup Market Scale, 2006-2012
Makeup Function Awareness for Chinese Consumers, 2013
Makeup Awareness by Brand in China, 2013Q2
Brand Awareness of Perfume Cosmetics in China, 2013Q2
Import Volume/Value of Perfume and Floral Water in China, 2008-2013
Export Volume/Value of Perfume and Floral Water in China, 2008-2013
Market Structure of Men’s Cosmetics in China
Awareness of Men’s Cosmetics Among Chinese Netizens by Product, 2013Q2
Brand Pattern of Men’s Cosmetics in China
Brand Awareness of Men’s Cosmetics in China, 2013Q2
Channel Structure of Men’s Products
China Cosmeceutical Market Scale, 2006-2013
China Cosmeceutical Sales Structure by Sector, 2011
Chinese Enterprises Involving in Cosmeceuticals Production and Their Products
Industry Structure of Children’s Products
Proportion of Popular/High-End Children’s Products
Channel Structure of Cosmetics for Children
Business Structure of L'Oréal, 2012
Revenue and Net Income of L'Oréal, 2006-2013
Revenue Breakdown and Percentage of L'Oréal by Business, 2010-2013
Revenue Breakdown and Percentage of L'Oréal by Region, 2010-2012
Revenue Structure of L'Oréal by Currency, 2012
Number of Patents of L'Oréal, 2010-2012
R&D Costs and % of Total Revenue of L'Oréal, 2008-2013
Revenue and Operating Profit from Cosmetic Business of L'Oréal, 2009-2013
Revenue and Percentage of Cosmetic Business of L'Oréal by Division, 2010-2013
Revenue and Percentage of Cosmetic Business of L'Oréal by Business, 2010-2012
Revenue and Percentage of Cosmetic Business of L'Oréal by Region, 2010-2013
Output Structure of Cosmetic Business of L'Oréal by Region, 2012
Revenue of L'Oréal in China, 2007-2012
Revenue and Operating Profit of Estée Lauder, FY2006-FY2013
Net Revenue Breakdown and Percentage of Estée Lauder by Product, FY2007-FY2013
Revenue of Estée Lauder by Region, FY2007-FY2013
R&D Costs and % of Total Revenue of Estée Lauder, FY2010-FY2013
Development of Estée Lauder in China
Net Revenue and Net Income of P&G, FY2008-FY2013
Net Revenue Breakdown and Percentage of P&G by Business, FY2011-FY2013
Net Revenue Structure of P&G by Region, FY2011-FY2013
Gross Margin of P&G, FY2008-FY2013
R&D Costs and % of Total Revenue of P&G, FY2008-FY2013
Classification and Brands of Cosmetic Business of P&G
Net Revenue and Net Income of P&G from Cosmetic Business, FY2010-FY2013
Brand Distribution of P&G in China
Net Revenue and Net Income of SHISEIDO, FY2007-FY2013
Revenue Breakdown and Percentage of SHISEIDO by Product, FY2010-FY2013
Net Revenue of SHISEIDO by Region, FY2008-FY2013
Overseas Revenue and Percentage of SHISEIDO, FY2008-FY2013
Marketing Channel of SHISEIDO in Japan
Channel Distribution of SHISEIDO by Brand, FY2013
R&D Costs and % of Total Revenue of SHISEIDO, FY2008-FY2012
R&D Bases of SHISEIDO by Country
Cosmetic Business Segments of SHISEIDO
Distribution of SHISEIDO by Country
Net Revenue of SHISEIDO in China, 2010-2012
Subsidarires of SHISEIDO in China, FY2013
Revenue and Net Income of Shanghai Jahwa United, 2008-2013
Revenue of Shanghai Jahwa United by Sector, 2008-2013
Revenue of Shanghai Jahwa United by Region, 2008-2013
Gross Margin of Shanghai Jahwa United by Sector, 2008-2013
Positioning and Marketing Channel of Shanghai Jahwa United by Brand
Sales of Shanghai Jahwa United by Brand, 2010
Sales and Gross Margin of Shanghai Jahwa United by Brand, 2010
Brands under Shanghai Jahwa United
Pricing of Major Brands under Shanghai Jahwa United
Market Share of Liushen Bath Series, 2001-2009
Market Share of Hand Care Products of Maxam, 2001-2009
Products under the Brand of Herborist
Revenue and Net Income of Shanghai Jahwa United, 2011-2016
Brands under Longliqi
Development of Longliqi, 2002-2013
Worldwide R&D Bases of Longliqi
Operating Revenue of Longliqi, 2007-2012
Revenue and Net Income of Shanghai Inoherb Cosmetics, 2009-2012
Revenue Breakdown and Percentage of Shanghai Inoherb Cosmetics by Product, 2009-2012
Revenue of Shanghai Inoherb Cosmetics by Region, 2009-2012
Gross Margin of Shanghai Inoherb Cosmetics by Product
Revenue Structure of Shanghai Inoherb Cosmetics by Channel, 2011
Channel Models and Sales Terminals of Shanghai Inoherb Cosmetics’s Products
Production Capacity of Shanghai Inoherb Cosmetics by Plant, 2009-2011
Output and Sales Volume of Shanghai Inoherb Cosmetics by Product, 2009-2011
Production Bases of JALA Corporation
Sales of Zhejiang Osmun Group, 2010-2012
Revenue of Tianjin Yumeijing Group, 2007-2012
Operating Revenue of Shanghai Huayin Commodity, 2007-2009
Revenue and Net Income of Softto, 2008-2013
Revenue of Softto by Product, 2008-2013
Revenue of Softto by Region, 2008-2013
Gross Margin of Softto by Product, 2008-2013
Revenue and Net Income of Bawang Group, 2008-2013
Revenue Breakdown and Percentage of Bawang Group by Product, 2010-2013
Revenue Breakdown and Percentage of Bawang Group by Region, 2011-2012
Distribution of Bawang Group by Brand
Revenue Breakdown and Percentage of Bawang Group by Brand, 2010-2013
Channel Distribution of Bawang Group by Brand, as of Jun.2013
Development Target of Bawang Group
Operating Revenue of Guangzhou Huanya Cosmetics Technology, 2008-2009
Fundraising and Investment Projects of Marubi, Apr.2013
Brand Distribution of Kose Cosmetics by Channel
Operating Revenue of Kose Cosmetics, 2007-2010
如果这份报告不能满足您的要求,我们还可以为您定制报告,请 留言说明您的详细需求。
|