|
|
|
报告导航:研究报告—
农业与食品—农业
|
|
2013-2015年中国食用植物油行业研究报告 |
 |
字数:3.9万 |
页数:103 |
图表数:140 |
|
中文电子版:8000元 |
中文纸版:4000元 |
中文(电子+纸)版:8500元 |
|
英文电子版:2200美元 |
英文纸版:2300美元 |
英文(电子+纸)版:2500美元 |
|
编号:QJC003
|
发布日期:2013-09 |
附件:下载 |
 |
|
|
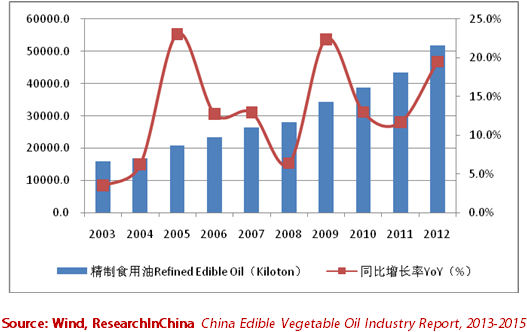
2003-2012年期间,中国精制食用植物油产量保持增长态势。2012年,食用植物油产量达5176.18万吨,较2011年提高19.5%,是2003年产量的3.4倍。其中,豆油占总产量的52.2%;菜籽油和花生油分别占21.8%和10.6%;玉米油、茶油等小品种油发展也相对较快。 图:2003-2012年中国精制食用植物油产量及增速
中国是全球最重要的油籽和植物油进口国之一。2012年,中国进口植物油960万吨,进口油籽6228.0万吨,均创历史新高。大豆是主要进口油籽,2012年占总进口油籽的93.7%;棕榈油是主要进口食用油,2012年占总进口植物油的66.1%。与此同时,菜籽油、橄榄油进口增速也较快,2012年进口量同比增速分别达210%和25.9%。 2012年,丰益国际实现营业收入454.6亿美元,其中46.7%来自中国市场。丰益国际旗下益海嘉里公司,是中国最大的粮油加工集团之一,豆油市场占有率在10%以上。益海嘉里旗下拥有“金龙鱼”、“元宝”、“胡姬花”等品牌,其中,“金龙鱼”系列食用油是中国油种最齐全的食用油品牌。 中粮集团在2012年的油料加工能力1106万吨/年,拥有“福临门”、“福掌柜”、“四海”、“喜盈盈”和“谷花”等品牌,豆油市场占有率近10%。中粮集团食用油业务主要集中于中国粮油与中国食品两家港交所上市公司,2013年上半年,中国粮油净利润同比下降3.4%,中国食品则亏损1.9亿港元。 与大宗油品的企业相比,中国玉米油生产企业经营状况较好。2012年,长寿花食品、西王食品两家公司毛利率分别为19.9%、21.8%,远高于食用油行业8%水平。 《2013-2015年中国食用植物油行业研究报告》的内容主要包括以下几方面:- 中国食用植物油行业的政策环境、行业标准、发展规划等;
- 中国食用植物油行业发展现状、市场供需、进出口贸易、价格走势等;
- 中国豆油、花生油、菜籽油、玉米油、橄榄油等细分品种的发展现状、市场供需、进出口贸易、价格走势等;
- 中国16家主要食用油加工企业经营现状、投资并购、业务分析及发展预测等。
In 2003-2012, China’s refined edible vegetable oil production maintained
an upward trend, reaching 51.7618 million tons in 2012, an increase of
19.5% compared with 2011, 3.4 times of the output in 2003, of which,
soybean oil accounted for 52.2% of the total output; rapeseed oil and
peanut oil 21.8% and 10.6%, respectively; maize oil, Oil-tea camellia
seed oil and other small varieties of oil also witnessed relatively fast
development. Output and Growth Rate of Refined Edible Vegetable Oil in China, 2003-2012
As
one of the world's most important importers of oilseeds and vegetable
oil, China imported 9.6 million tons of vegetable oil and 62.28 million
tons of oilseeds in 2012, both setting a record high. As the main
imported oilseed, soybean accounted for 93.7% of the total imports of
oilseeds; as the major imported edible oil, palm oil occupied 66.1% of
the total imports of vegetable oil. At the same time, rapeseed oil and
olive oil imports also showed fast growth, respectively up 210% and
25.9% YoY. In 2012, Wilmar International reached revenue of
$45.46 billion, 46.7% of which came from the Chinese market. The
subsidiary Yihai Kerry serves as one of China’s largest grain and oil
processing groups, with soybean market share above 10%, covering
“Arowana”, “Ingot” “Orchid” and other brands, of which, “Arowana” is the
edible oil brand with the most complete oil varieties in China. In
2012, COFCO presented oil processing capacity of 11.06 million tons /
year, in possession of “Fulinmen”, “Fuzhanggui”, “Sihai”, “Xiyingying”,
“Guhua” and other brands, with soybean oil market share of nearly 10%.
Its edible oil business is mainly concentrated in China Agri-Industries
Holdings Limited and China Foods Limited listed on HKEx. In the first
half of 2013, China Agri-Industries Holdings Limited witnessed a
year-on-year decline of 3.4% in net income, and China Foods Limited
suffered a loss of 190 million Hong Kong dollars. Compared with
bulk oil companies, Chinese maize oil producers saw good operating
conditions. In 2012, gross margins of Changshouhua Food and Xiwang Food
reached 19.9% and 21.8%, respectively, well above the level of 8% of the
edible oil industry. China Edible Vegetable Oil Industry Report, 2013-2015 mainly covers the followings:  Policy environment, industrial standards, development planning, etc. for China's edible vegetable oil industry;
Development status, market supply and demand, import and export trade,
price trend, etc. of edible vegetable oil industry in China;
Development status, market supply and demand, import and export trade,
price trend, etc. of soybean oil, peanut oil, rapeseed oil, maize oil,
olive oil and other oil varieties in China; Operating
status, investment and mergers, business analysis, development
forecast, etc. of 16 major edible oil processing enterprises in China.
第一章 食用植物油行业概述
1.1 定义
1.2 分类
1.3 产业链
第二章 中国食用植物油行业政策环境
2.1产业规划
2.2 行业标准体系
2.3 油料生产补贴制度
2.4 国家储备制度
2.5 植物油企业增值税抵扣政策
2.6 鼓励外商投资
第三章 中国食用植物油供需情况
3.1 植物油生产
3.1.1 产量及增长率
3.1.2 地区结构
3.1.3 产品结构
3.2 国内需求分析
3.2.1 国内需求量
3.2.2 需求结构
3.3 植物油进出口分析
3.3.1 植物油进出口
3.3.2 油籽进出口
3.4 生产企业分析
3.4.1 企业数量
3.4.2 经营分析
第四章 中国食用植物油细分行业分析
4.1 豆油
4.1.1 简介
4.1.2 市场供需
4.1.3 竞争格局
4.1.4 价格走势
4.2 花生油
4.2.1 简介
4.2.2 市场供需
4.2.3 价格走势
4.3 菜籽油
4.3.1 简介
4.3.2 市场供需
4.3.3 价格走势
4.4 玉米油
4.4.1 简介
4.4.2 市场供需
4.4.3 价格走势
4.4.4 竞争格局
4.5 橄榄油
4.5.1 简介
4.5.2 市场供给
4.5.3 价格走势
4.6 棕榈油
4.6.1 简介
4.6.2 市场供给
4.6.3 市场需求
4.6.4 价格走势
4.7 茶油
4.7.1 简介
4.7.2 油茶籽生产
4.7.3 生产情况
4.7.4 市场需求
4.7.5 竞争格局
第五章 食用植物油主要企业
5.1 丰益国际
5.1.1 企业简介
5.1.2 经营情况
5.1.3 食用植物油业务
5.1.4 在华运营
5.2 中粮集团
5.2.1 企业简介
5.2.2 经营情况
5.2.3 中国食品有限公司
5.2.4 中国粮油控股有限公司
5.3 长寿花食品
5.3.1 企业简介
5.3.2 经营情况
5.3.3 营收构成
5.3.4 毛利率
5.3.5 预测与展望
5.4 西王食品
5.4.1 企业简介
5.4.2 经营情况
5.4.3 营收构成
5.4.4 毛利率
5.4.5 客户分析
5.4.6食用植物油业务
5.4.7 预测与展望
5.5 东凌粮油
5.5.1 企业简介
5.5.2 经营情况
5.5.3 营收构成
5.5.4 毛利率
5.5.5 客户分析
5.4.6食用植物油业务
5.5.7 预测与展望
5.6 加加食品
5.6.1 企业简介
5.6.2 经营情况
5.6.3 营收构成
5.6.4 毛利率
5.6.5客户分析
5.6.6食用植物油业务
5.6.7 预测与展望
5.7 金健米业
5.7.1 企业简介
5.7.2 经营情况
5.7.3 营收构成
5.7.4 毛利率
5.6.5客户分析
5.7.6 食用植物油业务
5.7.7 预测与展望
5.8 新赛股份
5.8.1 企业简介
5.8.2 经营情况
5.8.3 营收构成
5.8.4 毛利率
5.8.5客户分析
5.8.6食用植物油业务
5.9晨光生物
5.9.1 企业简介
5.9.2 经营情况
5.9.3 营收构成
5.9.4 毛利率
5.9.5客户分析
5.9.6食用植物油业务
5.9.7 预测与展望
5.10 湖南金浩
5.10.1 企业简介
5.10.2 经营情况
5.10.3 发展情况
5.11 汇福粮油
5.11.1 企业简介
5.11.2 经营情况
5.11.3 发展情况
5.12 中纺粮油
5.12.1 企业简介
5.12.2 发展情况
5.13 海狮油脂
5.13.1 企业简介
5.13.2 经营情况
5.13.3 发展情况
5.14 玉皇粮油
5.14.1 企业简介
5.14.2 经营情况
5.14.3 发展情况
5.15 天津聚龙集团
5.15.1 企业简介
5.15.2 经营情况
5.15.3 发展情况
5.16 上海佳格
5.16.1 企业简介
5.16.2 经营情况
5.16.3 发展情况
1. Overview of Edible Vegetable Oil Industry
1.1 Definition
1.2 Classification
1.3 Industry Chain
2. Policy Environment for China Edible Vegetable Oil Industry
2.1 Industrial Planning
2.2 Industrial Standard System
2.3 Subsidy System for Oil Production
2.4 National Reserve System
2.5 VAT Deduction Policy for Vegetable Oil Companies
2.6 Foreign Investment Incentives
3. China Edible Vegetable Oil Supply and Demand
3.1 Vegetable Oil Production
3.1.1 Output and Growth Rate
3.1.2 Regional Structure
3.1.3 Product Mix
3.2 Domestic Demand
3.2.1 Quantity Demanded
3.2.2 Demand Structure
3.3 Vegetable Oil Import and Export
3.3.1 Vegetable Oil Import and Export
3.3.2 Oilseeds Import and Export
3.4 Production Enterprises
3.4.1 Number of Enterprises
3.4.2 Operation
4. China Edible Vegetable Oil Industry Segments
4.1 Soybean Oil
4.1.1 Brief Introduction
4.1.2 Market Supply and Demand
4.1.3 Competition Pattern
4.1.4 Price Trend
4.2 Peanut Oil
4.2.1 Brief Introduction
4.2.2 Market Supply and Demand
4.2.3 Price Trend
4.3 Rapeseed Oil
4.3.1 Brief Introduction
4.3.2 Market Supply and Demand
4.3.3 Price Trend
4.4 Maize oil
4.4.1 Brief Introduction
4.4.2 Market Supply and Demand
4.4.3 Price Trend
4.4.4 Competition Pattern
4.5 Olive Oil
4.5.1 Brief Introduction
4.5.2 Market Supply
4.5.3 Price Trend
4.6 Palm Oil
4.6.1 Brief Introduction
4.6.2 Market Supply
4.6.3 Market Demand
4.6.4 Price Trend
4.7 Oil-tea camellia seed oil
4.7.1 Brief Introduction
4.7.2 Oil-tea Camellia Seed Production
4.7.3 Production
4.7.4 Market Demand
4.7.5 Competition Pattern
5. Key Companies
5.1 Wilmar International
5.1.1 Profile
5.1.2 Operation
5.1.3 Edible Vegetable Oil Business
5.1.4 Operations in China
5.2 COFCO
5.2.1 Profile
5.2.2 Operation
5.2.3 China Foods Limited
5.2.4 China Agri-Industries Holdings Limited
5.3 Changshouhua Food
5.3.1 Profile
5.3.2 Operation
5.3.3 Revenue Structure
5.3.4 Gross Margin
5.3.5 Prospect & Outlook
5.4 Xiwang Food
5.4.1 Profile
5.4.2 Operation
5.4.3 Revenue Structure
5.4.4 Gross Margin
5.4.5 Clients
5.4.6 Edible Vegetable Oil Business
5.4.7 Prospect & Outlook
5.5 Dongling Grain & Oil Co., Ltd.
5.5.1 Profile
5.5.2 Operation
5.5.3 Revenue Structure
5.5.4 Gross Margin
5.5.5 Clients
5.4.6 Edible Vegetable Oil Business
5.5.7 Prospect & Outlook
5.6 Jiajia Food
5.6.1 Profile
5.6.2 Operation
5.6.3 Revenue Structure
5.6.4 Gross Margin
5.6.5 Clients
5.6.6 Edible Vegetable Oil Business
5.6.7 Prospect & Outlook
5.7 Hunan Jinjian Cereals Industry Co.,LTD.
5.7.1 Profile
5.7.2 Operation
5.7.3 Revenue Structure
5.7.4 Gross Margin
5.6.5 Clients
5.7.6 Edible Vegetable Oil Business
5.7.7 Prospect & Outlook
5.8 Xinjiang Sayram Modern Agriculture Co., Ltd. (XINSAI)
5.8.1 Profile
5.8.2 Operation
5.8.3 Revenue Structure
5.8.4 Gross Margin
5.8.5 Clients
5.8.6 Edible Vegetable Oil Business
5.9 Chenguang Biotech Group
5.9.1 Profile
5.9.2 Operation
5.9.3 Revenue Structure
5.9.4 Gross Margin
5.9.5 Clients
5.9.6 Edible Vegetable Oil Business
5.9.7 Prospect & Outlook
5.10 Hunan Jinhao Camellia Oil Co., Ltd.
5.10.1 Profile
5.10.2 Operation
5.10.3 Development
5.11 Sanhe Hopefull Grain & Oil Group Co., Ltd.
5.11.1 Profile
5.11.2 Operation
5.11.3 Development
5.12 Chinatex Grains and Oils Imp. & Exp. Co., Ltd.
5.12.1 Profile
5.12.2 Development
5.13 Shanghai Liangyou Haishi Oils & Fats Industry Co., Ltd.
5.13.1 Profile
5.13.2 Operation
5.13.3 Development
5.14 Shandong Yuhuang Grain & Oil Food Co., Ltd.
5.14.1 Profile
5.14.2 Operation
5.14.3 Development
5.15 Tianjin Julong Group
5.15.1 Profile
5.15.2 Operation
5.15.3 Development
5.16 Shanghai Standard Foods Co., Ltd.
5.16.1 Profile
5.16.2 Operation
5.16.3 Development
表:中国主要食用植物油(按原料)种类及特点
图:中国食用植物油产业链
表:2007-2012年中国食用植物油主要行业政策
表:2011-2020年中国食用植物油行业发展规划
图:2011-2020年中国食用植物油加工业布局
表:中国食用植物油主要现行国家标准
图:2003-2012年中国精制食用植物油产量及增速
图:2012年中国精制食用植物油(分地区)产量分布
图:2012年中国精制食用植物油(分产品)产量结构
图:2004/05-2012/13年中国食用植物油需求量
图:2008/09-2012/13年中国食用植物油(分产品)需求结构
图:2006-2012年中国食用植物油进出口量
图:2006-2013年中国食用植物油(分产品)进口结构
图:2006-2012年中国油籽进出口量
图:2006-2013年中国油籽(分产品)进口结构
图:2006-2013年中国食用植物油加工企业数量(单位:家)
图:2006-2013年中国食用植物油加工企业营业收入及毛利率
图:2006-2012年中国食用植物油加工企业应收账款及负债
图:2003-2012年中国豆油产量
图:2006/07-2012/13年中国豆油国内需求量
图:2006-2013年中国豆油进口量及增长率
图:2006-2013年中国大豆进口量及增长率
图:2011年中国前10大豆压榨企业产能占比
图:2008-2013年中国桶装豆油零售价
图:2004-2012年中国花生油产量
图:2008-2012年中国花生油需求量
图:2008-2013年中国花生油进出口量
图:2006-2013年中国桶装花生油零售价
图:2003-2012年中国菜籽油产量及增长率
图:2007/08-2012/13年中国菜籽油需求量
图:2007-2012年中国菜籽油、油菜籽进口量
图:2009-2013年50个城市一级散装菜籽油平均价
图:2008-2012年中国玉米油产量及增长率
图:2007-2013年美国玉米油现货价格
图:2010-2012年中国主要地区玉米油出厂价
表:中国玉米油市场重点企业比较
表:橄榄油种类(按品质)、加工工艺及酸度
图:2007-2012年全球橄榄油产量
图:2008-2013年中国橄榄油进口量
图:2013年中国橄榄油进口来源地
图:2000-2013年全球橄榄油市场价格
图:2008-2013年中国橄榄油进口平均价格
图:2006-2012年中国棕榈油产量及进口量
图:2013年中国棕榈油进口来源地
图:2006/07-2012/13年度中国棕榈油需求量
图:2007-2013年中国棕榈油主力合约结算价
图:2004-2012年中国油茶籽产量
图:2011年中国油茶籽产量构成(分地区)
图:2009-2012年中国油茶产业产值
表:中国茶油加工企业类型
图:2010年中国茶油消费占比及发达国家橄榄油消费占比
图:2008-2013年丰益国际营业收入及净利润
表:丰益国际各营业部门产品及服务
图:2012年丰益国际各营业部门营业收入占比
图:2008-2012年丰益国际(分地区)营业收入
图:2012年丰益国际(分地区)营业收入占比
表:益海嘉里下属植物油企业及生产经营情况
表:益海嘉里食用植物油主要品牌
图:2006-2012年中粮集团总资产及利润总额
图:2010-2012年中粮集团综合加工能力
图:2012年中粮集团主要产品加工能力
表:中粮集团下属上市公司
图:2008-2013年中国食品营业收入及净利润
图:2008-2013年中国食品(分产品)营收占比
图:2008-2013年中国食品(分产品)营业收入
图:2008-2013年中国粮油营业收入及净利润
图:2008-2013年中国粮油(分产品)营入占比
表:2008-2013年中国粮油(分产品)营业收入
图:2008-2013年长寿花食品营业收入及净利润
图:2008-2013年长寿花食品(分产品)营业收入
图:2008-2013年长寿花食品(分产品)营收占比
图:2008-2012年长寿花食品(分地区)营业收入
图:2008-2012年长寿花食品(分地区)营业收入占比
图:2008-2013年长寿花食品毛利率
表:2008-2013年长寿花食品(分产品)毛利率
表:2011-2015年长寿花食品营业收入和净利润
图:2009-2013年西王食品营业收入及净利润
图:2009-2013年西王食品(分产品)营业收入
图:2009-2012年西王食品(分产品)营收占比
图:2009-2013年西王食品(分地区)营业收入
图:2009-2013年西王食品(分地区)营收占比
图:2010-2013年西王食品毛利率
图:2010-2013年西王食品主要产品毛利率
图:2010-2013年西王食品前五名客户营业收入及占比
表:2012年西王食品子公司经营分析
图:2008-2013年西王食品玉米油销量
表:2011-2015年西王食品营业收入和净利润
图:2008-2013年东凌粮油营业收入及净利润
图:2009-2013年东凌粮油(分产品)营业收入
图:2009-2013年东凌粮油(分产品)营收占比
图:2008-2013年东凌粮油(分地区)营业收入
图:2008-2013年东凌粮油(分地区)营收占比
图:2009-2013年东凌粮油(分产品)毛利率
图:2008-2013年东凌粮油前五名客户贡献收入及占比
图:2008-2013年东凌粮油大豆压榨量
表:2011-2015年东凌粮油营业收入和净利润
图:2008-2013年加加食品营业收入及净利润
图:2008-2013年加加食品(分产品)营业收入
图:2008-2013年加加食品(分产品)营收占比
图:2008-2013年加加食品(分地区)营业收入
图:2008-2012年加加食品(分地区)营收占比
图:2008-2013年加加食品(分产品)毛利率
图:2008-2013年加加食品前五名客户营业收入及占比
表:2013年加加食品食用油相关子公司营业收入与净利润
表:2011-2015年加加食品营业收入和净利润
图:2008-2013年金健米业营业收入及净利润
图:2008-2013年金健米业(分产品)营业收入
图:2008-2013年金健米业(分产品)营收占比
图:2008-2013年金健米业(分地区)营业收入
图:2008-2013年金健米业(分地区)营收占比
图:2008-2013年金健米业主要产品毛利率
图:2008-2013年金健米业前五名客户贡献收入及占比
表:2013年金健米业植物油相关子公司资产及营业收入
表:金健植物油下属油厂概况
表:2011-2015年金健米业营业收入和净利润
图:2008-2013年新赛股份营业收入及净利润
表:2008-2013年新赛股份(分产品)营业收入
图:2008-2013年新赛股份(分产品)营收占比
图:2008-2013年新赛股份(分地区)营业收入
图:2008-2013年新赛股份(分地区)营收占比
图:2008-2013年新赛股份综合毛利率及食用油毛利率
图:2008-2013年新赛股份前五名客户贡献收入及占比
图:2013年新赛股份植物油相关子公司经营范围
图:2009-2013年晨光生物营业收入及净利润
图:2011-2013年晨光生物(分产品)营业收入
图:2011-2013年晨光生物(分产品)营收占比
图:2009-2013年晨光生物(分地区)主营业务收入
图:2009-2013年晨光生物(分地区)主营业务收入占比
图:2010-2013年晨光生物综合毛利率及油脂毛利率
图:2009-2013年晨光生物业前五名客户贡献收入及占比
表:2013年晨光生物业植物油相关子公司营业收入及利润
表:2012年晨光生物植物油相关专利申请概况
表:2011-2015年晨光生物营业收入和净利润
表:2007-2009年湖南金浩财务指标
表:2007-2009年汇福粮油精炼植物油公司财务指标
表:中纺粮油下属植物油企业及生产经营情况
表:2007-2009年海狮油脂财务指标
表:2007-2009年玉皇粮油财务指标
表:2007-2009年龙威粮油、聚龙粮油财务指标
表:2007-2009年上海佳格财务指标
Main Types and Characteristics of Edible Vegetable Oil in China (by Raw Materials)
China's Edible Vegetable Oil Industry Chain
Major Industrial Policies for Edible Vegetable Oil in China, 2007-2012
Development Planning for China’s Edible Vegetable Oil Industry, 2011-2020
China’s Edible Vegetable Oil Industry Layout, 2011-2020
Current Major National Standards for Edible Vegetable Oil in China
Output and Growth Rate of Refined Edible Vegetable Oil in China, 2003-2012
Output Breakdown of Refined Edible Vegetable Oil (by Region) in China, 2012
Output Structure of Refined Edible Vegetable Oil (by Product) in China, 2012
China’s Demand for Edible Vegetable Oil, 2004/05-2012/13
China’s Edible Vegetable Oil Demand Structure (by Product), 2008/09-2012/13
China’s Edible Vegetable Oil Import and Export Volume, 2006-2012
China’s Edible Vegetable Oil Import Structure (by Product), 2006-2013
China’s Oilseeds Import and Export Volume, 2006-2012
China’s Oilseeds Import Structure (by Product), 2006-2013
Number of Edible Vegetable Oil Processing Enterprises in China, 2006-2013
Revenue and Gross Margin of Edible Vegetable Oil Processing Enterprises in China, 2006-2013
Receivables and Liabilities of Edible Vegetable Oil Processing Enterprises in China, 2006-2012
Output of Soybean Oil in China, 2003-2012
China’s Domestic Demand for Soybean Oil, 2006/07-2012/13
China’s Soybean Oil Import Volume and Growth Rate, 2006-2013
China’s Soybean Import Volume and Growth Rate, 2006-2013
Proportion of Capacity of China’s Top 10 Soybean Crushing Companies, 2011
Retail Price of Barrel Soybean Oil in China, 2008-2013
Output of Peanut Oil in China, 2004-2012
China’s Demand for Peanut Oil, 2008-2012
China’s Peanut Oil Import and Export Volume, 2008-2013
Retail Price of Barrel Peanut Oil in China, 2006-2013
Output and Growth Rate of Rapeseed Oil, 2003-2012
China’s Demand for Rapeseed Oil, 2007/08-2012/13
China’s Rapeseed Oil and Rapeseed Import Volume, 2007-2012
Average Price of First Grade Bulk Rapeseed Oil in 50 Cities, 2009-2013
Output and Growth Rate of Maize oil in China, 2008-2012
Spot Price of Maize oil in the United States, 2007-2013
Ex-factory Price of Maize oil in Main Areas of China, 2010-2012
Comparison of Key Maize oil Companies in China
Type (by Quality), Processing Technology and Acidity of Olive Oil
Global Olive Oil Production, 2007-2012
China’s Olive Oil Import Volume, 2008-2013
Sources of China’s Olive Oil Imports, 2013
Global Market Price of Olive Oil, 2000-2013
China’s Average Import Price of Olive Oil, 2008-2013
China’s Palm Oil Output and Import Volume, 2006-2012
Sources of China’s Palm Oil Imports, 2013
China’s Demand for Palm Oil, 2006/07-2012/13
China’s Main Palm Oil Contract Settlement Price, 2007-2013
China’s Oil-tea Camellia Seed Output, 2004-2012
China’s Oil-tea Camellia Seed Output Structure (by Region), 2011
Output Value of China’s Oil-tea Camellia Industry, 2009-2012
Type of Chinese Oil-tea Camellia Seed Oil Processing Enterprises
Proportion of Oil-tea Camellia Seed Oil Consumption in China and Proportion of Olive Oil Consumption in Developed Countries, 2010
Revenue and Net Income of Wilmar International, 2008-2013
Products and Services of Wilmar International by Business Sector
Revenue Structure of Wilmar International by Business Sector, 2012
Revenue Breakdown of Wilmar International by Region, 2008-2012
Revenue Structure of Wilmar International by Region, 2012
Production and Operation of Vegetable Oil Companies Subordinate to Yihai Kerry
Major Edible Vegetable Oil Brands of Yihai Kerry
Total Assets and Total Profit of COFCO, 2006-2012
Comprehensive Processing Capacity of COFCO, 2010-2012
Processing Capacity of COFCO by Product, 2012
Listed Companies Subordinate to COFCO
Revenue and Net Income of China Foods Limited, 2008-2013
Revenue Structure of China Foods Limited by Product, 2008-2013
Revenue Breakdown of China Foods Limited by Product, 2008-2013
Revenue and Net Income of C Changshouhua Food, 2008-2013
Revenue Breakdown of Changshouhua Food by Product, 2008-2013
Revenue Structure of Changshouhua Food by Product, 2008-2013
Revenue Breakdown of Changshouhua Food by Region, 2008-2012
Revenue Structure of Changshouhua Food by Region, 2008-2012
Gross Margin of Changshouhua Food, 2008-2013
Gross Margin of Changshouhua Food by Product, 2008-2013
Revenue and Net Income of Changshouhua Food, 2011-2015
Revenue and Net Income of Xiwang Food, 2009-2013
Revenue Breakdown of Xiwang Food by Product, 2009-2013
Revenue Structure of Xiwang Food by Product, 2009-2012
Revenue Breakdown of Xiwang Food by Region, 2009-2013
Revenue Structure of Xiwang Food by Region, 2009-2013
Gross Margin of Xiwang Food, 2010-2013
Gross Margin of Xiwang Food by Product, 2010-2013
Xiwang Food’s Revenue from Top 5 Clients and % of Total Revenue, 2010-2013
Operational Analysis of Xiwang Food’s Subsidiaries, 2012
Maize oil Sales Volume of Xiwang Food, 2008-2013
Revenue and Net Income of Xiwang Food, 2011-2015E
Revenue and Net Income of Dongling Grain & Oil, 2008-2013
Revenue Breakdown of Dongling Grain & Oil by Product, 2009-2013
Revenue Structure of Dongling Grain & Oil by Product, 2009-2013
Revenue Breakdown of Dongling Grain & Oil by Region, 2008-2013
Revenue Structure of Dongling Grain & Oil by Region, 2008-2013
Gross Margin of Dongling Grain & Oil by Product, 2009-2013
Dongling Grain & Oil’s Revenue from Top 5 Clients and % of Total Revenue, 2008-2013
Soybean Crushing Volume of Dongling Grain & Oil, 2008-2013
Revenue and Net Income of Dongling Grain & Oil, 2011-2015E
Revenue and Net Income of Jiajia Food, 2008-2013
Revenue Breakdown of Jiajia Food by Product, 2008-2013
Revenue Structure of Jiajia Food by Product, 2008-2013
Revenue Breakdown of Jiajia Food by Region, 2008-2013
Revenue Structure of Jiajia Food by Region, 2008-2012
Gross Margin of Jiajia Food by Product, 2008-2013
Jiajia Food’s Revenue from Top 5 Clients and % of Total Revenue, 2008-2013
Revenue and Net Income of Edible Oil Related Subsidiaries of Jiajia Food, 2013
Revenue and Net Income of Jiajia Food, 2011-2015
Revenue and Net Income of Jinjian , 2008-2013
Revenue Breakdown of Jinjian by Product, 2008-2013
Revenue Structure of Jinjian by Product, 2008-2013
Revenue Breakdown of Jinjian by Region, 2008-2013
Revenue Structure of Jinjian by Region, 2008-2013
Gross Margin of Jinjian by Product, 2008-2013
Jinjian ’s Revenue from Top 5 Clients and % of Total Revenue, 2008-2013
Assets and Revenue of Vegetable Oil Related Subsidiaries of Jinjian , 2013
Profile of Oil Plants Subordinate to Jinjian
Revenue and Net Income of Jinjian , 2011-2015E
Revenue and Net Income of XINSAI, 2008-2013
Revenue Breakdown of XINSAI by Product, 2008-2013
Revenue Structure of XINSAI by Product, 2008-2013
Revenue Breakdown of XINSAI by Region, 2008-2013
Revenue Structure of XINSAI by Region, 2008-2013
XINSAI’s Consolidated Gross Margin and Gross Margin of Edible Oil, 2008-2013
XINSAI’s Revenue from Top 5 Clients and % of Total Revenue, 2008-2013
Business Scope of Vegetable Oil Related Subsidiaries of XINSAI
Revenue and Net Income of Chenguang Biotech, 2009-2013
Revenue Breakdown of Chenguang Biotech by Product, 2011-2013
Revenue Structure of Chenguang Biotech by Product, 2011-2013
Operating Revenue Breakdown of Chenguang Biotech by Region, 2009-2013
Operating Revenue Structure of Chenguang Biotech by Region, 2009-2013
Chenguang Biotech’s Consolidated Gross Margin and Gross Margin of Oils and Fats, 2010-2013
Chenguang Biotech’s Revenue from Top 5 Clients and % of Total Revenue, 2009-2013
Revenue and Profit of Vegetable Oil Related Subsidiaries of Chenguang Biotech, 2013
Chenguang Biotech’s Patent Application Related to Vegetable Oil, 2012
Revenue and Net Income of Chenguang Biotech, 2011-2015E
Financial Indicators of Hunan Jinhao Camellia Oil, 2007-2009
Financial Indicators of Sanhe Hopefull Grain & Oil Group, 2007-2009
Production and Operation of Vegetable Oil Companies Subordinate to Chinatex Grains and Oils Imp. & Exp.
Financial Indicators of Shanghai Liangyou Haishi Oils & Fats Industry, 2007-2009
Financial Indicators of Shandong Yuhuang Grain&Oil Food, 2007-2009
Financial Indicators of Tianjin Longwit Oils and Grains Industrial and Tianjin Julong Oils and Grains, 2007-2009
Financial Indicators of Shanghai Standard Foods, 2007-2009
如果这份报告不能满足您的要求,我们还可以为您定制报告,请 留言说明您的详细需求。
|