|
|
|
报告导航:研究报告—
TMT产业—电子半导体
|
|
2013年全球及中国显示驱动IC行业研究报告 |
 |
字数:2.6万 |
页数:118 |
图表数:123 |
|
中文电子版:8000元 |
中文纸版:4000元 |
中文(电子+纸)版:8500元 |
|
英文电子版:2300美元 |
英文纸版:2400美元 |
英文(电子+纸)版:2600美元 |
|
编号:ZYW156
|
发布日期:2013-09 |
附件:下载 |
 |
|
|
《2012-2013年全球及中国显示驱动IC行业研究报告》包括以下内容:1、显示驱动IC市场 2、平面显示市场 3、10家显示驱动IC厂家研究 4、11家中小显示屏厂家与驱动IC产业链厂家研究 造成当前驱动IC的ASP下滑的因素较多,如:- 显示驱动IC集成度持续提高
- 驱动IC开始采用产出效率更高的12英寸晶圆厂制造,且采用90纳米工艺
- 很多厂家为了节约成本,乐于采用RAM-Less的驱动IC等
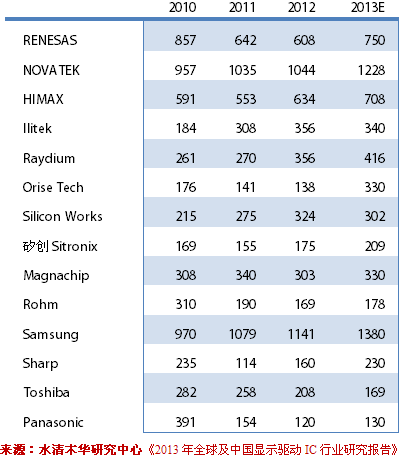
但2013年显示驱动IC市场仍将取得五年来最大幅度的增长,年增幅预计达到14.4%,达到7111百万美元,预计2014年增幅达8.0%。取得如此大增幅的主要驱动力来自手机,无论智能手机还是非智能手机,手机显示屏的分辨率都在飞速提高,这使得高端驱动IC出货量大增。 考察2012年上市的1040款手机,2013年1月1日至2013年9月15日期间新上市的759款手机,FHD增加最多,从2012年的0.7%增加到2013年的17%。2012年像素点阵400ppi以上的仅有0.5%,2013年高于400ppi的达12%。2012年高于300ppi的只有12%,2013年达28%。 因为手机高度同质化,手机的竞争集中在屏幕、外壳和拍照像素上,屏幕的竞争尤其激烈,以前看起来非常高端的显示屏现在看起来非常低端,即便是高端智能手机增速放缓,显示屏的升级速度异常惊人。WQXGA (2560×1440)级分辨率的手机屏幕已经出现了,目前LGD已经开发了样品,而日本JDI也有能力开发WQXGA级面板。 5.5寸的WQXGA对应的为534PPI,6寸为489PPI。2013年底就可能看到使用WQXGA级显示屏的手机。Qualcomm和Mediatek已经开发了对应8线程的MIPI界面,支持最高9.6Gbps的传输速率和60Hz的帧速率(Frame Rate)。这完全可以发挥WQXGA的效果,如此高的分辨率,不附加任何其他器件就有3D的效果。预计2014年将会有众多旗舰手机使用WQXGA面板,出货量可以达到130百万部。 WQXGA的驱动IC可以用8” 0.11 µm 或 12” 90 nm工艺Foundry,当然必须尽量少RAM。如果要采用标准容量RAM设计,那么需要12英寸55nm工艺制造,否则尺寸和功耗太大。不过TSMC和UMC都可以轻松做到55纳米,目前Renesas\Novatek\Samsung都在开发WQXGA的驱动IC,预计3季度就可以推出。 手机显示屏的另一个变化是LTPS技术大量使用,超过300ppi的面板99%都需要采用LTPS技术。预计2014年LTPS使用率达到38%,2015年达到52%。但是LTPS投入大,对于曾经多年深陷亏损泥潭的台湾厂家来说,LTPS并不能让其动心 。INNOLUX和AUO更热衷IGZO。日韩企业都在加大LTPS产能,苹果手机显示屏第一大供应商日本JDI在6月投产了全球最大的LTPS生产线,该公司也是全球最大的LTPS厂家,LGD则在8月投产了一条6代线的LTPS生产线,紧追JDI。夏普则IGZO和LTPS都押注,但LTPS产能没扩展。 大部分高端智能机目前都倾向采用IN-CELL触控屏,OGS局限在低端,未来IN-CELL产能扩大,OGS可能退出市场。苹果的IPhone5S仍然坚持IN-CELL,华为、小米等中国厂家高端机型也倾向采用IN-CELL触控屏,这就意味着Display Driver IC和Touch Controllers将来要合二为一,苹果的IPhone5S就是如此。 2010-2013年全球主要显示驱动IC厂家收入(单位:百万美元)
The report includes the following aspects:1. Display driver IC market 2. Flat panel display market 3. Ten display driver IC vendors 4. Eleven small and medium-sized display and driver IC vendors The current decline in the ASP of driver IC is attributed to many factors, including: The display driver IC integration density continues to rise Driver IC is made by 12-inch fabs with the 90-nanometer process at high output efficiency Many vendors are willing to adopt RAM-Less driver IC in order to save costs. In
2013, the display driver IC market will see the highest growth rate of
14.4% in the past five years and value USD7,111 million. The growth rate
is expected to be 8.0% in 2014. The substantial growth is mainly
boosted by mobile phones, whether smart phones or ordinary phones, whose
screen resolution is soaring, which makes the high-end driver IC
shipment surge. Compared 1,040 models of mobile phones launched
in 2012 with 759 models unveiled from January 1, 2013 to September 15,
2013, the share of FHD jumped the most quickly from 0.7% in 2012 to 17%
in 2013. The ones with the pixel matrix of above 400ppi only accounted
for 0.5% in 2012, but up to 12% in 2013. The proportion of the ones with
over 300ppi ascended from 12% in 2012 to 28% in 2013. Due to
serious homogeneity, the competition among mobile phones is mainly
reflected in screen, casing and camera pixel, especially screen. The
formerly extraordinary screen looks inferior now. Even if the
development of high-end smart phones slows down, the display is
upgrading amazingly. Currently, LGD has developed a prototype of WQXGA
(2560×1440) cell phone screen. Japan JDI also has the ability to develop
WQXGA panels. 5.5-inch WQXGA corresponds to 534PPI, and 6-inch
one to 489PPI. The mobile phones with WQXGA screen will be available at
the end of 2013. Qualcomm and Mediatek have developed corresponding
8-thread MIPI interface which supports a transfer rate up to 9.6Gbps and
a frame rate of 60Hz. In this case, 3D effects will be achieved without
the help of any other device. In 2014, a number of flagship mobile
phones will use WQXGA panels with the expected shipment of 130 million
units. WQXGA driver IC can be made using 8" 0.11 μm or 12" 90 nm
process, but RAM should be used as little as possible, if not, the
12-inch 55nm process is required for reducing size and power
consumption. However, TSMC and UMC can gain 55 nm easily. Renesas,
Novatek and Samsung are developing WQXGA driver IC which will be
launched in Q3. Another change in mobile phone display lies in
the wide application of LTPS technology. More than 99% of 300ppi (or
above) panels adopt LTPS technology. The LTPS utilization will reach 38%
in 2014 and 52% in 2015. But LTPS needs huge investment, so Taiwanese
vendors who ever suffered losses for many years do not prefer LTPS.
INNOLUX and AUO are more interested in IGZO. Japanese and Korean
companies are increasing LTPS capacity. Apple’s largest mobile phone
display supplier and the global largest LTPS vendor Japan JDI put the
world's largest LTPS production line into operation in June. LGD also
started one six-generation LTPS production line in August to follow JDI.
Sharp kept an eye on both IGZO and LTPS, but did not expand its LTPS
capacity. Most high-end smart phones tend to use IN-CELL touch
screen, while OGS is confined to the lower end. In the future, OGS may
withdraw from the market as IN-CELL capacity is improved. Apple’s
IPhone5S still sticks to IN-CELL, and Huawei, Xiaomi and other Chinese
vendors of high-end models also prefer IN-CELL touch screen, which means
Display Driver IC and Touch Controllers will be combined just like
Apple's IPhone5S. Revenue of Major Global Display Driver IC Vendors, 2010-2013 (USD mln)
第一章、驱动IC简介
1.1、TFT-LCD驱动IC简介
1.2、驱动IC封装
1.3、显示驱动IC市场
1.4、显示驱动IC产业
第二章、平面显示市场
3.1、手机
3.1.1、全球手机市场概况
3.1.2、全球智能手机市场概况
3.1.3、手机面板现状趋势
3.1.4、LTPS与IGZO 市场
3.1.5、LTPS与OLED产业现状与趋势
3.2、UHD(4K2K)电视
3.2.1、UHD与OLED电视市场
3.2.2、4K2K电视驱动IC
3.2.3、4K2K电视供应链
3.3、MOBILE PC
3.3.1、MOBILEPC面板市场
3.3.2、中国移动PC产业
第三章、显示驱动IC厂家研究
3.1、RENESAS瑞萨
3. 2、联咏
3.3、奇景(HIMAX)
3.4、奕力(ILITEK )
3. 5、瑞鼎(RAYDIUM)
3.6、旭曜
3.7、硅创(SITRONIX)
3.8、MAGNACHIP
3.9、天钰(FITIPOWER)
3.10、SILICON WORKS
3.11、LUSEM
第四章、主要中小尺寸面板厂家研究
4.1、JAPAN DISPLAY
4.2、彩晶
4.3、华映
4.4、友达
4.5、群创光电
4.6、LG DISPLAY
4.7、SMD
第五章、驱动IC产业链厂家研究
5.1、南茂科技CHIPMOS
5.2、颀邦科技(CHIPBOND)
5.3、世界先进(VIS)
5.4、力晶(POWERCHIP)
1 Introduction to Driver IC
1.1 TFT-LCD Driver IC
1.2 Driver IC Packaging
1.3 Display Driver IC Market
1.4 Display Driver IC Industry
2 Flat Panel Display Market
2.1 Mobile Phone
2.1.1 Overview of Global Mobile Phone Market
2.1.2 Overview of Smart Mobile Phone Market
2.1.3 Status Quo and Trends of Mobile Phone Panels
2.1.4 LTPS and IGZO Market
2.1.5 Status Quo and Trends of LTPS and OLED Industry
2.2 UHD (4K2K) TV
2.2.1 UHD and OLED TV Market
2.2.2 4K2K TV Driver IC
2.2.3 4K2K TV Supply Chain
2.3 Mobile PC
2.3.1 Mobile PC Panel Market
2.3.2 China Mobile PC Industry
3 Display Driver IC Vendors
3.1 RENESAS
3.2 NOVATEK
3.3 HIMAX
3.4 ILITEK
3.5 RAYDIUM
3.6 ORISE
3.7 SITRONIX
3.8 MAGNACHIP
3.9 FITIPOWER
3.10 SILICON WORKS
3.11 LUSEM
4 Major Small and Medium-Sized Panel Vendors
4.1 JAPAN DISPLAY
4.2 HANNSTAR
4.3 CPT
4.4 AUO
4.5 INNOLUX
4.6 LG DISPLAY
4.7 SMD
5 Driver IC Industry Chain Vendors
5.1 CHIPMOS
5.2 CHIPBOND
5.3 VIS
5.4 POWERCHIP
2009-2014年全球显示驱动IC市场规模
2005-2015年显示驱动IC出货量下游分布
2010-2013年全球主要显示驱动IC厂家收入排名
2011年1季度-2013年2季度台湾4大显示驱动IC厂家毛利率
2007-2014年全球手机出货量
2010-2013年全球CDMA/WCDMA手机出货量地域分布
2013年2季度全球前十大品牌销量和市场占有率
2013年2季度智能手机操作系统出货量和市场占有率
2013年2季度主要安卓手机厂商出货量和市场占有率
2013年2季度主要WINDOWS PHONE 智能手机厂商出货量和市场占有率
2011-2012中国主要智能手机厂家出货量
2012-2013年新上市手机分辨率分布
2012-2013年新上市手机PPI分布
2012-2013年新上市手机面板尺寸分布
2011年1季度-2013年4季度手机面板季度出货量与增幅
2011年1季度-2013年4季度手机面板ASP
2013年1季度-2014年4季度LTPS手机 面板出货量
2013、2014年全球LTPS生产线产能一览
2013-2015年全球LTPS厂家产能一览
2010-2014年全球OLED生产线一览
2012-2017年UHD电视出货量
2011年1季度-2013年4季度MOBILEPC面板出货量与增幅
2011年1季度-2013年4季度MOBILEPC面板ASP
2012、2013年平板电脑分辨率
2004-2012年中国笔记本电脑(包括平板电脑)产量
2010-2012年中国笔记本电脑产量(包括平板电脑)地域分布
瑞萨组织结构
2011-2014财年1季度瑞萨收入部门分布
2006-2013年联咏收入与运营利润率
2011年8月-2013年8月联咏月度收入与增幅
2011年1季度-2013年2季度联咏季度收入产品分布
奇景关系企业图
2006-2013年奇景收入与运营利润率
2006-2012年奇景收入产品分布
2002-2013年上半年奇景出货量
2007-2013年奇景毛利率
2011年1季度-2013年2季度奇景季度收入产品分布
2011年1季度-2013年2季度奇景季度运营花费
2011年1季度-2013年2季度奇景季度毛利率
2007-2013年奇景大客户比例
奇景供应链
2007-2013年奕力收入与运营利润率
2011年8月-2013年8月奕力月度收入与增幅
2007-2012年奕力出货量
2008-2012年奕力出货量下游应用分布
2007-2013年瑞鼎收入与运营利润率
2011年8月-2013年8月瑞鼎月度收入与增幅
2011、2012年瑞鼎产量、销量、产值
2007-2013年旭曜收入与运营利润率
2009年1季度-2013年2季度旭曜营业利润率
2009年1季度-2013年2季度旭曜收入
2006年2季度-2012年2季度旭曜净利润
2011年8月-2013年8月旭曜月度收入与增幅
2008-2011年旭曜产量
2008-2013年旭曜销量
2009年1季度-2013年2季度旭 曜收入产品分布
2012年2季度旭 曜收入客户分布
2012年2季度旭 曜收入客户分布
2009年1季度-2013年2季度旭曜季度出货量
2006-2013年硅创收入与运营利润率
2011年8月-2013年8月硅创月度收入与增幅
2001-2013年MAGNACHIP收入与毛利率
2004-2012年MAGNACHIP收入业务分布
2012年MAGNACHIP收入下游分布
2009-2012年MAGNACHIP收入地域分布
2010年1季度-2012年2季度MAGNACHIP 显示驱动(DISPLAY DRIVERIC)事业部收入
MAGNACHIP 各晶圆厂一览
2011年8月-2013年8月天钰科技月度收入与增幅
2009-2014年SILICON WORKS收入与营业利润率
2009-2013年SILICON WORKS收入产品分布
2011年IPS中小尺寸液晶面板之市占率
2006-2013年彩晶收入与运营利润率
2011年8月-2013年8月彩晶月度收入与增幅
2012年Q3-2013年Q2彩晶出货尺寸分布、出货量及ASP
2004-2013年华映收入与运营利润率
2011年8月-2013年8月华映月度收入
2012年1月-2013年8月华映月度收入与出货量
2004-2013年友达收入与运营利润率
2011年8月-2013年8月友达月度收入与增幅
2011年1季度-2013年2季度友达收入下游应用分布
2012年2季度-2013年2季度友达收入尺寸分布
2011年1季度-2013年2季度友达中小尺寸出货量与收入
2013年2季度友达各生产线产能
2012年1季度-2013年2季度友达出货量
2007-2013年群创光电收入与运营利润率
2011年3季度-2013年2季度群创光电收入与毛利率
2011年3季度-2013年2季度群创光电NET DEBT RATIO
2011年3季度-2013年2季度群创光电INVENTORY TREND
2011年3季度-2013年2季度群创光电 AREA SHIPMENTS AND TFT LCD ASP TRENDS
2011年3季度-2013年2季度群创光电SMALL & MEDIUM-SIZE UNIT SHIPMENTS AND SALES TRENDS
2011年3季度-2013年2季度群创光电TOUCH MODULE AND SENSOR SHIPMENT BY APPLICATION
2011年3季度-2013年2季度群创光电收入下游应用分布
2011年3季度-2013年2季度群创光电收入尺寸分布
2010年2季度-2012年2季度群创光电中小尺寸收入与出货量
2012年1季度群创光电各生产线产能
2012年1季度群创光电TOUCH SENSOR产能
2002-2013年LG DISPLAY收入与运营利润率
2011年1季度-2013年2季度LG DISPLAY每季度收入与运营利润率、毛利率
2010年1季度-2013年2季度LGD收入下游应用分布
2009-2013年SMD收入与运营利润率
2009年1季度-2012年2季度SMD季度收入与运营利润率
2009年1季度-2012年1季度SMD季度出货量与ASP
2010年1季度-2012年1季度SMD OLED业务收入与所占比重
2010-2013年SMD AMOLED产能
2011年1季度-2014年4季度SMD AMOLED 产能路线图
2003-2013年CHIPMOS收入与毛利率
2011-2012年CHIPMOS收入客户分布
2006-2012年CHIPMOS收入地域分布
2012年上半年CHIPMOS收入业务分布
2013年上半年CHIPMOS收入业务分布
2012年上半年CHIPMOS收入产品分布
2013年上半年CHIPMOS收入产品分布
2009-2013年CHIPMOS LCDD业务收入与产能
2006-2013年CHIPBOND收入与运营利润率
颀邦COG\COF 产能地域分布
颀邦TAB 产能分布
2011年8月-2013年8月颀邦月度收入
2005-2013年VIS收入与营业利润率
2011年1季度-2013年2季度VIS收入与毛利率
2011年1季度-2013年2季度VIS收入节点(NODE)分布
2011年1季度-2013年2季度VIS收入下游应用分布
2011年1季度-2013年2季度VIS收入产品分布
2010年1季度-2013年2季度VIS出货量与产能利用率
Global Display Driver IC Market Size, 2009-2014E
Downstream Distribution of Display Driver IC Shipment, 2005-2015E
Ranking of Major Global Display Driver IC Vendors by Revenue, 2010-2013
Gross Margin of Four Major Display Driver IC Vendors in Taiwan, Q1 2011-Q2 2013
Global Mobile Phone Shipment, 2007-2014E
Geographical Distribution of Global CDMA/WCDMA Phone Shipment, 2010-2013
Sales Volume and Market Share of Global Top 10 Mobile Phone Brands, Q2 2013
Shipment and Market Share of Major Smart Phone Operating Systems, Q2 2013
Shipment and Market Share of Major Android Phone Vendors, Q2 2013
Shipment and Market Share of Major Windows Phone Vendors, Q2 2013
Shipment of Major Smart Phone Vendors in China, 2011-2012
Resolution of New Mobile Phones, 2012-2013
PPI of New Mobile Phones, 2012-2013
Panel Size of New Mobile Phones, 2012-2013
Quarterly Shipment and Growth Rate of Mobile Phone Panel, Q1 2011-Q4 2013
Mobile Phone Panel ASP, Q1 2011-Q4 2013
LTPS Mobile Phone Panel Shipment, Q1 2013-Q4 2014
Capacity of Global LTPS Production Lines, 2013-2014
Capacity of Global LTPS Vendors, 2013-2015E
Global OLED Production Lines, 2010-2014E
UHD TV Shipment, 2012-2017
Mobile PC Panel Shipment and Growth Rate, Q1 2011-Q4 2013
Mobile PC Panel ASP, Q1 2011-Q4 2013
Tablet PC Resolution, 2012-2013
China’s Laptop Computer Output (including Tablet PC), 2004-2012
Geographical Distribution of China’s Laptop Computer Output (including Tablet PC), 2010-2012
Organizational Structure of RENESAS
Revenue of RENESAS by Division, FY2011-Q1 2014
Revenue and Operating Margin of Novatek, 2006-2013
Monthly Revenue and Growth Rate of Novatek, Aug 2011-Aug 2013
Quarterly Revenue of Novatek by Product, Q1 2011-Q2 2013
Affiliated Enterprises of HIMAX
Revenue and Operating Margin of HIMAX, 2006-2013
Revenue of HIMAX by Product, 2006-2012
Shipment of HIMAX, 2002-H1 2013
Gross Margin of HIMAX, 2007-2013
Quarterly Revenue of HIMAX by Product, Q1 2011-Q2 2013
Quarterly Operating Costs of HIMAX, Q1 2011-Q2 2013
Quarterly Gross Margin of HIMAX, Q1 2011-Q2 2013
Major Client Structure of HIMAX, 2007-2013
Supply Chain of HIMAX
Revenue and Operating Margin of ILITEK, 2007-2013
Monthly Revenue and Growth Rate of ILITEK, Aug 2011-Aug 2013
Shipment of ILITEK, 2007-2012
Shipment of ILITEK by Application, 2008-2012
Revenue and Operating Margin of RAYDIUM, 2007-2013
Monthly Revenue and Growth Rate of RAYDIUM, Aug 2011-Aug 2013
Output, Sales Volume and Output Value of RAYDIUM, 2011-2012
Revenue and Operating Margin of Orise, 2007-2013
Operating Margin of Orise, Q1 2009-Q2 2013
Revenue of Orise, Q1 2009-Q2 2013
Net Income of Orise, Q2 2006-Q2 2012
Monthly Revenue and Growth Rate of Orise, Aug 2011-Aug 2013
Output of Orise, 2008-2011
Sales Volume of Orise, 2008-2013
Revenue of Orise by Product, Q1 2009-Q2 2013
Revenue of Orise by Client, Q2 2012
Quarterly Shipment of Orise, Q1 2009-Q2 2013
Revenue and Operating Margin of SITRONIX, 2006-2013
Monthly Revenue and Growth Rate of SITRONIX, Aug 2011-Aug 2013
Revenue and Gross Margin of MAGNACHIP, 2001-2013
Revenue of MAGNACHIP by Business, 2004-2012
Revenue of MAGNACHIP by Application, 2012
Revenue of MAGNACHIP by Region, 2009-2012
Revenue of MAGNACHIP’s Display Driver IC Division, Q1 2010-Q2 2012
Fabs of MAGNACHIP
Monthly Revenue and Growth Rate of FITIPOWER, Aug 2011-Aug 2013
Revenue and Operating Margin of SILICON WORKS, 2009-2014 ,
Revenue of SILICON WORKS by Product, 2009-2013
Market Share of Small and Medium-sized LCD Panels of IPS, 2011
Revenue and Operating Margin of Hannstar, 2006-2013
Monthly Revenue and Growth Rate of Hannstar, Aug 2011-Aug 2013
Size, Shipment and ASP of Hannstar, Q3 2012-Q2 2013
Revenue and Operating Margin of CPT, 2004-2013
Monthly Revenue of CPT, Aug 2011-Aug 2013
Monthly Revenue and Shipment of CPT, Jan 2012-Aug 2013
Revenue and Operating Margin of AUO, 2004-2013
Monthly Revenue and Growth Rate of AUO, Aug 2011-Aug 2013
Revenue of AUO by Application, Q1 2011-Q2 2013
Revenue of AUO by Size, Q2 2012-Q2 2013
Revenue and Shipment of Small and Medium-sized Products of AUO, Q1 2011-Q2 2013
Capacity of AUO by Production Line, Q2 2013
Shipment of AUO, Q1 2012-Q2 2013
Revenue and Operating Margin of Innolux, 2007-2013
Revenue and Gross Margin of Innolux, Q3 2011-Q2 2013
Net Debt Ratio of Innolux, Q3 2011-Q2 2013
Inventory Trend of Innolux, Q3 2011-Q2 2013
Regional Shipment and TFT LCD ASP Trends of Innolux, Q3 2011-Q2 2013
Small & Medium-Size Shipment and Sales Trends of Innolux, Q3 2011-Q2 2013
Touch Module and Sensor Shipment by Application of Innolux, Q3 2011-Q2 2013
Revenue of Innolux by Application, Q3 2011-Q2 2013
Revenue of Innolux by Size, Q3 2011-Q2 2013
Revenue and Shipment of Small and Medium-sized Products of Innolux, Q2 2010-Q2 2012
Capacity of Innolux by Production Line, Q1 2012
Touch Sensor Capacity of Innolux, Q1 2012
Revenue and Operating Margin of LG DISPLAY, 2002-2013
Quarterly Revenue, Gross Margin and Operating Margin of LG DISPLAY, Q1 2011-Q2 2013
Revenue of LGD by Application, Q1 2010-Q2 2013
Revenue and Operating Margin of SMD, 2009-2013
Quarterly Revenue and Operating Margin of SMD, Q1 2009-Q2 2012
Quarterly Shipment and ASP of SMD, Q1 2009-Q1 2012
OLED Revenue and Proportion of SMD, Q1 2010-Q1 2012
AMOLED Capacity of SMD, 2010-2013
AMOLED Capacity of SMD, Q1 2011-Q4 2014
Revenue and Gross Margin of CHIPMOS, 2003-2013
Revenue of CHIPMOS by Client, 2011-2012
Revenue of CHIPMOS by Region, 2006-2012
Revenue of CHIPMOS by Business, H1 2012
Revenue of CHIPMOS by Business, H1 2013
Revenue of CHIPMOS by Product, H1 2012
Revenue of CHIPMOS by Product, H1 2013
LCDD Revenue and Capacity of CHIPMOS, 2009-2013
Revenue and Operating Margin of CHIPBOND, 2006-2013
Geographical Distribution of COG/COF Capacity of CHIPBOND
Distribution of TAB Capacity of CHIPBOND
Monthly Revenue of CHIPBOND, Aug 2011-Aug 2013
Revenue and Operating Margin of VIS, 2005-2013
Revenue and Gross Margin of VIS, Q1 2011-Q2 2013
Revenue of VIS by Node, Q1 2011-Q2 2013
Revenue of VIS by Application, Q1 2011-Q2 2013
Revenue of VIS by Product, Q1 2011-Q2 2013
Shipment and Capacity Utilization of VIS, Q1 2010-Q2 2013
如果这份报告不能满足您的要求,我们还可以为您定制报告,请 留言说明您的详细需求。
|