|
|
|
报告导航:研究报告—
生命科学—生物科技
|
|
2013-2015年中国肝素行业研究报告 |
 |
字数:3.1万 |
页数:74 |
图表数:82 |
|
中文电子版:7000元 |
中文纸版:3500元 |
中文(电子+纸)版:7500元 |
|
英文电子版:2000美元 |
英文纸版:2100美元 |
英文(电子+纸)版:2300美元 |
|
编号:ZYM048
|
发布日期:2013-10 |
附件:下载 |
 |
|
|
由于中国生产肝素用的猪小肠原料丰富(中国生猪屠宰量约占全球50%),以及肝素原料药逐渐获得国际认可,中国已成为全球最大的肝素原料药生产与出口国。不过,由于近两年欧美市场需求低迷,加之出口肝素标准提高,2011-2012年中国肝素原料出口呈量价齐跌趋势。2012中国肝素原料仅出口103.86吨(同比下滑1.3%),约14.5万亿单位(按140IU/mg),占全球同期肝素原料药需求的46.5%。
表:2008-2012年中国肝素原料出口量及其占全球需求比例
海普瑞、南京健友、东诚生化、千红制药是全球肝素原料药主要供应商。这四家企业肝素原料药产销近年一直在万亿单位以上,并且连续多年位居中国肝素出口前四,合占中国肝素出口总额70%以上份额。 虽然前几年领先肝素企业已有扩大产能及完善肝素产业链的计划,但是受需求市场走低或技术标准提升等原因,多个原计划2012或2013年投产的肝素原料药项目相继延迟,如海普瑞的5万亿单位/年、东诚生化2.8万亿单位/年、南京健友4万亿单位/年(普通肝素钠)和低分子肝素钠1.2T/A等。而千红制药的原料药项目虽然2012年底建成,但却未放产。 不过,从拟在建项目看,预计2015年中国肝素原料药新增产能将达到23万亿单位以上,届时中国总产能将占到全球需求量80%左右。 在肝素原料药供应能力日益提高的同时,中国本土肝素制剂产品竞争力正逐渐加强。以低分子肝素钙市场为例。2008年葛兰素史克的那曲肝素在中国市场份额为61.0%,但 2011 年已下降到 52.5%,估计2012年市场份额下降至40%左右。而常山生化低分子肝素钙已成为中国首家可与国外大品牌抗衡的产品,2012年该产品销售收入2.896亿元,而2011年仅为8693万元。 《2013-2015年中国肝素产业研究报告》主要包括以下几方面内容:
- 中国肝素行业进入壁垒和全球市场供需、竞争格局及预测等;
- 中国肝素原料药行业发展现状、市场供需、竞争格局、进出口以及发展预测等;
- 中国肝素制剂行业发展现状、市场供需、竞争格局以及发展预测等;
- 海普瑞、南京健友、千红制药、东诚生化、常山生化等7家肝素企业运营状况、肝素业务及发展前景等。
Since the small intestines of pigs (raw materials for production of heparin) in China are abundant (the pig slaughtering volume in China approximates 50% of globe’s total) and heparin APIs are gradually recognized internationally, China has grown into the largest heparin API producing and exporting country around the globe. Nevertheless, due to the stagnant demand in European and American markets in recent two years and the improved standards for heparin export, the export volume and value of heparin APIs in China both presented a decline trend during 2011-2012. In 2012, the export volume of heparin APIs in China only registered 103.86 tons (with a year-on-year decline of 1.3%), or about 14.5 trillion units (based on 140IU/mg), addressing 46.5% of global heparin API demand in corresponding period.
Export Volume of Heparin APIs in China and Its Proportion of Global Demand, 2008-2012 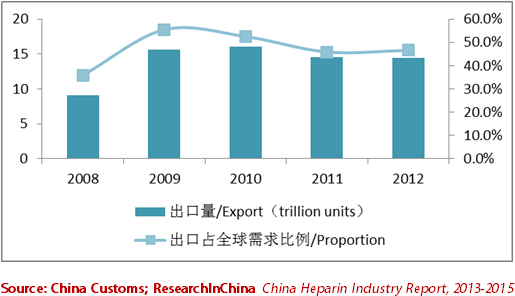 Hepalink, Nanjing King-friend, Dongcheng Biochemicals and Qianhong Bio-pharma are major suppliers of heparin API around the globe. With output and sales volume of heparin API above trillion units in recent years, the four enterprises have been the largest exporters of heparin in China for consecutive years, and shared over 70% of China’s total export of heparin. Although leading heparin enterprises have had the plans of capacity expansion and heparin industrial chain improvement in previous years, affected by sluggish market demand, enhanced technical standards and other factors, a number of heparin API projects originally planned to start production in 2012 or 2013 were postponed successively, such as the 5T/A project of Hepalink, 2.8T/A project of Dongcheng Bio-chemicals, 4T/A unfractionated heparin sodium and 1.2T/A low-molecular-weight heparin sodium project of Nanjing King-friend. The API project of Qianhong Bio-pharma was completed at the end of 2012, but has not been put into production yet. Nevertheless, from the perspective of projects proposed and under construction, it is predicted that the newly added capacity of heparin API in China will exceed 23 trillion units by 2015, and the total capacity in China will meet 80% of globe’s total demand. Along with the increasing of heparin API deliverability, the competitiveness of heparin preparation products in China is also strengthened gradually. Taking the low-molecular-weight heparin calcium market as an example, the market share of GlaxoSmithKline’s Nadroparin in China was 61.0% in 2008, but the figure declined to 52.5% in 2011, and was estimated to decline to 40% or so in 2012. Nevertheless, the low-molecular-weight heparin calcium of Changshan Biochemical has become the first product in China that can compete with the overseas big brands. The revenue of the product only registered RMB86.93 million in 2011, and climbed up to RMB289.6 million in 2012. China Heparin Industry Report, 2013-2015 mainly consists of the following contents:  Entry barrier, global market supply & demand, competition pattern, forecast, etc. of heparin industry in China; Development status, market supply & demand, competition pattern, import & export, development prospect, etc. of heparin API industry in China; Development status, market supply & demand, competition pattern, development prospect, etc. of heparin preparation industry in China; Operation, heparin business, development prospect, etc. of seven heparin enterprises including Hepalink, Nanjing King-friend, Dongcheng Biochemicals, Qianhong Bio-pharma and Changshan Biochemical.
第一章 肝素行业概况
1.1 定义及分类
1.2 产业链
第二章 中国肝素行业运行环境分析
2.1 进入壁垒
2.1.1 相关政策
2.1.2 技术要求
2.1.3 资金壁垒
2.2 全球市场供需
2.3全球市场竞争
2.4 全球市场预测
第三章 中国肝素原料药行业发展概况
3.1 市场现状
3.2 市场供需
3.3 竞争格局
3.4 进出口分析
3.4.1 出口分析
3.4.2 进口分析
3.5 发展前景及预测
第四章中国肝素制剂行业发展概况
4.1 市场规模
4.2 低分子肝素制剂
4.2.1 低分子肝素钙制剂
4.2.2 低分子肝素钠制剂
4.3普通肝素制剂
4.4 发展前景及预测
第五章 中国肝素重点生产企业分析
5.1 海普瑞
5.1.1公司简介
5.1.2 运营状况
5.1.3 营收构成
5.1.4 毛利率
5.1.5 研发和投资
5.1.6 客户及供应商
5.1.7 发展前景
5.2 千红制药
5.2.1公司简介
5.2.2 运营状况
5.2.3 营收构成
5.2.4 毛利率
5.2.5 研发和投资t
5.2.6 客户和供应商
5.2.7 肝素业务
5.2.8 发展前景
5.3东诚生化
5.3.1 公司简介
5.3.2 运营状况
5.3.3 营收构成
5.3.4 毛利率
5.3.5 研发和投资
5.3.6 客户
5.3.7 肝素业务
5.3.8 发展前景
5.4 常山生化
5.4.1 公司简介
5.4.2 运营状况
5.4.3 营收构成
5.4.4 毛利率
5.4.5 研发和投资
5.4.6 客户和供应商
5.4.7 发展前景
5.5 天津红日d
5.5.1 公司简介
5.5.2 运营状况
5.5.3 营收构成
5.5.4 毛利率
5.5.5 研发和投资
5.5.6 客户和供应商
5.5.7 肝素业务
5.5.8 发展前景
5.6 南京健友
5.6.1 公司简介
5.6.2 运营状况和发展前景
5.7 江苏万邦
5.7.1 万邦生化
5.7.2 营状况和发展前景
1. Overview of Heparin Industry
1.1 Definition and Classification
1.2 Industrial Chain
2. Operating Environment of Heparin Industry in China
2.1 Entry Barrier
2.1.1 Related Policies
2.1.2 Technical Requirements
2.1.3 Capital Barrier
2.2 Global Market Supply & Demand
2.3 Global Market Competition
2.4 Global Market Forecast
3. Development of Heparin API Industry in China
3.1 Market Status
3.2 Market Supply & Demand
3.3 Competition Pattern
3.4 Import & Export
3.4.1 Export
3.4.2 Import
3.5 Development Prospect and Forecast
4. Development of Heparin Preparation Industry in China
4.1 Market Size
4.2 Low Molecular Heparin Preparation
4.2.1 Low Molecular Heparin Calcium Preparation
4.2.2 Low Molecular Heparin Sodium Preparation
4.3 Unfractionated Heparin Preparation
4.4 Development Prospect and Forecast
5. Key Heparin Enterprises in China
5.1 Hepalink
5.1.1 Profile
5.1.2 Operation
5.1.3 Revenue Structure
5.1.4 Gross Margin
5.1.5 R&D and Investment
5.1.6 Clients and Suppliers
5.1.7 Development Prospect
5.2 Qianhong Bio-pharma
5.2.1 Profile
5.2.2 Operation
5.2.3 Revenue Structure
5.2.4 Gross Margin
5.2.5 R&D and Investment
5.2.6 Clients and Suppliers
5.2.7 Heparin Business
5.2.8 Development Prospect
5.3 Dongcheng Biochemicals
5.3.1 Profile
5.3.2 Operation
5.3.3 Revenue Structure
5.3.4 Gross Margin
5.3.5 R&D and Investment
5.3.6 Clients
5.3.7 Heparin Business
5.3.8 Development Prospect
5.4 Changshan Biochemical
5.4.1 Profile
5.4.2 Operation
5.4.3 Revenue Structure
5.4.4 Gross Margin
5.4.5 R&D and Investment
5.4.6 Clients and Suppliers
5.4.7 Development Prospect
5.5 Tianjin Chase Sun
5.5.1 Profile
5.5.2 Operation
5.5.3 Revenue Structure
5.5.4 Gross Margin
5.5.5 R&D and Investment
5.5.6 Clients and Suppliers
5.5.7 Heparin Business
5.5.8 Development Prospect
5.6 Nanjing King-friend
5.6.1 Profile
5.6.2 Operation and Development Prospect
5.7 Jiangsu Wanbang
5.7.1 Wanbang Biochemical
5.7.2 Operation and Development Prospect
肝素的应用
肝素产业链
表:中国肝素钠原料药与肝素规范要求
图:2006-2012年全球肝素制剂市场规模及同比增长
表:低分子量肝素制剂和普通肝素制剂的性能比较
图:2010-2012年全球肝素制剂(分产品)市场规模
图:2012年全球肝素制剂区域布局
图:2007-2012年全球肝素原料药需求及同比增长
表:全球主要肝素制剂生产企业
表:2010-2012年全球主要肝素制剂品牌销售额
图:2012-2015年全球肝素制剂市场规模预测
图:2011-2014年全球肝素原料药需要量预测
表:2008-2013年中国肝素原料药主要厂商毛利率
表:2008-2012年中国肝素粗品产能(亿单位)
图:2008-2013年中国肝素及盐出口均价
表:2012年中国肝素原料药主要企业产能、销量及认证情况(亿单位)
图:2008-2013年中国肝素及其盐出口量及出口金额
图:2008-2013年中国肝素及其盐出口价格
表:2012-2013年中国肝素及其盐出口前10国家和地区(按金额)
表:2012年中国肝素及盐出口前10企业(按出口金额)
表:2008-2012年中国肝素及其盐进口量、进口金额及单价
表:截止2013年6月中国拟/在建肝素钠原料药项目
图:2007-2012年中国肝素制剂市场规模及同比增长
图:2012年中国肝素制剂类产品市场份额
图:2009-2012年中国低分子肝素制剂市场规模
表:2008-2011年中国主要肝素钠制剂企业及售价
图:2012-2015年中国肝素制剂市场规模及同比增长
表:2013上半年海普瑞控股子公司资产和净利润(百万元)
表:2008-2013年海普瑞营业收与利润
表:2011-2012年海普瑞肝素钠原料产销量及库存
图:2008-2013年海普瑞(分产品)营业收入
图:2008-2013年海普瑞(分地区)营业收入
图:2008-2012年海普瑞(分产品)毛利率
图:2009-2011年海普瑞研发投入及占营业收入的比重
图:2008-2013年海普瑞前五客户收入贡献及占比
图:2012-2015年海普瑞营业收入和营业利润预测
表:2013上半年千红制药子公司(控股或参股)资产、营业收入及净利润(百万元
图:2008-2012年千红制药营业收入和利润
表:2008-2013年千红制药(分产品)营业收入
表:2008-2013年千红制药(分地区)营业收入
图:2008-2013年千红制药(分产品)毛利率
图:2009-2013年千红制药研发投入及占营业收入的比重
表:2011年千红制药募投项目产能
表:截止2013年6月千红制药拟/在建项目进展
表:2009-2013年千红制药前五名供应商采购金额和前五名客户收入贡献
图:2008-2013年千红制药肝素业务营业收入及毛利率
图:2011-2014年千红制药营业收入和营业利润
表: 2012上半年东诚生化(控股or参股)子公司资产、营收及净利润(百万元)
表:2008-2013年东诚生化营业收入和利润
图:2008-2013年东诚生化(分产品)主营业收入
表:2008-2013年东诚生化(分地区)主营业收入
图:2008-2013年东诚生化(分产品)毛利率
图:2010-2012年东诚生化研发投入及占公司营业收入的比重
表:截止2012年底东诚生化在研项目进度
表:2011-2012年东诚生化肝素钠产销量及库存
图:2008-2013年东诚生化肝素钠原料药营业收入及毛利率
表:2009-2011年东诚生化肝素钠原料价格
表:2009-2011年东诚生化肝素钠原料药业务前五客户收入贡献及占比
图:2012-2015年东诚生化营业收入和利润预测
表:2008-2013年常山药业营业收入和利润
表:2010-2013年常山药业肝素钠原料药及其制剂产销量和库存
表:2008-2013年常山药业(分产品)主营业收入
表:2008-2013年常山药业(分地区)营业收入
表:2008-2013年常山药业(分产品)毛利率
图:2009-2013年常山药业研发投入及占营业收入的比重
表:截止2013年6月常山药业在研产品进度
表:2012年常山药业前五名客户、收入贡献及占比
表:2013上半年常山药业前五客户、收入贡献及占比
表:2013上半年常山药业前五供应商、采购金额及占比
图:2012-2015年常山药业营业收入和净利润
表:2011-2012年红日药业成品药产销量及库存量
表:2008-2013年红日药业营业收入和利润
表:2008-2013年红日药业(分产品)主营业收入
表:2008-2013年红日药业(分地区)营业收入
表:2008-2013年红日药业(分产品)毛利率
表:2009-2012年红日药业研发投入及占营业收入的比重
表:2011年红日药业前5客户名称、收入贡献及占营业收入的比重
表:2011年红日药业前5供应商名称、采购金额及占总采购金额比重
图:2008-2013年红日药业肝素业务营业收入及毛利率
图:2012-2015年红日药业营业收入和净利润预测
表:南京健友现有、募投肝素原料药和制剂产能
图:2012-2013年江苏万邦资产、收入和利润率
Application of Heparin
Heparin Industrial Chain
Standard Requirements of Heparin Sodium API and Heparin in China
Market Size of Heparin Preparation Worldwide and YoY Growth, 2006-2012
Performance Comparison Between Low Molecular Weight Heparin Preparation and Unfractionated Heparin Preparation
Market Size of Heparin Preparations Around the Globe by Product, 2010-2012
Regional Distribution of Heparin Preparations Worldwide, 2012
Global Heparin API Demand and YoY Growth, 2007-2012
Major Heparin Preparation Producers Worldwide
Sales of Major Heparin Preparation Brands Globally, 2010-2012
Global Market Size of Heparin Preparations, 2012-2015E
Global Demand for Heparin API, 2011-2014E
Gross Margin of Major Heparin API Producers in China, 2008-2013
Capacity of Heparin Crude Products in China, 2008-2012
Export Average Price of Heparin and Salt in China, 2008-2013
Capacity, Sales Volume and Certification of Major Heparin API Enterprises in China, 2012
Export Volume and Export Value of Heparin and Its Salts in China, 2008-2013
Export Price of Heparin and Its Salts in China, 2008-2013
Top 10 Export Destinations of China’s Heparin and Its Salts by Export Value, 2012-2013
Top 10 Export Enterprises of Heparin and Its Salts in China by Export Value, 2012
Import Volume, Import Value and Unit Price of Heparin and Its Salts in China, 2008-2012
Heparin Sodium API Projects Proposed/Under Construction in China as of Jun. 2013
Market Size of Heparin Preparations in China and YoY Growth, 2007-2012
Market Share of Heparin Preparations in China by Product, 2012
Market Size of Low Molecular Weight Heparin Preparation in China, 2009-2012
Major Heparin Sodium Preparation Enterprises in China and Their Selling Prices, 2008-2011
Market Size of Heparin Preparation in China and YoY Growth, 2012-2015
Assets and Net Income of Hepalink’s Holding Subsidiaries, H1 2013
Revenue and Profit of Hepalink, 2008-2013
Output, Sales Volume and Inventory of Hepalink’s Heparin Sodium API, 2011-2012
Revenue of Hepalink by Product, 2008-2013
Revenue of Hepalink by Region, 2008-2013
Gross Margin of Hepalink by Product, 2008-2012
R&D Costs and % of Total Revenue of Hepalink, 2009-2011
Hepalink’s Revenue from Top 5 Clients and % of Total Revenue, 2008-2013
Revenue and Operating Income of Hepalink, 2012-2015E
Assets, Revenue and Net Income of Qianhong Bio-pharma’s Subsidiaries (Holding or Joint Stock), H1 2013
Revenue and Profit of Qianhong Bio-pharma, 2008-2012
Revenue of Qianhong Bio-pharma by Product, 2008-2013
Revenue of Qianhong Bio-pharma by Region, 2008-2013
Gross Margin of Qianhong Bio-pharma by Product, 2008-2013
R&D Costs and % of Total Revenue of Qianhong Bio-pharma, 2009-2013
Capacity of Qianhong Bio-pharma’s Fund-raising Projects, 2011
Progress of Qianhong Bio-pharma’s Projects Proposed/Under Construction as of Jun. 2013
Qianhong Bio-pharma’s Procurement from Top 5 Suppliers and Revenue from Top 5 Clients, 2009-2013
Revenue and Gross Margin of Qianhong Bio-pharma’s Heparin Business, 2008-2013
Revenue and Operating Income of Qianhong Bio-pharma, 2011-2014
Assets, Revenue and Net Income of Dongcheng Biochemicals’ Subsidiaries (Holding or Joint Stock), H1 2012
Revenue and Profit of Dongcheng Biochemicals, 2008-2013
Operating Revenue of Dongcheng Biochemicals by Product, 2008-2013
Operating Revenue of Dongcheng Biochemicals by Region, 2008-2013
Gross Margin of Dongcheng Biochemicals by Product, 2008-2013
R&D Costs and % of Total Revenue of Dongcheng Biochemicals, 2010-2012
Progress of Dongcheng Biochemicals’ Projects under Research by the End of 2012
Output, Sales Volume and Inventory of Dongcheng Biochemicals’ Heparin Sodium, 2011-2012
Revenue and Gross Margin of Dongcheng Biochemicals’ Heparin Sodium API, 2008-2013
Price of Dongcheng Biochemicals’ Heparin Sodium API, 2009-2011
Revenue Contribution of Top 5 Clients of Dongcheng Biochemicals’ Heparin Sodium API Business, 2009-2011
Revenue and Profit of Dongcheng Biochemicals, 2012-2015E
Revenue and Profit of Changshan Pharmaceutical, 2008-2013
Output, Sales Volume and Inventory of Changshan Pharmaceutical’s Heparin Sodium API and Its Preparations, 2010-2013
Operating Revenue of Changshan Pharmaceutical by Product, 2008-2013
Revenue of Changshan Pharmaceutical by Region, 2008-2013
Gross Margin of Changshan Pharmaceutical by Product, 2008-2013
R&D Costs and % of Total Revenue of Changshan Pharmaceutical, 2009-2013
Progress of Changshan Pharmaceutical’s Products under Research as of Jun. 2013
Name List and Revenue Contribution of Changshan Pharmaceutical’s Top 5 Clients, 2012
Name List and Revenue Contribution of Changshan Pharmaceutical’s Top 5 Clients, H1 2013
Name List and Procurement of Changshan Pharmaceutical’s Top 5 Suppliers, H1 2013
Revenue and Net Income of Changshan Pharmaceutical, 2012-2015E
Output, Sales Volume and Inventory of Chase Sun Pharmaceutical’s Finished Drug Products, 2011-2012
Revenue and Profit of Chase Sun Pharmaceutical, 2008-2013
Operating Revenue of Chase Sun Pharmaceutical by Product, 2008-2013
Revenue of Chase Sun Pharmaceutical by Region, 2008-2013
Gross Margin of Chase Sun Pharmaceutical by Product, 2008-2013
R&D Costs and % of Total Revenue of Chase Sun Pharmaceutical, 2009-2012
Name List and Revenue Contribution of Chase Sun Pharmaceutical’s Top 5 Clients, 2011
Name List and Procurement of Chase Sun Pharmaceutical’s Top 5 Suppliers, 2011
Revenue and Gross Margin of Chase Sun Pharmaceutical’s Heparin Business, 2008-2013
Revenue and Net Income of Chase Sun Pharmaceutical, 2012-2015E
Existing and Fund-raised Heparin API and Preparation Capacities of Nanjing King-friend
Assets, Revenue and Profit Margin of Jiangsu Wanbang, 2012-2013
如果这份报告不能满足您的要求,我们还可以为您定制报告,请 留言说明您的详细需求。
|