|
|
|
报告导航:研究报告—
农业与食品—食品饮料
|
|
2013-2015年中国食品安全检测行业研究报告 |
 |
字数:3.2万 |
页数:98 |
图表数:119 |
|
中文电子版:8000元 |
中文纸版:4000元 |
中文(电子+纸)版:8500元 |
|
英文电子版:2200美元 |
英文纸版:2300美元 |
英文(电子+纸)版:2500美元 |
|
编号:LT008
|
发布日期:2013-10 |
附件:无 |
 |
|
|
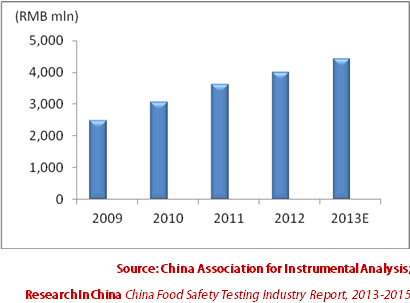
中国食品安全检测行业于20世纪初以农畜产品检验起步。随着中国食品安全相关的法规条例出台和食品安全监管力度的逐渐加大,中国食品安全检测行业迅速发展。2009-2012年中国食品安全检测市场规模年均增速达到约20%。2012年市场规模为40.1亿元,同比增长11.1%,预计2013年行业规模将达到44.11亿元。 图:2008-2013年中国食品安全检测行业市场规模
目前国有检测机构仍是中国食品安全检测市场主要力量,2012年占据了53%以上的市场份额。外资检测机构利用其雄厚的技术和资金实力,以及强大的品牌和市场认知度,占据中国食品安全检测35%左右份额,并且国际上主要的大型第三方检测机构都以独资或合资的方式进入了中国市场。 Intertek(天祥)在1989年成为第一家进入中国的国际第三方测试和认证公司,2012年Intertek消费品检测业务实现营收3.5亿欧元,营收占比达17%。1991年,SGS与质监局旗下企业成立合资公司-通标标准技术服务有限公司;SGS的食品安全检测业务主要体现在其农产品检测和消费品检测两大业务分支中,2012年公司农产品检测和消费品检测合计实现营收13.1亿瑞士法郎,同比增长15.9%。 必维集团于2000年在中国设立全资子公司-上海欧亚电气技术咨询服务有限公司;必维向零售供应商提供BRC/IFS食品标准认证,2012年公司消费品业务实现营收4.43亿欧元,同比增长16.8%。 中国民营第三方检测虽然起步较晚,资本实力也较弱,不过成长很快,已经初步形成一定规模。特别是在一些沿海大城市,涌现出一批有代表性的企业。华测检测是中国食品安全检测市场的龙头企业。公司食品事业部成立于2005年,是国内最大的非政府食品检测机构之一。目前,华测检测在深圳、上海、青岛等地设有食品检测实验室,均取得了中国合格评定国家认可委员会(CNAS)认可及计量认证CMA资质。2012年公司消费品检测业务实现营收1.7亿元,同比增长29.5%,占公司营业收入比例为27.5%。 水清木华研究中心《2013年中国广告行业研究报告》主要包括以下几个内容:● 中国食品安全检测行业运行环境(包括政策环境、全球食品安全检测市场发展及国际标杆企业运营)分析等;
● 中国食品安全检测行业发展现状、市场供需、竞争格局及发展机遇与趋势分析等;
● 中国食品工业发展现状、细分市场(乳制品、食用油、酒及饮料、肉制品和水产品)分析等;
● 中国食品安全检测市场9家相关企业(包括华测检测、天瑞仪器、达安基因、远望谷、达华智能、华宇软件、中瑞思创、新大陆及聚光科技)经营状况及食品安全检测业务分析等。
China food safety testing industry started from testing of agricultural
and livestock products in the early 1900s. With the issuance of Chinese
food safety related laws and regulations as well as the enhancement of
food safety supervision, China food safety testing industry has
developed rapidly. In 2009-2012, China food safety testing market grew
at the average annual growth rate of 20%. In 2012, the market value hit
RMB4.01 billion, reflecting a year-on-year increase of 11.1%. And the
figure is expected to be RMB4.411 billion in 2013. China Food Safety Testing Market Size, 2008-2013
Currently,
state-owned detection institutions are still the main force in Chinese
food safety testing market, occupying more than 53% market in 2012.
Foreign testing organizations seize about 35% market share in China by
virtue of solid technical and financial strength, as well as strong
brand and market awareness. Leading global third-party testing
institutions have tapped into Chinese market by sole proprietorship or
joint venture. Intertek set foot in China in 1989 as the first
international third-party testing and certification company. In 2012,
Intertek achieved the revenue of EUR350 million from consumer goods
testing business, accounting for 17% of the total revenue. In 1991, SGS
and a company under Quality Supervision Bureau set up a joint venture
------ SGS-CSTC Standards Technical Services Co., Ltd.; SGS's food
safety testing business is mainly reflected in its agricultural testing
and consumer goods testing business, which generated revenue of CHF1.31
billion with the year-on-year growth of 15.9% in 2012. Bureau
Veritas set up a wholly-owned subsidiary ------ LCIE CHINA Company
Limited in China in 2000. Bureau Veritas provides retail suppliers with
BRC / IFS Food Standard Certification. In 2012, the company attained
revenue of EUR443 million from consumer products, up 16.8% year on year. Chinese
private third-party testing companies has been growing quickly and
formed a certain scale, despite they started late with weak capital
strength. Especially in some coastal cities, a number of representative
companies have emerged. Centre Testing International is a giant
in Chinese food safety testing market. As the nation's largest
non-government food testing agency, the company established its Food
Division in 2005. Currently, Centre Testing International has founded
food testing laboratories in Shenzhen, Shanghai, Qingdao and other
places, with recognition, certification and CMA qualification of China
National Accreditation Service for Conformity Assessment (CNAS). In
2012, the company’s consumer goods testing business contributed revenue
of RMB170 million, rising by 29.5% year on year and accounting for 27.5%
of the total revenue. The report consists of the following aspects:
The operating environments of China food safety testing industry
(including policies, the development of the global food safety testing
market and the operation of international well-known enterprises);
Current situation, market supply and demand, competition patterns,
development opportunities and trends of China food safety testing
industry;
Status quo and market segments (dairy products, edible oil, wine and
beverages, meat products and aquatic products) of China food industry;
Operation and food safety testing business of nine Chinese food safety
testing companies (including Centre Testing International, Skyray
Instrument, DaAn Gene, Invengo, Tatwah Smartech, Thunisoft, Hangzhou
Century, Newland and FPI).
第一章 食品安全检测行业概述
1.1 定义及分类
1.2 产业链分析
第二章 中国食品安全检测运行环境分析
2.1政策环境
2.2 国际市场环境
2.2.1 全球食品安全检测市场现状
2.2.2 国际标杆企业分析
第三章 中国食品安全检测行业发展分析
3.1 发展现状
3.2 市场供需
3.3 竞争格局
3.4 发展机遇与趋势
3.3.1 机遇
3.3.2 去行政化趋势
第四章 食品工业对中国食品安全检测市场影响
4.1 食品制造行业现状
4.1.1 行业规模
4.1.2 盈利分析
4.2 食品制造细分市场分析
4.2.1 乳制品
4.2.2 食用油
4.2.3 酒及饮料
4.2.4 肉制品
4.2.5 水产品
4.3食品工业发展前景及挑战
第五章 中国食品安全检测行业主要企业
5.1 华测检测
5.1.1 企业简介
5.1.2 经营情况
5.1.3 营收构成
5.1.4 食品安全检测业务
5.1.5 毛利率
5.1.6 客户与供应商
5.1.7 预测与展望
5.2 天瑞仪器
5.2.1 企业简介
5.2.2 经营情况
5.2.3 营收构成
5.2.4 食品安全检测业务
5.2.5 毛利率
5.2.6 客户与供应商
5.2.7 预测与展望
5.3 达安基因
5.3.1 企业简介
5.3.2 经营情况
5.3.3 营收构成
5.3.4 食品安全检测业务
5.3.5 毛利率
5.3.6 客户与供应商
5.3.7 预测与展望
5.4 远望谷
5.4.1 企业简介
5.4.2 运营情况
5.4.3 营收构成
5.4.4 食品安全检测业务
5.4.5 毛利率
5.4.6 客户与供应商
5.4.7 预测与展望
5.5 达华智能
5.5.1 公司简介
5.5.2 运营情况
5.5.3 营收构成
5.5.4 食品安全检测业务
5.5.5 毛利率
5.5.6 客户与供应商
5.5.7 预测与展望
5.6 华宇软件
5.6.1 公司简介
5.6.2 运营情况
5.6.3 营收构成
5.6.4 食品安全检测业务
5.6.5 毛利率
5.6.6 客户与供应商
5.6.7 预测与展望
5.7 中瑞思创
5.7.1 企业简介
5.7.2 经营情况
5.7.3 营收构成
5.7.4 食品安全检测业务
5.7.5 毛利率
5.7.6 客户和供应商
5.7.7 预测与展望
5.8 新大陆
5.8.1 企业简介
5.8.2 经营情况
5.8.3 营收构成
5.8.4 食品安全检测业务
5.8.5 毛利率
5.8.6 客户和供应商
5.8.7 预测与展望
5.9 聚光科技
5.9.1 企业简介
5.9.2 经营情况
5.9.3 营收构成
5.9.4食品安全检测业务
5.9.5 毛利率
5.9.6 客户和供应商
5.9.7 预测与展望
1 Overview of Food Safety Testing Industry
1.1 Definition and Classification
1.2 Industry Chain
2 Operating Environments of Chinese Food Safety Testing
2.1 Policy
2.2 International Market
2.2.1 Status Quo
2.2.2 Representative Enterprises
3 Development of China Food Safety Testing Industry
3.1 Status Quo
3.2 Market Supply and Demand
3.3 Competition Pattern
3.4 Opportunities and Trends
3.3.1 Opportunities
3.3.2 De-administration Trend
4 Impact of Food Industry on Chinese Food Safety Testing Market
4.1 Status Quo of Food Manufacturing Industry
4.1.1 Scale
4.1.2 Profit
4.2 Food Manufacturing Market Segments
4.2.1 Dairy Products
4.2.2 Edible Oil
4.2.3 Wine and Beverages
4.2.4 Meat Products
4.2.5 Aquatic products
4.3 Development Prospects and Challenges of Food Industry
5 Major Companies in China Food Safety Testing Industry
5.1 Centre Testing International
5.1.1 Profile
5.1.2 Operation
5.1.3 Revenue Structure
5.1.4 Food Safety Testing Business
5.1.5 Gross Margin
5.1.6 Clients and Suppliers
5.1.7 Forecast and Outlook
5.2 Skyray Instrument
5.2.1 Profile
5.2.2 Operation
5.2.3 Revenue Structure
5.2.4 Food Safety Testing Business
5.2.5 Gross Margin
5.2.6 Clients and Suppliers
5.2.7 Forecast and Outlook
5.3 DaAn Gene
5.3.1 Profile
5.3.2 Operation
5.3.3 Revenue Structure
5.3.4 Food Safety Testing Business
5.3.5 Gross Margin
5.3.6 Clients and Suppliers
5.3.7 Forecast and Outlook
5.4 Invengo
5.4.1 Profile
5.4.2 Operation
5.4.3 Revenue Structure
5.4.4 Food Safety Testing Business
5.4.5 Gross Margin
5.4.6 Clients and Suppliers
5.4.7 Forecast and Outlook
5.5 Tatwah Smartech
5.5.1 Profile
5.5.2 Operation
5.5.3 Revenue Structure
5.5.4 Food Safety Testing Business
5.5.5 Gross Margin
5.5.6 Clients and Suppliers
5.5.7 Forecast and Outlook
5.6 Thunisoft
5.6.1 Profile
5.6.2 Operation
5.6.3 Revenue Structure
5.6.4 Food Safety Testing Business
5.6.5 Gross Margin
5.6.6 Clients and Suppliers
5.6.7 Forecast and Outlook
5.7 Hangzhou Century
5.7.1 Profile
5.7.2 Operation
5.7.3 Revenue Structure
5.7.4 Food Safety Testing Business
5.7.5 Gross Margin
5.7.6 Clients and Suppliers
5.7.7 Forecast and Outlook
5.8 Newland
5.8.1 Profile
5.8.2 Operation
5.8.3 Revenue Structure
5.8.4 Food Safety Testing Business
5.8.5 Gross Margin
5.8.6 Clients and Suppliers
5.8.7 Forecast and Outlook
5.9 FPI
5.9.1 Profile
5.9.2 Operation
5.9.3 Revenue Structure
5.9.4 Food Safety Testing Business
5.9.5 Gross Margin
5.9.6 Clients and Suppliers
5.9.7 Forecast and Outlook
图:食品安全检测分类
图:食品安全检测行业产业链
表:2005-2013年主要食品安全事件
表:2008-2013年食品安全相关重要法规条例
表:中国主要食品安全行政监管部门
图:2011-2018年全球食品安全检测市场规模
图:2012/2018年全球食品安全检测(分检测物)市场规模
图:2011年全球食品安全检测市场份额
图:2009-2012年全球RFID市场规模及出货量
图:2009-2012年全球RFID市场(分产品)营收占比
图:2009-2013年SGS营业收入及净利润
图:2009-2013年SGS农产品检测服务营业收入
图: 2009-2013年SGS消费品检测服务营业收入
图:2009-2013年Bureau Veritas营业收入及营业利润
图:2009-2013年Bureau Veritas(分地区)营收占比
图:2009-2013年Bureau Veritas消费品检测营业收入
图:2009-2013年Intertek营业收入及净利润
图:2012年Intertek(分业务)营收构成
表:Intertek食品和农产品检测服务
图:2008-2015年中国检测行业市场规模及增速
图:2009-2013年中国食品安全检测行业市场规模
图:20007-2012年中国RFID标签与封装市场规模
图:2012/2015年中国检测市场结构
图:2002-2013年中国食品制造市场规模
图:2002-2013年中国食品制造行业利润总额
表:2010-2013年中国乳制品行业相关政策
图:2004-2013年中国乳制品产量
图:2009-2013年国外奶粉品牌价格
图:2001-2012年中国农村居民人均乳制品消费量
图:2003-2012年中国精制食用植物油产量及增速
图:2012年中国精制食用植物油(分产品)产量结构
图:2004/05-2012/13年中国食用植物油需求量
图:2008/09-2012/13年中国食用植物油(分产品)需求结构
图:2000-2013年中国白酒产量
图:2000-2013年中国软饮料产量
图:1982-2012年中国肉类产量
图:2012年中国肉类消费结构
图:1990-2012年中国城镇及农村人均肉类消费量
图:1990-2011年中国肉类/水产品产量
图:2006-2011年中国水产品(分种类)产量
图:2005-2011年中国水产品人工养殖产量及占比
图:2008-2013年华测检测营业收入及净利润
图:2008-2013年华测检测(分产品)营收占比
图:2008-2013年华测检测(分地区)营收占比
表:华测检测主要食品安全检测服务
图:2008-2013年华测检测毛利率
图:2008-2013年华测检测(分产品)毛利率
图:2009-2012年华测检测前五名客户营收贡献及占比
图:2009-2012年华测检测前五名供应商采购金额及占比
图:2012-2015年华测检测营业收入及净利润
图:2012-2015年华测检测(分产品)营业收入
图:2008-2013年天瑞仪器营业收入及净利润
图:2008-2013年天瑞仪器(分产品)营收占比
图:2009-2013年天瑞仪器(分地区)营收占比
表:天瑞仪器主要食品安全检测产品及应用
图:2008-2013年天瑞仪器毛利率
图:2008-2013年天瑞仪器(分产品)毛利率
图:2009-2012年天瑞仪器前五名客户营收贡献及占比
图:2009-2012天瑞仪器前五名供应商采购金额及占比
图:2012-2015年天瑞仪器营业收入及净利润
图:2008-2013年达安基因营业收入及净利润
图:2009-2013年达安基因(分产品)营收占比
图:2009-2013年达安基因(分地区)营收占比
图:2009-2012年广东达元营业收入及净利润
图:2008-2013年达安基因毛利率
图:2008-2013年达安基因(分产品)毛利率
图:2009-2012年达安基因前五名客户营收贡献及占比
图:2009-2012达安基因前五名供应商采购金额及占比
图:2012-2015年达安基因营业收入及净利润
图:2008-2013年远望谷营业收入及净利润
图:2009-2013年远望谷(分产品)营收占比
图:2008-2013年远望谷(分地区)营业收入
图:2008-2013年远望谷毛利率
图:2008-2013年远望谷(分产品)毛利率
图:2009-2012年远望谷前五名客户营收贡献及占比
图:2009-2012远望谷前五名供应商采购金额及占比
图:2012-2015年远望谷营业收入及净利润
图:2008-2013年达华智能营业收入及净利润
图:2008-2013年达华智能(分产品)营收占比
图:2009-2013年达华智能(分地区)营收占比
图:2008-2013年达华智能毛利率
表:2008-2013年达华智能(分产品)毛利率
图:2009-2012年达华智能前五名客户营收贡献及占比
图:2009-2012达华智能前五名供应商采购金额及占比
图:2012-2015年达华智能营业收入及净利润
图:2008-2013年华宇软件营业收入及净利润
图:2008-2013年华宇软件(分产品)营收占比
图:2008-2013年华宇软件(分地区)营收占比
表:航宇金信主要食品安全类服务系统
图:2008-2013年华宇软件毛利率
图:2008-2013年华宇软件(分产品)毛利率
图:2009-2012年华宇软件前五名客户营收贡献及占比
图:2009-2012华宇软件前五名供应商采购金额及占比
图:2012-2015年华宇软件营业收入及净利润
图:2008-2013年中瑞思创营业收入和净利润
图:2008-2013年中瑞思创(分产品)营收构成
图:2008-2013年中瑞思创(分地区)营收构成
图:2012-2015年中瑞思创RFID产品营业收入
图:2008-2013年中瑞思创毛利率
表:2008-2013年中瑞思创(分产品)毛利率
图:2009-2012年中瑞思创前五名客户营收贡献及占比
图:2009-2012中瑞思创前五名供应商采购金额及占比
图:2012-2015年中瑞思创营业收入及净利润
图:2008-2013年新大陆营业收入及利润总额
图:2009-2013年新大陆(分产品)营收构成
图:2009-2013年新大陆(分地区)营收占比
图:2008-2013年新大陆毛利率
表:2009-2013年新大陆(分产品)毛利率
图:2009-2012年新大陆前五名客户营收占比
图:2009-2012新大陆前五名供应商采购金额占比
图:2012-2015年新大陆营业收入及净利润
图:2008-2013年聚光科技营业收入及净利润
图:2009-2013年聚光科技(分产品)营收构成
图:2009-2013年聚光科技(分地区)营收占比
图:2008-2013年聚光科技毛利率
表:2008-2013年聚光科技(分产品)毛利率
图:2009-2012年聚光科技前五名客户营收贡献及占比
图:2009-2012聚光科技前五名供应商采购金额及占比
图:2012-2015年聚光科技营业收入及净利润
Food Safety Testing Categories
Food Safety Testing Industry Chain
Major Food Safety Incidents, 2005-2013
Important Laws and Regulations Related to Food Safety, 2008-2013
Main Food Safety Administrative Supervision Departments in China
Global Food Safety Testing Market Size, 2011-2018
Global Food Safety Testing Market Size (by Testing Object), 2012/2018
Global Food Safety Testing Market Share, 2011
Global RFID Market Size and Shipment, 2009-2012
Global RFID Revenue Structure (by Product), 2009-2012
SGS Revenue and Net Income, 2009-2013
Agricultural Testing Revenue of SGS, 2009-2013
Consumer Goods Testing Revenue of SGS, 2009-2013
Revenue and Operating Income of Bureau Veritas, 2009-2013
Revenue Structure of Bureau Veritas (by Region), 2009-2013
Consumer Goods Testing Revenue of Bureau Veritas, 2009-2013
Intertek’s Revenue and Net Income, 2009-2013
Intertek’s Revenue Structure (by Business), 2012
Intertek’s Food and Agricultural Testing Services
Chinese Testing Market Size and Growth Rate, 2008-2015E
Chinese Food Safety Testing Market Size, 2009-2013
China RFID Tag and Packaging Market Size, 20007-2012
Chinese Testing Market Structure, 2012/2015
Chinese Food Manufacturing Market Size, 2002-2013
Total Profit of China Food Manufacturing Industry, 2002-2013
Policies of China Dairy Industry, 2010-2013
China's Dairy Output, 2004-2013
Milk Powder Prices of Foreign Brands, 2009-2013
Per Capita Dairy Products Consumption of Chinese Rural Residents, 2001-2012
China's Refined Edible Vegetable Oil Output and Growth Rate, 2003-2012
China's Refined Edible Vegetable Oil Output Structure (by Product), 2012
China's Demand for Edible Vegetable Oil, 2004/05-2012/13
China's Edible Vegetable Oil Demand Structure (by Product), 2008/09-2012/13
China's Liquor Output, 2000-2013
China's Soft Drink Output, 2000-2013
China's Meat Output, 1982-2012
China’s Meat Consumption Structure, 2012
Per Capita Meat Consumption in Urban and Rural Area of China, 1990-2012
Output of Meat / Aquatic Products in China, 1990-2011
Output of Aquatic Products (by Species) in China, 2006-2011
Farmed Aquatic Products Output and Proportion in China, 2005-2011
Revenue and Net Income of Centre Testing International, 2008-2013
Revenue Structure of Centre Testing International (by Product), 2008-2013
Revenue Structure of Centre Testing International (by Region), 2008-2013
Major Food Safety Testing Services of Centre Testing International
Gross Margin of Centre Testing International, 2008-2013
Gross Margin of Centre Testing International (by Product), 2008-2013
Revenue of Centre Testing International from Top 5 Clients and % of Total Revenue, 2009-2012
Procurement of Centre Testing International from Top 5 Suppliers and % of Total Procurement,2009-2012
Revenue and Net Income of Centre Testing International, 2012-2015E
Revenue of Centre Testing International (by Product), 2012-2015E
Revenue and Net Income of Skyray Instrument, 2008-2013
Revenue Structure of Skyray Instrument (by Product), 2009-2013
Revenue Structure of Skyray Instrument (by Region), 2009-2013
Major Food Safety Testing Products and Applications of Skyray Instrument
Gross Margin of Skyray Instrument, 2008-2013
Gross Margin of Skyray Instrument (by Product), 2008-2013
Revenue of Skyray Instrument from Top 5 Clients and % of Total Revenue, 2009-2012
Procurement of Skyray Instrument from Top 5 Suppliers and % of Total Procurement, 2009-2012
Revenue and Net Income of Skyray Instrument, 2012-2015E
Revenue and Net Income of DaAn Gene, 2008-2013
Revenue Structure of DaAn Gene (by Product), 2009-2013
Revenue Structure of DaAn Gene (by Region), 2009-2013
Revenue and Net Income of Guangzhou Dayuan, 2009-2012
Gross Margin of DaAn Gene, 2008-2013
Gross Margin of DaAn Gene (by Product), 2008-2013
Revenue of DaAn Gene from Top 5 Clients and % of Total Revenue, 2009-2012
Procurement of DaAn Gene from Top 5 Suppliers and % of Total Procurement, 2009-2012
Revenue and Net Income of DaAn Gene, 2012-2015E
Invengo’s Revenue and Net Income, 2008-2013
Invengo’s Revenue Structure (by Product), 2009-2013
Invengo’s Revenue (by Region), 2008-2013
Invengo’s Gross Margin, 2008-2013
Invengo’s Gross Margin (by Product), 2008-2013
Invengo’s Revenue from Top 5 Clients and % of Total Revenue, 2009-2012
Invengo’s Procurement from Top 5 Suppliers and % of Total Procurement,2009-2012
Invengo’s Revenue and Net Income, 2012-2015E
Revenue and Net Income of Tatwah Smartech, 2008-2013
Revenue Structure of Tatwah Smartech (by Product), 2008-2013
Revenue Structure of Tatwah Smartech (by Region), 2009-2013
Gross Margin of Tatwah Smartech, 2008-2013
Gross Margin of Tatwah Smartech (by Product), 2008-2013
Revenue of Tatwah Smartech from Top 5 Clients and % of Total Revenue, 2009-2012
Procurement of Tatwah Smartech from Top 5 Suppliers and % of Total Procurement, 2009-2012
Revenue and Net Income of Tatwah Smartech, 2012-2015E
Thunisoft’s Revenue and Net Income, 2008-2013
Thunisoft’s Revenue Structure (by Product), 2008-2013
Thunisoft’s Revenue Structure (by Region), 2008-2013
Major Food Safety Service Systems of Hangyu Jinxin
Thunisoft’s Gross Margin, 2008-2013
Thunisoft’s Gross Margin (by Product), 2008-2013
Thunisoft’s Revenue from Top 5 Clients and % of Total Revenue, 2009-2012
Thunisoft’s Procurement from Top 5 Suppliers and % of Total Procurement,2009-2012
Thunisoft’s Revenue and Net Income, 2012-2015E
Revenue and Net Income of Hangzhou Century, 2008-2013
Revenue Structure of Hangzhou Century (by Product), 2008-2013
Revenue Structure of Hangzhou Century (by Region), 2008-2013
RFID Revenue of Hangzhou Century, 2012-2015E
Gross Margin of Hangzhou Century, 2008-2013
Gross Margin of Hangzhou Century (by Product), 2008-2013
Revenue of Hangzhou Century from Top 5 Clients and % of Total Revenue, 2009-2012
Procurement of Hangzhou Century from Top 5 Suppliers and % of Total Procurement,2009-2012
Revenue and Net Income of Hangzhou Century, 2012-2015E
Newland’s Revenue and Total Profit, 2008-2013
Newland’s Revenue Structure (by Product), 2009-2013
Newland’s Revenue Structure (by Region), 2009-2013
Newland’s Gross Margin, 2008-2013
Newland’s Gross Margin (by Product), 2009-2013
Newland’s Revenue Percentage from Top 5 Clients, 2009-2012
Newland’s Procurement Percentage from Top 5 Suppliers, 2009-2012
Newland’s Revenue and Net Income, 2012-2015E
FPI’s Revenue and Net Income, 2008-2013
FPI’s Revenue Structure (by Product), 2009-2013
FPI’s Revenue Structure (by Region), 2009-2013
FPI’s Gross Margin, 2008-2013
FPI’s Gross Margin (by Product), 2008-2013
FPI’s Revenue from Top 5 Clients and % of Total Revenue, 2009-2012
FPI’s Procurement from Top 5 Suppliers and % of Total Procurement,2009-2012
FPI’s Revenue and Net Income, 2012-2015E
如果这份报告不能满足您的要求,我们还可以为您定制报告,请 留言说明您的详细需求。
|