|
|
|
报告导航:研究报告—
生命科学—制药医疗
|
|
2013-2015年中国大输液行业研究报告 |
 |
字数:2.3万 |
页数:69 |
图表数:94 |
|
中文电子版:6500元 |
中文纸版:3250元 |
中文(电子+纸)版:7000元 |
|
英文电子版:1800美元 |
英文纸版:1900美元 |
英文(电子+纸)版:2100美元 |
|
编号:ZYM050
|
发布日期:2013-11 |
附件:下载 |
 |
|
|
在中国医疗改革和医药市场持续发展的大环境下,大输液作为中国药品五大制剂之一,近年产需保持逐年增长。2006-2012年中国大输液产量年均复合增长率达到19.2%。但是由于行业壁垒不高,中国大输液产能已出现过剩趋势,总产能超过需求的40%左右。 产能过剩、竞争激烈主要是由于中国输液产品的品种结构不合理,同质化严重所致。如低附加值的体液平衡输液产品,其产销量占总输液市场的89%,而销售额占比仅47%。与此同时,氨基酸、脂肪乳双腔袋,氨基酸、脂肪乳、葡萄糖三腔全合一肠外营养输液,羟乙基淀粉以及独家中药品种等输液产品市场需求则相当强劲。 中国大输液市场集中度较欧美日等发达国家,仍较低。目前中国具有大输液资质企业400多家,正常运营的200家左右。按产量计,中国前10企业占比65%左右;按销售额计,占比40%左右。与化学制剂的其它细分行业一样,中国大输液行业高端市场仍被外资药企占领,如日本大冢、德国费森尤斯卡比、美国百特等。
以脂肪乳产品为例。脂肪乳是中国近年主要进口的血液和造血系统药物,连续多年居中国22城市典型医院进口药品排名前列。其中,中长链脂肪乳在2012年中国典型医院进口药品的购药金额为3.54亿元。脂肪乳输液的中国主要供应商有科伦药业、华瑞制药(隶属费森尤斯卡比)和广州百特侨光(隶属百特)等,2012年这三家产量分别达1419万瓶/袋、810万瓶/袋(包括中/长脂肪乳)、569万瓶/袋(中/长脂肪乳)。 《2013-2015年中国大输液行业研究报告》主要包括以下几方面内容:
- 中国大输液市场现状、竞争格局、产品结构、区域分布、发展预测等;
- 中国体液平衡输液、治疗用输液、营养用输液、血容量扩张用输液以及腹膜透析液等细分市场现状、竞争格局等;
- 科伦生物、华润双鹤、丰源药业、华仁药业、西南药业、利君国际等10家企业的运营状况、大输液业务及发展前景等。
Under the context of China's medical reform and sustainable development of the pharmaceutical market, the output and demand of Large Volume Parenteral (LVP) which is one of the top five Chinese preparations have grown year by year. In 2006-2012, China’s injection output presented the CAGR of 19.2%. However, due to the low barriers to entry, China has seen some signs of the surplus injection capacity, which exceeds the demand by roughly 40%.
Overcapacity and fierce competition are caused by the irrational injection product structure and homogeneity. For example, the output and sales volume of fluid balance injection products with low added value account for 89% of the injection market, but the sales revenue only shares 47%. At the same time, the market demand for amino acids and fat emulsion dual-chamber bags, amino acids fat emulsion and glucose three-cavity all-in-one parenteral nutrition injections, hydroxyethyl starch and unique traditional Chinese medicine injection is quite strong.
Compared to Europe and other developed countries, the concentration degree of Chinese LVP market is still lower. At present, 200 ones of 400 qualified Chinese LVP enterprises run business soundly. By output, the top 10 Chinese companies contribute about 65%; in terms of sales revenue, they devote about 40 %.
Like other chemical preparation segments, Chinese high-end LVP market is still dominated by foreign pharmaceutical companies such as Japan Otsuka, Germany Fresenius Kabi, and USA Baxter.
 Take fat emulsion products for example. Fat emulsion is imported by China frequently as a blood and hematopoietic system drug in recent years, with its import volume having been at the high level of typical urban hospitals in 22 Chinese cities for consecutive years. Particularly, the procurement value of moderate and long-chain fat emulsion imported by Chinese typical hospitals hit RMB354million. In China, fat emulsion injection suppliers include Kelun Pharma, Sino-Swed Pharmaceutical Corp, Ltd. (under Fresenius Kabi) and Guangzhou Baxter Qiaoguang (under Baxter) with the respective output of 14.19 million bottles/bags, 8.1 million bottles / bags (including medium/long-chain fat emulsion) and 5.69 million bottles/bags (medium/long-chain fat emulsion) in 2012. The report highlights the followings:  Status quo, competition patterns, product structure, regional distribution and development forecast of Chinese LVP market; Status quo and competition patterns of fluid balance injection, therapeutic injection, nutrition injection, injection for blood volume expansion and peritoneal dialysis fluid injection and other market segments; Operation, LVP business and prospects of 10 companies including Kelun Pharma, China Resources Double-Crane, Fengyuan Pharmaceutical, Huaren Pharmaceutical, Southwest Pharmaceutical and Lijun International Pharmaceutical.
第一章 大输液概况
1.1 定义及分类
1.2 产业链
第二章 中国大输液行业发展概况
2.1 发展现状
2.2 竞争格局
2.3 产品结构
2.4 区域分布
第三章 中国大输液细分市场分析
3.1 体液平衡用输液
3.2 治疗用输液
3.3 营养用输液
3.3.1 果糖输液
3.3.2 氨基酸输液
3.3.3 脂肪乳输液
3.4 血容量扩张用输液
3.4.1 右旋糖酐输液
3.4.2 羟乙基淀粉输液
3.5 复膜透析液
第四章 主要生产企业
4.1 科伦药业
4.1.1 公司简介
4.1.2 经营状况
4.1.3 营收构成
4.1.4 毛利率
4.1.5 客户与供应商
4.1.6 研发与投资
4.1.7 大输液业务
4.1.8 发展预测
4.2 华润双鹤
4.2.1 公司简介
4.2.2 经营状况
4.2.3 营收构成
4.2.4 毛利率
4.2.5 主要客户
4.2.6 大输液业务
4.2.7 发展预测
4.3 丰原药业
4.3.1 公司简介
4.3.2 经营状况
4.3.3 营收构成
4.3.4 毛利率
4.3.5 客户与供应商
4.3.6 大输液业务
4.3.7 发展预测
4.4 华仁药业
4.4.1 公司简介
4.4.2 经营状况
4.4.3 营收构成
4.4.4 毛利率
4.4.5 客户与供应商
4.4.6 研发与投资
4.4.7 发展预测
4.5 西南药业
4.5.1 公司简介
4.5.2 经营状况
4.5.3 营收构成
4.5.4 毛利率
4.5.5 主要客户
4.5.6 大输液业务
4.5.7 发展预测
4.6 利君国际
4.6.2 经营状况
4.6.3 石家庄四药
4.7 金健米业
4.7.1 公司简介
4.7.2 经营状况
4.7.3 金健药业
4.8 其他企业
4.8.1 青州尧王制药有限公司
4.8.2 吉林都邦药业股份有限公司
4.8.3 辰欣药业股份有限公司
4.8.4 中国大冢制药有限公司
第五章 中国大输液行业总结与发展预测
5.1 大输液市场规模持续增长,但产能增速将放缓
5.2 大输液行业集中度不断提高,大企业竞争优势突显
5.3 产品结构升级,开发新型输液产品是未来发展趋势
1 Overview of LVP
1.1 Definition and Classification
1.2 Industry Chain
2 Overview of China LVP Industry Development
2.1 Status Quo
2.2 Competition Pattern
2.3 Product Structure
2.4 Regional Distribution
2. 5 Development Forecast
3 Chinese LVP Market Segments
3.1 Injection for Fluid Balance
3.2 Therapeutic Injection
3.3 Nutritious Injection
3.3.1 Fructose Injection
3.3.2 Amino Acid Injection
3.3.3 Fat Emulsion Injection
3.4 Injection for Blood Volume Expansion
3.4.1 Dextran Injection
3.4.2 Hydroxyethyl Starch Injection
3.5 Peritoneal Dialysis Solution
4 Main Companies
4.1 Kelun Pharma
4.1.1 Profile
4.1.2 Operation
4.1.3 Revenue Structure
4.1.4 Gross Margin
4.1.5 Clients and Suppliers
4.1.6 R & D and Investment
4.1.7 LVP Business
4.1.8 Development Forecast
4.2 China Resources Double-Crane
4.2.1 Profile
4.2.2 Operation
4.2.3 Revenue Structure
4.2.4 Gross Margin
4.2.5 Major Clients
4.2.6 LVP Business
4.2.7 Development Forecast
4.3 Fengyuan Pharmaceutical
4.3.1 Profile
4.3.2 Operation
4.3.3 Revenue Structure
4.3.4 Gross Margin
4.3.5 Clients and Suppliers
4.3.6 LVP Business
4.3.7 Development Forecast
4.4 Huaren Pharmaceutical
4.4.1 Profile
4.4.2 Operation
4.4.3 Revenue Structure
4.4.4 Gross Margin
4.4.5 Clients and Suppliers
4.4.6 R & D and Investment
4.4.7 Development Forecast
4.5 Southwest Pharmaceutical
4.5.1 Profile
4.5.2 Operation
4.5.3 Revenue Structure
4.5.4 Gross Margin
4.5.5 Major Clients
4.5.6 LVP Business
4.5.7 Development Forecast
4.6 Lijun International Pharmaceutical (Holding)
4.6.1 Profile
4.6.2 Operation
4.6.3 Shijiazhuang No.4 Pharmaceutical
4.7 Other Companies
4.7.1 Qingzhou Yaowang Medicine
4.7.2 Jilin Dubang Pharmaceutical
4.7.3 Shandong Lukang Cisen Pharmaceutical
4.7.4 China Otsuka Pharmaceutical
5 China LVP Industry Summary and Development Prediction
5.1 Market Size to Ascend but Capacity Growth to Slow Down
5.2 Industry Concentration to Improve and Large Players with obvious Competitive Edges
5.3 Product Structure to Upgrade and New LVP products Development to be Trend
表:大输液分类、用途及商品(按临床用途)
图:大输液产业链示意图
图:2008-2012年中国大输液产量及同比增长
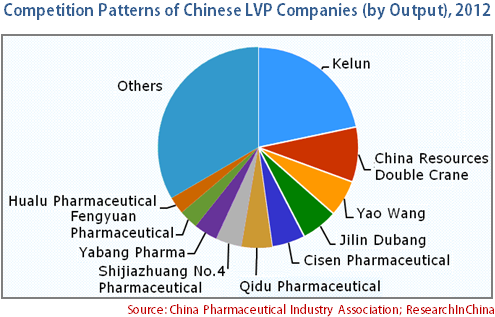
图:2012年中国大输液企业竞争格局(按产量)
表:2011年中国大输液企业竞争格局(按销量or销售额)
表:2011-2012年中国大输液前十品种及产量
图:2011年中国大输液(分产品)销售量or销售额占比
图:2007-2011年中国主要大输液品种销量or销售额增长率
图:2011-2012年中国大输液(分省市)区域分布(按产量)
图:2010-2012年中国主要体液平衡输液品种产量
表:2010-2012年中国主要治疗输液品种产量
表:2012年中国甘露醇输液(不折算)主要生产企业及其产量
表:2013年中国部分国家基本药物中标价格
表:2011-2012年中国果糖(10%,500ml)输液主要企业及其产量
表:2011-2012年甘油果糖氯化钠输液(CO 250ml)主要企业及其产量
表:2012年中国氨基酸输液品种、主要企业及其产量
表:2012年中国N(2)-L-丙胺酰-L-谷氨酰输液主要生产企业及其产量
图:2010-2012年中国N(2)-L-丙胺酰-L-谷氨酰在22城市典型医院进口药品购药金额
表:2012年中国脂肪乳输液主要生产企业及其产量
图:2010-2012年中国脂肪乳输液在22城市典型医院进口药品购药金额
表:2012年中国右旋糖苷输液主要企业及其产量
表:2012年中国羟乙基淀粉输液主要企业及其产量
图:2010-2012年中国羟乙基淀粉在22城市典型医院进口药品购药金额
图:2010-2012年腹膜透析液在中国22城市典型医院购药金额
表:2012年中国腹膜透析液主要生产企业及其产量
表:2008-2013年科伦药业营业收入与利润
表:2008-2013年科伦药业(分产品)营业收入
表:2008-2013年科伦药业(分地区)营业收入
图:2008-2013年科伦药业(分产品)毛利率
图:2008-2013年科伦药业前五客户收入及占比
图:2008-2012年科伦药业前五供应商采购金额及占比
图:2011-2013年科伦药业研发投入及占营业收入比重
图:2011-2012年科伦药业大输液产销量及库存
图:2008-2013年科伦药业的大输液业务收入与毛利率
图:2008-2013年科伦药业(分产品)大输液营业收入
图:2012-2015年科伦药业营业收入与净利润
图:2008-2013年华润双鹤营业收入与利润
图:2008-2013年华润双鹤(分产品)营业收入
表:2008-2013年华润双鹤(分地区)营业收入
表:2008-2013年华润双鹤(分产品)营业收入
图:2008-2013年华润双鹤前五客户收入及占比
表:2013上半年华润双鹤前五客户名称、收入贡献及其占比
图:2010-2012年华润双鹤输液产量
图:2008-2013年华润双鹤输液输液业务收入及毛利率
表:截止2013年6月华润双鹤在线项目进度(单位:元)
图:2012-2015年华润双鹤营业收入与净利润
表:2008-2013年丰原药业营业收入与净利润
表:2008-2013年丰原药业(分产品)营业收入
图:2008-2013年丰原药业(分地区)营业收入
表:2008-2013年丰原药业(分产品)毛利率
图:2008-2013年丰原药业前五客户收入及占营业收入比重
表:2012-2013上半年丰原药业前五客户名称、收入贡献及占比
图:2008-2013年丰原药业前五供应商采购金额及占总采购金额比重
表:2012年丰原药业前五供应商名称、采购金额及占比
图:2010-2012年丰原药业大输液产品产量
图:2012-2015年丰原药业营业收入与净利润
表:2011-2012年华仁药业大输液产销量及库存(瓶/袋)
图:2008-2013年华仁药业营业收入与净利润
表:2008-2013年华仁药业(分产品)营业收入
表:2008-2013华仁药业(分地区)营业收入
表:2008-2013年华仁药业(分产品)营业收入
图:2008-2013年华仁药业前五客户收入及占比
表:2013上半年华仁药业前五供应商名称、采购金额及占比
图:2008-2013年华仁药业前五供应商采购金额及占比
表:2013上半年华仁药业前五客户名称、收入贡献及占比
图:2008-2013年华仁药业研发投入及占营业收入比重
表:截止2013年华仁药业主要研发项目进度
图:2012-2015年华仁药业营业收入与净利润
表:2008-2013年西南药业营业收入与净利润
表:2008-2013年西南药业(分产品)主营业收入
图:2008-2013年西南药业(分地区)营业收入
表:2008-2013年西南药业(分产品)毛利率
图:2008-2012年西南药业前五客户收入及占营业收入比重
表:2012年西南药业前五客户名称、收入贡献及占比
图:2008-2013年西南药业大输液业务收入与毛利率
图:2010-2012年西南药业输液产量
图:2012-2015年西南药业营业收入与净利润
图:2011-2013年利君国际营业收入
表:2011-2013年石家庄四药(分产品)营业收入
图:2008-2013年石家庄四药毛利率
图:2008-2013年金健米业营业收入与净利润
图:2010-2012年金健药业大输液产量
图:2008-2013年金健药业营业收入与毛利率
图:2010-2012年青州尧王输液产量
表:青州尧王输液类产品及价格
图:2010-2012年都邦药业大输液产量
图:2010-2012年辰欣药业大输液产量
图:2010-2012年大冢制药大输液产量
表:中国大冢制药输液主要输液产品
图:2012-2015年中国输液产需量预测
表:2011-2012年中国输液剂前10家生产企业及其产量(百万瓶/袋)
表:2008-2012年中国主要生产企业的大输液业务收入
表:2008-2013年中国主要生产企业的大输液业务毛利率
图:2015年中国大输液(分产品)销量or销售额占比预测
Classification, Application and Commodities of LVP (by Clinical Use)
LVP Industry Chain
LVP Output and YoY Growth Rate in China, 2008-2012
Competition Patterns of Chinese LVP Companies (by Output), 2012
Competition Patterns of Chinese LVP Companies (by Sales Volume or Value), 2011
Top 10 LVP Varieties and Output in China, 2011-2012
Proportion of LVP Sales Volume or Value (by Product) in China, 2011
Sales Volume / Value Growth Rate of Major LVP Varieties in China, 2007-2011
Regional Distribution of LVP (by Output) in China, 2011-2012
Major Varieties and Output of Fluid Balance Injection in China, 2010-2012
Major Varieties and Output of Therapeutic Injection in China, 2010-2012
Major Mannitol Injection Enterprises and Their Output in China, 2012
Bid Prices of Some National Essential Drugs in China, 2013
Major Fructose (10%, 500ml) Injection Enterprises and Their Output in China, 2011-2012
Major Glycerol and Fructose Sodium Chloride Injection (CO 250ml) Enterprises and Their Output in China, 2011-2012
Amino Acid Injection Varieties and Major Enterprises and Their Output in China, 2012
Major N (2)-L-propylamine acyl-L-glutamyl Injection Enterprises and Their Output in China, 2012
Purchase Costs of Imported N (2)-L-propylamine acyl-L-glutamyl of Typical Hospitals in 22 Chinese Cities, 2010-2012
Major Fat Emulsion Injection Enterprises and Their Output in China, 2012
Purchase Costs of Imported Fat Emulsion Injection of Typical Hospitals in 22 Chinese Cities, 2010-2012
Major Dextran Injection Enterprises and Their Output in China, 2012
Major Hydroxyethyl Starch Injection Enterprises and Their Output in China, 2012
Purchase Costs of Imported Hydroxyethyl Starch of Typical Hospitals in 22 Chinese Cities, 2010-2012
Purchase Costs of Peritoneal Dialysate of Typical Hospitals in 22 Chinese Cities, 2010-2012
Major Peritoneal Dialysate Enterprises and Their Output in China, 2012
Revenue and Profit of Kelun Pharma, 2008-2013
Revenue of Kelun Pharma (by Product), 2008-2013
Revenue of Kelun (by Region), 2008-2013
Gross Margin of Kelun Pharma (by Product), 2008-2013
Kelun Pharma’s Revenue from Top 5 Clients and % of Total Revenue, 2008-2013
Kelun Pharma’s Procurement from Top 5 Suppliers and % of Total Procurement, 2008-2012
R & D Costs and % of Total Revenue of Kelun Pharma, 2011-2013
LVP Output, Sales Volume and Inventory of Kelun Pharma, 2011-2012
LVP Revenue and Gross Margin of Kelun Pharma, 2008-2013
LVP Revenue of Kelun (by Product), 2008-2013
Revenue and Net Income of Kelun Pharma, 2012-2015E
Revenue and Profit of China Resources Double-Crane, 2008-2013
Revenue of China Resources Double-Crane (by Product), 2008-2013
Revenue of China Resources Double-Crane (by Region), 2008-2013
Gross Margin of China Resources Double-Crane (by Product), 2008-2013
China Resources Double-Crane’s Revenue from Top 5 Clients and % of Total Revenue, 2008-2013
Name List and Revenue Contribution of Top 5 Clients of China Resources Double-Crane, H1 2013
Injection Output of China Resources Double-Crane, 2010-2012
Injection Revenue and Gross Margin of China Resources Double-Crane, 2008-2013
Progress of Online Projects of China Resources Double-Crane, by Jun 2013
Revenue and Net Income of China Resources Double-Crane, 2012-2015E
Revenue and Net Income of Fengyuan Pharmaceutical, 2008-2013
Revenue of Fengyuan Pharmaceutical (by Product), 2008-2013
Revenue of Fengyuan Pharmaceutical (by Region), 2008-2013
Gross Margin of Fengyuan Pharmaceutical (by Product), 2008-2013
Fengyuan Pharmaceutical’s Revenue from Top 5 Clients and % of Total Revenue, 2008-2013
Name List and Revenue Contribution of Top 5 Clients of Fengyuan Pharmaceutical, 2012-H1 2013
Fengyuan Pharmaceutical’s Procurement from Top 5 Suppliers and % of Total Procurement, 2008-2013
Name List and Procurement of Top 5 Suppliers of Fengyuan Pharmaceutical, 2012
LVP Output of Fengyuan Pharmaceutical, 2010-2012
Revenue and Net Income of Fengyuan Pharmaceutical , 2012-2015E
LVP Output, Sales Volume and Inventory of Huaren Pharmaceutical, 2011-2012
Revenue and Net Income of Huaren Pharmaceutical, 2008-2013
Revenue of Huaren Pharmaceutical (by Product), 2008-2013
Revenue of Huaren Pharmaceutical (by Region), 2008-2013
Revenue of Huaren Pharmaceutical (by Product), 2008-2013
Huaren Pharmaceutical’s Revenue from Top 5 Clients and % of Total Revenue, 2008-2013
Name List and Procurement of Top 5 Suppliers of Huaren Pharmaceutical, H1 2013
Huaren Pharmaceutical’s Procurement from Top 5 Suppliers and % of Total Procurement, 2008-2013
Name List and Revenue Contribution of Top 5 Clients of Huaren Pharmaceutical, H1 2013
R & D Costs and % of Total Revenue of Huaren Pharmaceutical, 2008-2013
Progress of Major R & D Projects of Huaren Pharmaceutical, by 2013
Revenue and Net Income of Huaren Pharmaceutical , 2012-2015E
Revenue and Net Income of Southwest Pharmaceutical, 2008-2013
Operating Revenue of Southwest Pharmaceutical (by Product), 2008-2013
Revenue of Southwest Pharmaceutical (by Region), 2008-2013
Gross Margin of Southwest Pharmaceutical (by Product), 2008-2013
Southwest Pharmaceutical’s Revenue from Top 5 Clients and % of Total Revenue, 2008-2012
Name List and Revenue Contribution of Top 5 Clients of Southwest Pharmaceutical, 2012
LVP Revenue and Gross Margin of Southwest Pharmaceutical , 2008-2013
Injection Output of Southwest Pharmaceutical, 2010-2012
Revenue and Net Income of Southwest Pharmaceutical, 2012-2015E
Revenue of Lijun International Pharmaceutical (Holding), 2011-2013
Revenue of Shijiazhuang No.4 Pharmaceutical (by Product), 2011-2013
Gross Margin of Shijiazhuang No.4 Pharmaceutical , 2008-2013
Revenue and Net Income of Jin Jian Pharmaceutical, 2008-2013
LVP Output of Jin Jian Pharmaceutical, 2010-2012
Revenue and Gross Margin of Jin Jian Pharmaceutical, 2008-2013
Injection Output of Qingzhou Yaowang Medicine, 2010-2012
Injection Products and Prices of Qingzhou Yaowang Medicine
LVP Output of Dubang Pharmaceutical, 2010-2012
LVP Output of Shandong Lukang Cisen Pharmaceutical, 2010-2012
LVP Output of China Otsuka Pharmaceutical, 2010-2012
Major Injection Products of China Otsuka Pharmaceutical
Injection Output and Demand in China, 2012-2015E
Output of Top 10 Injection Producers in China, 2011-2012
LVP Revenue of Major Chinese Producers, 2008-2012
LVP Gross Margin of Major Chinese Producers, 2008-2013
Proportion of LVP Sales Volume or Value (by Product) in China, 2015E
如果这份报告不能满足您的要求,我们还可以为您定制报告,请 留言说明您的详细需求。
|