|
|
|
报告导航:研究报告—
农业与食品—食品饮料
|
|
2013-2015年中国调味品行业研究报告 |
 |
字数:2.7万 |
页数:77 |
图表数:92 |
|
中文电子版:7500元 |
中文纸版:3750元 |
中文(电子+纸)版:8000元 |
|
英文电子版:1800美元 |
英文纸版:1900美元 |
英文(电子+纸)版:2100美元 |
|
编号:PQ003
|
发布日期:2013-12 |
附件:下载 |
 |
|
|
由于看好中国调味品市场前景,达能、雀巢、联合利华、荷美尔食品、味好美等外资企业通过并购、直接投资建厂或合资等方式陆续进入中国调味品市场。2013年1月4日,荷美尔食品(Hormel)以7亿美元收购联合利华旗下的“四季宝”品牌花生酱(包括美国Little Rock, Ark和中国山东省潍坊的工厂); 2013年5月31日,美国味好美(McCormick)的全资子公司味好美(武汉)食品有限公司以1.47亿美元完成了对武汉亚太调味食品有限公司的资产收购,获得武汉亚太的鸡精产品品牌“大桥”和“厨师乐”,强势进入华中地区。 中国调味品主要有酱油、食醋及类似制品,以及味精等。2008-2012年,中国调味品行业收入年复合增长率为17%;其中酱醋行业仍是拉动中国调味品行业的主要驱动力,同期酱醋行业年复合增长率23%。 受益于家庭消费升级,餐饮业和食品制造业的快速发展,中国调味品行业在2015年之前有望保持20%以上增长速度。2013年中国调味品(仅包括酱油、食醋及类似品,味精)行业收入达到1311.9亿元,同比增速达21.8%。 2012年中国酱油产量达到700万吨左右,同比增长3.7%;2013年1-10月,中国酱油产量达610万吨,同比增长8.1%。2012年中国酱油产量前4大品牌海天、美味鲜、李锦记和加加合计市场份额为30.5%。 中国食醋行业生产企业有6000家左右,代表品牌有恒顺醋业、山西水塔老陈醋、四川保宁醋;行业集中度较低,未来面临很大整合空间。恒顺醋业是中国最大的食醋生产商,年产食醋约21.3万吨,占中国食醋产量7.1%。 中国鸡精行业集中度较高,规模以上的生产厂商有近20家,CR5达 68%左右。鸡精行业主要被外资企业所垄断,如瑞士雀巢(Nestle)的豪吉和太太乐。中国本土企业佳隆股份依靠鸡精配方独特,且难被模仿,以及价格竞争力优势,已在中高档餐饮行业领域占据较高的市场份额。
Being optimistic about the prospect of Chinese condiment market, Danone,
Nestlé, Unilever, Hormel Foods, McCormick and other foreign companies
through mergers and acquisitions, direct investment or joint ventures
have in succession entered the Chinese condiment market. On January 4,
2013 Hormel Foods acquired Unilever's Skippy® Brand Peanut Butter
(including the facilities in Little Rock, Arkansas, USA and Weifang,
China) with US$700 million; on May 31, 2013 McCormick (Wuhan) Food Co.,
Ltd., a wholly-owned subsidiary of McCormick completed the asset
acquisition of Wuhan Yatai Seasoning Food Co., Ltd. with US$147 million
to get the latter's chicken essence brands "DaQiao" and "ChuShiLe",
making strong entry into Central China. 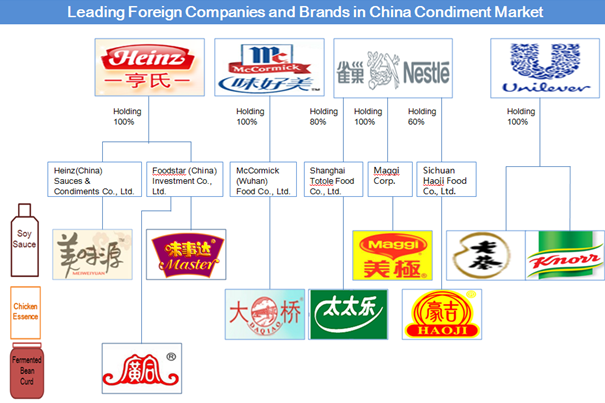 Chinese
condiment mainly refers to soy sauce, vinegar and similar products,
monosodium glutamate (MSG), etc.. In 2008-2012 Chinese condiment
industry revenue grew at a CAGR of 17%, of which, soy sauce and vinegar
sector as the main driving force grew at a CAGR of 23%. Benefiting
from the household consumption upgrade as well as the rapid development
of catering industry and food production, the Chinese condiment
industry prior to 2015 is expected to maintain a growth rate of above
20%. In 2013 Chinese condiment (including only soy sauce, vinegar and
the like, MSG) industry revenue climbed 21.8% YoY to RMB131.19 billion. Chinese
soy sauce production reached about seven million tons in 2012, a
year-on-year increase of 3.7%; 6.1 million tons in January-October 2013,
a year-on-year increase of 8.1%. In 2012 China's four major soy sauce
brands by output – HaiTian, MeiWeiXian, Lee Kum Kee and JiaJia accounted
for total market share of 30.5%. There are about 6,000
producers in Chinese vinegar industry, represented by Jiangsu Hengshun
Vinegar Industry Co., Ltd., Shanxi Shuita Vinegar Co., Ltd, Sichuan
Baoning Vinegar Co., Ltd., showing low concentration, and will face
great space for integration in the future. Hengshun Vinegar Industry as
China's largest vinegar producer annually produces about 213,000 tons of
vinegar, accounting for 7.1% of vinegar production in China. Chinese
chicken essence industry has a high concentration, embracing nearly 20
large-scale producers, with CR5 up to 68% or so. The industry is mainly
monopolized by foreign companies such as Switzerland-based Nestlé, the
owner of HaoJi and Totole. Local Chinese enterprise - Guangdong Jialong
Food Co., Ltd. relying on unique chicken essence recipe, inimitability
and price competitiveness has occupied high market share in the middle
and top grade catering industry.
第一章 调味品行业分类及概念
第二章 中国调味品市场分析
2.1 发展现状
2.2 细分行业
2.3 竞争格局
2.3.1外资企业
2.3.1 内资企业
2.4 发展趋势
第三章 中国酱油市场分析
3.1 发展现状
3.1.1市场供需
3.1.2市场格局
3.1.3发展趋势
3.2 进出口
3.3海天味业
3.3.1 公司简介
3.3.2 经营状况
3.3.3 发展策略
3.4加加食品
3.4.1 公司简介
3.4.2经营状况
3.4.3营收构成
3.4.4毛利率
3.4.5研发与投资
3.4.6客户和供应商
3.4.7 发展预测
3.5李锦记
3.5.1 公司简介
3.5.2经营状况
3.5.3 发展策略
3.6美味鲜
3.6.1 公司简介
3.6.2 公司经营
3.6.3 发展预测
第四章 中国食醋市场分析
4.1 发展现状
4.2 恒顺醋业
4.2.1 公司简介
4.2.2经营状况
4.2.3营收构成
4.2.4毛利率
4.2.5客户和供应商
4.2.6发展预测
4.3 水塔醋业
4.3.1 公司简介
4.3.2发展动向
第五章 中国味精市场分析
5.1 发展现状
5.2 竞争格局
5.3 莲花味精
5.3.1 公司简介
5.3.2经营状况
5.3.3 营收构成
5.3.4 毛利率
5.3.5 客户和供应商
5.3.6 发展预测
5.4 阜丰集团
5.4.1 公司简介
5.4.2经营状况
5.4.3营收构成
5.4.4 毛利率
5.4.5 发展预测
5.5 梅花集团
5.5.1 公司简介
5.5.2经营状况
5.5.3 营收构成
5.5.4 毛利率
5.5.5 客户和供应商
5.5.6发展预测
第六章 中国鸡精市场分析
6.1 发展现状
6.2 太太乐
6.3 佳隆股份
6.3.1 公司简介
6.3.2 经营状况
6.3.3 营收构成
6.3.4 毛利率
6.3.5 研发与投资
6.3.6 发展预测
第七章 其他调味品企业
7.1 晨光生物
7.1.1 公司简介
7.1.2 经营状况
7.1.3 营收构成
7.1.4 毛利率
7.1.5 研发与投资
7.1.6 发展预测
7.2 涪陵榨菜
7.2.1 公司简介
7.2.2 经营状况
7.2.3 营收构成
7.2.4 毛利率
7.2.5 研发与投资
7.2.6发展预测
第八章 总结与预测
8.1 总结
8.2 预测
1. Definition and Classification
2. China Condiment Market
2.1 Development Status
2.2 Industry Segments
2.3 Competition Pattern
2.3.1 Foreign Companies
2.3.2 Domestic Companies
2.4 Trends
3. China Soy Sauce Market
3.1 Development Status
3.1.1 Supply and Demand
3.1.2 Market Pattern
3.1.3 Trends
3.2 Import and Export
3.3 Foshan Haitian Flavouring & Food Co., Ltd.
3.3.1 Profile
3.3.2 Operation
3.3.3 Development Strategy
3.4 Jiajia Food Group Co., Ltd.
3.4.1 Profile
3.4.2 Operation
3.4.3 Revenue Structure
3.4.4 Gross Margin
3.4.5 R&D and Investment
3.4.6 Clients and Suppliers
3.4.7 Development Forecast
3.5 Lee Kum Kee
3.5.1 Profile
3.5.2 Operation
3.5.3 Development Strategy
3.6 Guangdong Meiweixian Flavoring Foods Co., Ltd.
3.6.1 Profile
3.6.2 Operation
3.6.3 Development Forecast
4. China Vinegar Market
4.1 Development Status
4.2 Jiangsu Hengshun Vinegar Industry Co., Ltd.
4.2.1 Profile
4.2.2 Operation
4.2.3 Revenue Structure
4.2.4 Gross Margin
4.2.5 Clients and Suppliers
4.2.6 Development Forecast
4.3 Shanxi Shuita Vinegar Co., Ltd.
4.3.1 Profile
4.3.2 Trends
5. China MSG Market
5.1 Development Status
5.2 Competition Pattern
5.3 Henan Lotus Flower Gourmet Powder Co., Ltd.
5.3.1 Profile
5.3.2 Operation
5.3.3 Revenue Structure
5.3.4 Gross Margin
5.3.5 Clients and Suppliers
5.3.6 Development Forecast
5.4 Fufeng Group Ltd.
5.4.1 Profile
5.4.2 Operation
5.4.3 Revenue Structure
5.4.4 Gross Margin
5.4.5 Developmoent Forecast
5.5 Meihua Holdings Group Co., Ltd
5.5.1 Profile
5.5.2 Operation
5.5.3 Revenue Structure
5.5.4 Gross Margin
5.5.5 Clients and Suppliers
5.5.6 Development Forecast
6. China Chicken Essence Market
6.1 Development Status
6.2 Totole
6.3 Guangdong Jialong Food Co., Ltd.
6.3.1 Profile
6.3.2 Operation
6.3.3 Revenue Structure
6.3.4 Gross Margin
6.3.5 R&D and Investment
6.3.6 Development Forecast
7. Other Condiment Companies
7.1 Chenguang Biotech Group Co., Ltd.
7.1.1 Profile
7.1.2 Operation
7.1.3 Revenue Structure
7.1.4 Gross Margin
7.1.5 R&D and Investment
7.1.6 Development Forecast
7.2 Chongqing Fuling Zhacai Group Co., Ltd.
7.2.1 Profile
7.2.2 Operation
7.2.3 Revenue Structure
7.2.4 Gross Margin
7.2.5 R&D and Investment
7.2.6 Development Forecast
8. Summary and Forecast
8.1 Summary
8.2 Forecast
表:中国调味品发展阶段
表:复合调味料分类(按消费功能)
表:调味品行业代表企业
表:1994-2013外资调味品企业在中国投资大事记
表:中国主要调味品企业外资背景
表:中国本土企业发展方式及相关事件
表:2011-2013年中国调味品行业主要政策
表:2009-2013年海天味业营业收入和净利润
表:2008-2013年加加食品(分产品)营业收入
表:2008-2013年加加食品(分地区)营收收入
表:2012年加加食品前五名客户销售额及占比
表:2012-2015年加加食品营业收入和净利润
表:2012-2015年美味鲜营业收入和净利润
表:2008-2013年恒顺醋业(分行业)主营业务收入
表:2012-2015年恒顺醋业营业收入和净利润
表:2007-2013 年环保政策与味精行业整合政策
表:2008-2013年莲花味精(分产品)营业收入
表:2012-2015年莲花味精营业收入和净利润
表:2008-2013年阜丰集团(分产品)营业收入
表:2012-2015年阜丰集团营业收入和净利润
表:2010-2013年梅花集团(分产品)营业收入
表:2012-2015年梅花集团营业收入和净利润
表:2010-2013年佳隆股份(分产品)营业收入
表:2012-2015年佳隆股份营业收入和净利润
表:2010-2013年晨光生物(分产品)营业收入
表:截止到2013年9月晨光生物项目投资情况
表:2012-2015年晨光生物营业收入和净利润
表:2012-2015年涪陵榨菜营业收入和净利润
表:2012-2013年中国调味品行业公司营业收入
图:2008-2012年中国食品饮料细分行业收入年复合增长率
图:2012年中国调味品(分产品)产量构成
图:2012年中国调味品行业应用领域比重
图:2011-2013年中国调味品行业(分产品)收入
图:2007-2013年中国酱油产量及同比增长
图:2012年中国酱油产量(分地区)及市场份额
图:2013年1-10月中国酱油产量(分地区)及市场份额
图:2012年中国酱油产量(分品牌)市场格局
图:2009-2013中国酱油进出口量
图:2009-2013年中国酱油进出口额
图:2008-2013年加加食品营业收入和同比增长
图:2008-2013年加加食品净利润和同比增长
图:2008-2013年加加食品毛利率
图:2011-2013年加加食品研发支出及占比
图:2011-2013年加加食品前五名客户销售额及占比
图:2011和2012年加加食品前五名供应商采购额及占比
图:2010-2013年美味鲜营业收入和同比增长
图:2010-2013年美味鲜净利润和同比增长
图:2012年中国食醋企业(按产量)竞争格局
图:2008-2013年恒顺醋业营业收入和同比增长
图:2008-2013年恒顺醋业净利润和同比增长
图:2008-2013年恒顺醋业毛利率
图:2011-2013年恒顺醋业前五名客户销售额及占比
图:全球味精(分国家)产能分布
图:2007-2013年中国味精制造行业营业收入及同比增速
图:2007-2013年中国味精制造行业利润总额及同比增速
图:2013年中国味精消费格局
图:2009-2013年中国味精制造行业出口交货值及同比增速
图:2013年中国味精企业(按产能)竞争格局
图:2008-2013年莲花味精营业收入和同比增长
图:2008-2013年莲花味精净利润和同比增长
图:2008-2013年莲花味精(分地区)营收占比
图:2008-2013年莲花味精综合毛利率
图:2011-2013年莲花味精前五名客户销售额及占比
图:2008-2013年阜丰集团营业收入和同比增长
图:2008-2013年阜丰集团净利润和同比增长
图:2008-2013年阜丰集团综合毛利率
图:2008-2013年梅花集团营业收入和同比增长
图:2008-2013年梅花集团净利润和同比增长
图:2009-2013年梅花集团(分地区)营业收入
图:2010-2013年梅花集团(分产品)毛利率
图:2009-2013年梅花集团前五名客户销售额及占比
图:2007-2012年中国鸡精行业产能和产量
图:2008-2013年佳隆股份营业务收入和同比增长
图:2008-2013年佳隆股份净利润和同比增长
图:2008-2013年佳隆股份(分地区)营业收入
图:2008-2013年佳隆股份(分产品)毛利率
图:2008-2013年佳隆股份研发支出及占比
图:2008-2013年晨光生物营业务收入和同比增长
图:2008-2013年晨光生物净利润和同比增长
图:2008-2013年晨光生物(分地区)营业收入
图:2008-2013年晨光生物毛利率(分产品)
图:2008-2012年晨光生物研发支出及占比
图:2008-2013年涪陵榨菜营业务收入和同比增长
图:2008-2013年涪陵榨菜净利润和同比增长
图:2008-2013年涪陵榨菜(分产品)营业收入
图:2008-2013年涪陵榨菜(分地区)营业收入
图:2008-2013年涪陵榨菜毛利率(分产品)
图:2008-2013年涪陵榨菜研发支出及占比
图:2007-2015年中国调味品行业收入及同比增长
图:2007-2015年中国调味品(分产品)产量
图:2007-2015年中国酱油、食醋及类似制品行业收入及同比增长
图:2007-2015年中国味精制造行业营业收入及同比增速
Chinese Condiment Development Course
Classification of Compound Seasonings by Consumption Function
Representative Enterprises of Condiment Industry
Investment Events of Foreign Condiment Companies in China, 1994-2013
Foreign Background of China's Major Condiment Enterprises
Development Mode and Related Events of Local Chinese Enterprises
Main Policies of China Condiment Industry, 2011-2013
Revenue and Net Income of Foshan Haitian Flavouring & Food, 2009-2013
Revenue Breakdown of Jiajia Food by Product, 2008-2013
Revenue Breakdown of Jiajia Food by Region, 2008-2013
Jiajia Food's Sales from Top 5 Clients and % of Total Revenue, 2012
Revenue and Net Income of Jiajia Food, 2012-2015E
Revenue and Net Income of Guangdong Meiweixian Flavoring Foods, 2012-2015E
Operating Revenue Breakdown of Jiangsu Hengshun Vinegar Industry by Sector, 2008-2013
Revenue and Net Income of Jiangsu Hengshun Vinegar Industry, 2012-2015E
Environmental Policy and MSG Industry Consolidation Policy, 2007-2013
Revenue Breakdown of Henan Lotus Flower Gourmet Powder by Product, 2008-2013
Revenue and Net Income of Henan Lotus Flower Gourmet Powder, 2012-2015E
Revenue Breakdown of Fufeng Group by Product, 2008-2013
Revenue and Net Income of Fufeng Group, 2012-2015E
Revenue Breakdown of Meihua Holdings Group by Product, 2010-2013
Revenue and Net Income of Meihua Holdings Group, 2012-2015E
Revenue Breakdown of Guangdong Jialong Food by Product, 2010-2013
Revenue and Net Income of Guangdong Jialong Food, 2012-2015E
Revenue Breakdown of Chenguang Biotech Group by Product, 2010-2013
Project Investment of Chenguang Biotech Group by September 2013
Revenue and Net Income of Chenguang Biotech Group, 2012-2015E
Revenue and Net Income of Chongqing Fuling Zhacai Group, 2012-2015E
Corporate Revneue of China Condiment Industry, 2012-2013
CAGR for Revenue of China Food & Beverage Industry Segments, 2008-2012
Chinese Condiment Production Structure by Product, 2012
Chinese Condiment Industry Application Structure, 2012
Revenue Breakdown of China Condiment Industry by Product, 2011-2013
Chinese Soy Sauce Production and YoY Growth, 2007-2013
Chinese Soy Sauce Production by Region and Market Share, 2012
Chinese Soy Sauce Production by Region and Market Share, Jan-Oct 2013
Market Pattern of Chinese Soy Sauce Production by Brand, 2012
Chinese Soy Sauce Import / Export Volume, 2009-2013
Chinese Soy Sauce Import / Export Value, 2009-2013
Revenue and YoY Growth of Jiajia Food, 2008-2013
Net Income and YoY Growth of Jiajia Food, 2008-2013
Gross Margin of Jiajia Food, 2008-2013
R&D Costs and % of Total Revenue of Jiajia Food, 2011-2013
Jiajia Food's Sales from Top 5 Clients and % of Total Revenue, 2011-2013
Jiajia Food's Procurement from Top 5 Suppliers and % of Total Procurement, 2011-2012
Revenue and YoY Growth of Guangdong Meiweixian Flavoring Foods, 2010-2013
Net Income and YoY Growth of Guangdong Meiweixian Flavoring Foods, 2010-2013
Chinese Vinegar Enterprise Competition Pattern by Output, 2012
Revenue and YoY Growth of Jiangsu Hengshun Vinegar Industry, 2008-2013
Net Income and YoY Growth of Jiangsu Hengshun Vinegar Industry, 2008-2013
Gross Margin of Jiangsu Hengshun Vinegar Industry, 2008-2013
Jiangsu Hengshun Vinegar Industry's Sales from Top 5 Clients and % of Total Revenue, 2011-2013
Global MSG Capacity Distribution by Country
Revenue and YoY Growth of China MSG Production Industry, 2007-2013
Total Profit and YoY Growth of China MSG Production Industry, 2007-2013
Chinese MSG Consumption Pattern, 2013
Export Delivery Value and YoY Growth of China MSG Production Industry, 2009-2013
Chinese MSG Enterprise Competition Pattern by Capacity, 2013
Revenue and YoY Growth of Henan Lotus Flower Gourmet Powder, 2008-2013
Net Income and YoY Growth of Henan Lotus Flower Gourmet Powder, 2008-2013
Revenue Structure of Henan Lotus Flower Gourmet Powder by Region, 2008-2013
Consolidated Gross Margin of Henan Lotus Flower Gourmet Powder, 2008-2013
Henan Lotus Flower Gourmet Powder's Sales from Top 5 Clients and % of Total Revenue, 2011-2013
Revenue and YoY Growth of Fufeng Group, 2008-2013
Net Income and YoY Growth of Fufeng Group, 2008-2013
Consolidated Gross Margin of Fufeng Group, 2008-2013
Revenue and YoY Growth of Meihua Holdings Group, 2008-2013
Net Income and YoY Growth of Meihua Holdings Group, 2008-2013
Revenue Breakdown of Meihua Holdings Group by Region, 2009-2013
Gross Margin of Meihua Holdings Group by Product, 2010-2013
Meihua Holdings Group's Sales from Top 5 Clients and % of Total Revenue, 2009-2013
Capacity and Output of China Chicken Essence Industry, 2007-2012
Revenue and YoY Growth of Guangdong Jialong Food, 2008-2013
Net Income and YoY Growth of Guangdong Jialong Food, 2008-2013
Revenue Breakdown of Guangdong Jialong Food by Region, 2008-2013
Gross Margin of Guangdong Jialong Food by Product, 2008-2013
R&D Costs and % of Total Revenue of Guangdong Jialong Food, 2008-2013
Revenue and YoY Growth of Chenguang Biotech Group, 2008-2013
Net Income and YoY Growth of Chenguang Biotech Group, 2008-2013
Revenue Breakdown of Chenguang Biotech Group by Region, 2008-2013
Gross Margin of Chenguang Biotech Group by Product, 2008-2013
R&D Costs and % of Total Revenue of Chenguang Biotech Group, 2008-2012
Revenue and YoY Growth of Chongqing Fuling Zhacai Group, 2008-2013
Net Income and YoY Growth of Chongqing Fuling Zhacai Group, 2008-2013
Revenue Breakdown of Chongqing Fuling Zhacai Group by Product, 2008-2013
Revenue Breakdown of Chongqing Fuling Zhacai Group by Region, 2008-2013
Gross Margin of Chongqing Fuling Zhacai Group by Product, 2008-2013
R&D Costs and % of Total Revenue of Chongqing Fuling Zhacai Group, 2008-2013
Revenue and YoY Growth of China Condiment Industry, 2007-2015E
Chinese Condiment Production by Product, 2007-2015E
Revenue and YoY Growth of China Soy Sauce, Vinegar and Similar Products Industry, 2007-2015E
Revenue and YoY Growth of China MSG Production Industry, 2007-2015E
如果这份报告不能满足您的要求,我们还可以为您定制报告,请 留言说明您的详细需求。
|