|
|
|
报告导航:研究报告—
制造业—能源矿产
|
|
2013-2016年全球及中国钴金属行业研究报告 |
 |
字数:3.0万 |
页数:98 |
图表数:113 |
|
中文电子版:8000元 |
中文纸版:4000元 |
中文(电子+纸)版:8500元 |
|
英文电子版:2100美元 |
英文纸版:2200美元 |
英文(电子+纸)版:2400美元 |
|
编号:CYH022
|
发布日期:2013-12 |
附件:下载 |
 |
|
|
受全球经济下滑及中国经济增速放缓等影响,2012年,全球钴矿产量增速大幅下滑,全年实现产量11万吨,同比仅增0.9%;而精炼钴产量大幅减产,同比下滑6.1%至7.72万吨。2013年,全球钴市场略有好转,但总体仍不乐观,预计全年钴矿产量同比增幅约3.6%左右。 中国钴矿资源匮乏,累计探明钴储量约8.0万吨,仅占世界的1%,并且已探明的钴资源绝大多数为伴生矿,独立成矿的钴矿物仅占全国保有储量的4.7%。中国已知钴矿主要分布在甘肃省,占中国钴矿资源储量的30.5%。中国是钴消费大国,下游主要用于生产电池、硬质合金、磁性材料等产品,2012年,中国电池用钴占钴总消费量的67%,同比增长4个百分点。 《2013-2016年全球及中国钴金属行业研究报告》在对全球及中国钴矿产资源、政策、市场供需、价格及竞争格局等分析的基础上,重点对全球4家和中国12家的经营状况、钴业务发展等进行分析。 金川集团是中国最大的钴生产企业,具备完整的矿产勘探、开采、选矿、冶炼、精炼及化工一体化产业链。截至 2012年末,金川集团具备年产9,100吨钴生产能力,电钴市场占有率为50%,四氧化三钴市场占有率为33%。2012年,公司收购南非梅特瑞斯公司,新增矿钴金属资源量33万吨,钴金属基础储量8.8万吨。 华友钴业是中国最大的钴化学品生产商,钴综合产能规模排名中国第二。公司在非洲等地区拥有KOLWEZI矿及NYOKA矿、KAMBOVE尾矿等矿产资源,具备钴金属总量3.19万吨。截止2012年底,公司已拥有年产5,550吨钴金属量的钴化学品产能,钴产品产销率达105.02%。根据公司的生产计划,2013年公司钴销售量预计达为8,200吨左右。同时,公司在建衢州项目于在2013下半年度投产,新增1万吨钴化学品产能。 格林美是中国钴粉主要生产商,截止2012年底,公司钴粉产能达2000吨。2012年底公司完成收购凯力克51股权结构,收购完成后,公司具备四氧化三钴、电积钴及三元材料产能分别达到4000吨、1800吨和1000吨。再加之公司新建高性能镍钴锰三元材料等项目,预计至2015年,公司整体钴产能有望达到1.6万吨。
Affected by the global economic downturn and the slowdown in economic
growth of China, in 2012, the growth rate of global output of cobalt
fell sharply, with annual output of 110,000 tons, up by merely 0.9% year
on year; the output of refined cobalt also declined dramatically, down
6.1 % year on year to 77,200 tons. In 2013, the global cobalt market
rallied slightly, but it was still not optimistic as a whole, it is
expected that annual output of cobalt in 2013 will show a year-on-year
rise of about 3.6%. China lacks of cobalt ore resources, with the
total proven reserves of cobalt approximating 80,000 tons, accounting
for just 1% of global total, and the vast majority of proven resources
are associated ore, whereas independent mineralized cobalt ore occupies
only 4.7 % of the reserves in China. Known cobalt ores in China are
mainly distributed in Gansu province which makes up 30.5% of China's
cobalt reserves. China is a big consumer of cobalt, which is primarily
utilized in downstream sectors to produce battery, hard alloy, magnetic
materials and other products. In 2012, cobalt used in batteries takes up
67% of total consumption of cobalt in China, up 4 percentage points
from a year earlier. 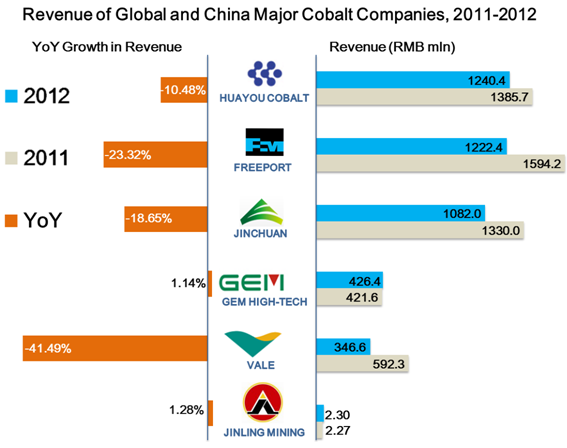 The
"Global and China Cobalt Industry Report, 2013-2016" focuses on the
analysis of operating conditions and cobalt business development of 4
global and 12 Chinese companies based on the analysis of global and
China’s cobalt mineral resources, policies, market supply and demand,
price and competitive pattern. Jinchuan Group International
Resources Co. Ltd is the largest producer of cobalt in China, possessing
a complete integrated industrial chain of mineral exploration, mining,
processing, smelting, refining and chemical engineering. As of the end
of 2012, Jinchuan Group had boasted an annual production capacity of
9,100 tons of cobalt, a 50% market share in electrical cobalt market,
and a 33% market share in cobalt oxide market. In 2012, Jinchuan Group
acquired the South African company Mette Reese, thus adding cobalt
mineral resources of 330,000 tons and cobalt metal base reserves of
88,000 tons. Huayou Cobalt Co., Ltd. is the largest manufacturer
of cobalt chemicals in China, with comprehensive cobalt production
capacity ranking No.2 at home. It has KOLWEZI mine, NYOKA mine, KAMBOVE
tailings and other mineral resources in Africa and other regions, with
total amount of 31,900 tons of cobalt metal. By the end of 2012, the
company had possessed an annual production capacity of cobalt chemicals
with 5,550 tons of cobalt metal content, with sales-output ratio of
105.02%. According to the company's production plan, in 2013 the
company’s cobalt sales are expected to reach approximately 8,200 tons.
Meanwhile, the company’s ongoing project in Quzhou city will begin
production in the second half of 2013 which will add a production
capacity of 10,000 tons of cobalt chemicals. Shenzhen Green
Eco-manufacture Hi-tech Co.,Ltd. is a leading Chinese manufacturer of
cobalt powder. As of the end of 2012, the company’s production capacity
of cobalt powder was 2,000 tons. At the end of 2012, the company
completed the acquisition on 51% stake of Jiangsu Cobalt Nickel Metal
Co., Ltd. After the acquisition, the company’s production capacity of
cobalt oxide, electrodeposition cobalt and ternary materials reached
4,000 tons, 1,800 tons and 1,000 tons respectively. If the company's new
high-performance nickel-cobalt-manganese ternary material project and
other projects were included, the overall cobalt production capacity of
the company will reach 16,000 tons in 2015.
第一章 钴概述
1.1 定义
1.2 产业链
第二章 全球钴市场发展现状
2.1 钴矿储量
2.2 市场供给
2.3 市场需求
2.4 地区分布
2.5 价格
2.6 竞争格局
第三章 中国钴市场发展现状
3.1 政策
3.2 钴矿资源
3.3 市场供需
3.3.1 供给
3.3.2 需求
3.3.3 价格
3.4 竞争格局
第四章 中国钴细分产品进出口
4.1 钴矿砂及其精矿
4.1.1 进口
4.1.2 地区结构
4.2 四氧化三钴
4.2.1 进出口
4.2.2 地区结构
4.3 氯化钴
4.3.1 进出口
4.3.2 地区结构
4.4 碳酸钴
4.4.1 进出口
4.4.2 地区结构
4.5 硝酸钴
4.5.1 进出口
4.5.2 地区结构
4.6 草酸钴
4.6.1 出口
第五章 全球钴主要生产企业
5.1 Umicore
5.1.1 企业简介
5.1.2 经营情况
5.1.3 营收构成
5.1.4 研发
5.1.5 钴业务(Cobalt Specialty Materials)
5.1.6 在华业务
5.1.7 发展前景
5.2 Glencore Xstrata
5.2.1 企业简介
5.2.2 经营情况
5.2.3 营收构成
5.2.4 钴业务
5.3 Vale
5.3.1 企业简介
5.3.2 经营情况
5.3.3 营收构成
5.3.4 钴业务
5.3.5 在华业务
5.4 Freeport
5.4.1 企业简介
5.4.2 经营情况
5.4.3 营收构成
5.4.4 钴业务
5.4.5 在华业务
第六章 中国钴主要生产企业
6.1 格林美(002340)
6.1.1 企业简介
6.1.2 经营情况
6.1.3 营收构成
6.1.4 毛利率
6.1.5 供应商
6.1.6 研发与投资
6.1.7 钴业务
6.1.8 发展前景
6.2 华友钴业
6.2.1 企业简介
6.2.2 经营情况
6.2.3 营收构成
6.2.4 毛利率
6.2.5 客户和供应商
6.2.6 投资
6.2.7 钴业务
6.2.8 发展前景
6.3 金川集团股份有限公司
6.3.1 企业简介
6.3.2 经营情况
6.3.3 营收构成
6.3.4 毛利率
6.3.5 投资
6.3.6 钴业务
6.3.7 发展前景
6.4 金岭矿业(000655)
6.4.1 企业简介
6.4.2 经营情况
6.4.3 营收构成
6.4.4 毛利率
6.4.5 钴业务
6.4.6 发展前景
6.5 陕西华泽镍钴金属有限公司
6.5.1 企业简介
6.5.2 经营情况
6.5.3 钴业务
6.6 当升科技(300073)
6.6.1 企业简介
6.6.2 经营情况
6.6.3 营收构成
6.6.4 毛利率
6.6.5 钴业务
6.6.6发展前景
6.7 浙江嘉利珂
6.8 瑞木镍钴管理 ( 中冶 ) 有限公司
6.9 江钨钴业有限公司
6.10 江西江钨镍钴新材料有限公司
6.11 江西江钨国际镍钴新材料有限公司
6.12 南通新玮镍钴科技发展有限公司
第七章 结论与预测
7.1 结论
7.2 预测
1 Cobalt Overview
1.1 Definitions
1.2 Industry Chain
2 Status Quo of Global Cobalt Market
2.1 Cobalt Ore Reserves
2.2 Market Supply
2.3 Market Demand
2.4 Regional Distribution
2.5 Price
2.6 Competition Pattern
3 Cobalt Market Development in China
3.1 Policy
3.2 Cobalt Ore Resources
3.3 Market Supply and Demand
3.3.1 Supply 3.3.2 Demand
3.3.3 Price
3.4 Competition Pattern
4 China’s Import and Export of Cobalt by Product
4.1 Cobalt Ores and Concentrates
4.1.1 Import
4.1.2 Regional Structure
4.2 Cobaltosic Oxide
4.2.1 Import and Export
4.2.2 Regional Structure
4.3 Cobalt Chloride
4.3.1 Import and Export
4.3.2 Regional Structure
4.4 Cobalt Carbonate
4.4.1 Import and Export
4.4.2 Regional Structure
4.5 Cobalt Nitrate
4.5.1 Import and Export
4.5.2 Regional Structure
4.6 Cobalt Oxalate
4.6.1 Export
5 Major Global Cobalt Manufacturers
5.1 Umicore
5.1.1 Profile
5.1.2 Operation
5.1.3 Revenue Structure
5.1.4 R & D
5.1.5 Cobalt Business (Cobalt Specialty Materials)
5.1.6 Business in China
5.1.7 Development Prospect
5.2 Glencore Xstrata
5.2.1 Profile
5.2.2 Operation
5.2.3 Revenue Structure
5.2.4 Cobalt Business
5.3 Vale
5.3.1 Profile
5.3.2 Operation
5.3.3 Revenue Structure
5.3.4 Cobalt Business
5.3.5 Business in China
5.4 Freeport
5.4.1 Profile
5.4.2 Operation
5.4.3 Revenue Structure
5.4.4 Cobalt Business
5.4.5 Business in China
6 Major Chinese Cobalt Producers
6.1 Shenzhen Green Eco-manufacture Hi-tech (002340)
6.1.1 Profile
6.1.2 Operation
6.1.3 Revenue Structure
6.1.4 Gross Margin
6.1.5 Suppliers
6.1.6 R & D and Investment
6.1.7 Cobalt Business
6.1.8 Development Prospect
6.2 Huayou Cobalt
6.2.1 Profile
6.2.2 Operation
6.2.3 Revenue Structure
6.2.4 Gross Margin
6.2.5 Clients and Suppliers
6.2.6 Investment
6.2.7 Cobalt Business
6.2.8 Development Prospect
6.3 Jinchuan Group Co., Ltd.
6.3.1 Profile
6.3.2 Operation
6.3.3 Revenue Structure
6.3.4 Gross Margin
6.3.5 Investment
6.3.6 Cobalt Business
6.3.7 Development Prospect
6.4 Shandong Jinling Mining (000655)
6.4.1 Profile
6.4.2 Operation
6.4.3 Revenue Structure
6.4.4 Gross Margin
6.4.5 Cobalt Business
6.4.6 Development Prospect
6.5 Shaanxi Huaze Nickel & Cobalt Metal
6.5.1 Profile
6.5.2 Operation
6.5.3 Cobalt Business
6.6 Beijing Easpring Material Technology (300073)
6.6.1 Profile
6.6.2 Operation
6.6.3 Revenue Structure
6.6.4 Gross Margin
6.6.5 Cobalt Business
6.6.6 Development Prospect
6.7 Zhejiang Galico Cobalt& Nickel Material Co., Ltd.
6.8 Ramu Nico Management (Mcc) Limited
6.9 Jiangxi Jiangwu Cobalt Co., Ltd
6.10 Jiangxi Jiangwu Nickel and Cobalt New Materials Co.,Ltd
6.11 Jiangxi Jiangwu International Nickel and Cobalt New Materials Co.,Ltd
6.12 Nantong Xinwei Nickel Cobalt Technology Development Co., Ltd.
7 Conclusion and Forecast
7.1 Conclusion
7.2 Forecast
图:钴产业链示意图
图:2013年全球钴(分国家)储量
图:2005-2013年全球钴产量及同比增长
图:2005-2013年全球精炼钴产量及同比增长
表:2008-2013年全球精炼钴供需平衡表
图:2012年全球钴市场消费结构
图:2012年全球钴(分国家)产量占比
图:2012年全球钴(分国家/地区)消费量占比
图:2006-2013年MB自由市场钴交货价格
图:2012年全球精炼钴(分企业)产量占比
表:2001-2012年全球精炼钴(分企业)产量
表:2011-2013年中国钴相关政策
图:中国钴矿资源(分省市)储量占比
图:2005-2013年中国钴矿产量
图:2005-2013年中国原生钴产量及同比增长
图:2006-2013年中国钴消费量及同比增长
图:2012年中国钴(分用途)消费量占比
图:2007-2013年中国长江有色市场及MB自由市场钴均价
表:2013年中国主要钴生产企业钴产品产能
图:2006-2013年中国钴矿砂及其精矿进口量及进口金额
图:2013年1-9月中国钴矿砂及其精矿(分国家)进口量
图:2006-2013年中国四氧化三钴进口量及进口金额
图:2006-2013年中国四氧化三钴出口量及出口金额
图:2013年1-9月中国四氧化三钴(分国家)出口量占比
图:2006-2013年中国氯化钴进口量及进口金额
图:2006-2013年中国氯化钴出口量及出口金额
图:2013年1-9月中国氯化钴(分国家)出口量占比
图:2006-2013年中国碳酸钴进口量及进口金额
图:2006-2013年中国碳酸钴出口量及出口金额
图:2013年1-9月中国碳酸钴(分国家)出口量占比
图:2006-2013年中国硝酸钴进口量及进口金额
图:2006-2013年中国硝酸钴出口量及出口金额
图:2013年1-9月中国硝酸钴(分国家)出口量占比
图:2006-2013年中国草酸钴出口量及出口金额
图:2008-2013年Umicore营业收入与净利润
图:2008-2013年Umicore(分业务)营业收入
图:2012年Umicore(分业务)营业收入占比
图:2012年Umicore(分地区)总收入占比
图:2006-2013年Umicore研发投入及占比
图:2008-2013年Umicore能源材料业务营业收入与利润
图:2001-2012年Umicore精炼钴产量及同比增长
图:2013-2014年公司Energy Material业务部门主要投资规划
表:截止2012年底Umicore在中国子公司
图:2012-2015年Umicore在中国主要建设项目
表:2011-2016年Umicore营业收入与净利润
图:2012-2013年Glencore Xstrata营业收入与净利润
图:2013上半年Glencore Xstrata(分业务)营业收入占比
表:2012-2013年Glencore Xstrata钴业务(分矿区)产量
图:截止2013年10月Glencore Xstrata伴生矿钴分布
图:2008-2013年Vale营业收入与净利润
表:2010-2012年Vale(分业务)营业收入及同比增长
表:2010-2012年Vale(分地区/分国家)营业收入及占比
表:2010-2013年Vale(分矿区)钴产量
图:2010-2013年Vale钴产品销量及产销率
图:2011-2013年Vale钴产品营业收入
表:2011-2012年Vale钴矿储量及等级
图:2010-2013年Vale在中国营业收入及同比增长
图:2012年FCX主营矿(分地区/分产品)资源量及销量
图:2008-2013年Freeport营业收入与净利润
图:2012年Freeport(分产品)营业收入占比
图:2010-2012年Freeport(分国家/地区)营业收入
图:2010-2013年Freeport钴业务营业收入与毛利润
图:2010-2013年Freeport钴业务产销量及均价
图:2008-2012年Freeport在中国营业收入及同比增长
图:2008-2013年格林美营业收入与净利润
图:2012年格林美(分产品)营业收入占比
图:2008-2012年格林美(分地区)营业收入
图:2009-2012年格林美(分产品)毛利率
表:2012年格林美(分方式)采购占比
图:2010-2012年格林美研发支出及占比
表:2010-2012年格林美钴粉产能、产量及产能利用率
图:2009-2012年格林美钴粉销售均价
图:2008-2012年格林美钴粉营业收入与毛利率
表:2011-2016年格林美营业收入与净利润
表:华友钴业矿权矿藏量及品位情况
图:华友钴业子公司分布
图:2010-2013年华友钴业营业收入与净利润
表:2010-2013年华友钴业(分产品)营业收入及占比
表:2010-2012年华友钴业钴产品和铜产品产销量、产能及收入
图:2010-2013年华友钴业(分产品)毛利率
表:截止2013年3月底华友钴业在建项目
图:2010-2012年华友钴业钴产品产(分方式)产量
表:2010-2012年华友钴业钴产品产销量、产能及销售收入
图:2009-2013年金川股份营业收入与净利润
表:2009-2013年金川股份(分产品)营业收入及占比
图:2010-2013年金川股份毛利率
表:截止2012年9月金川股份在建及拟建项目规划
图:2009-2012年金川股份钴金属产销量
图:2009-2013年金川集团钴产品营业收入
图:2009-2012年金川股份钴金属自给率
表:2012-2016年金川股份营业收入与净利润
图:2007-2013年金岭矿业营业收入与净利润
图:2012年金岭矿业(分产品)营业收入占比
图:2008-2012年金岭矿业(分地区)营业收入
图:2008-2012年金岭矿业(分产品)毛利率
表:2009-2013年金岭矿业钴产销量及产销率
图:2008-2012年金岭矿业钴营业收入及同比增长
表:2012-2016年金岭矿业营业收入与净利润
图:2009-2013年成都华泽镍钴材料有限公司营业收入与净利润
表:2009-2012年成都华泽镍钴材料公司氯化钴产销量及产销率
图:2007-2013年当升科技营业收入与净利润
图:2008-2012年当升科技(分业务)营业收入
图:2008-2012年当升科技(分地区)营业收入
图:2008-2012年当升科技(分业务)毛利率
图:2007-2013年当升科技钴酸锂产能
表:2012-2016年当升科技营业收入与净利润
图:瑞木镍钴项目股权结构图
图:2012-2013年江钨镍钴新材料公司净资产与净利润
图:2012年全球及中国主要钴生产企业营业收入及同比增长
图:2012年全球及中国主要钴生产企业净利润及同比增长
表:2010-2012年全球及中国主要企业钴产销量及产销率
图:2011-2012年全球及中国主要钴企业钴业务营业收入及同比增长
表:2012-2016年全球精炼矿市场供需平衡
Cobalt Industry Chain
Global Cobalt Reserves by Country, 2013
Global Cobalt Output and YoY Growth, 2005-2013
Global Refined Cobalt Output and YoY Growth, 2005-2013
Global Refined Cobalt Supply and Demand Balance Sheet, 2008-2013
Global Cobalt Market Consumption Structure, 2012
Structure (%) of Global Cobalt Output by Country, 2012
Structure (%) of Global Cobalt Consumption by Country/Region, 2012
Delivery Price of Cobalt on MB Free Market, 2006-2013
Structure (%) of Global Refined Cobalt Output by Company, 2012
Global Refined Cobalt Output by Company, 2001-2012
Policies on Cobalt Industry in China, 2011-2013
Structure (%) of China Cobalt Mineral Resources Reserves by Provinces and Cities
China’s Output of Cobalt, 2005-2013
China’s Output of Primary Cobalt and YoY Growth, 2005-2013
China’s Cobalt Consumption and YoY Growth, 2006-2013
Structure (%) of China’s Cobalt Consumption by Application, 2012
Average Price of Cobalt in China Changjiang Nonferrous Market and MB Free Market, 2007-2013
Cobalt Production Capacity of Major Chinese Manufacturers, 2013
Import Volume and Import Value of Cobalt Ores and Concentrates in China, 2006 -2013
China’s Import Volume of Cobalt Ores and Concentrates by Country, Jan-Sep, 2013
China’s Import Volume and Import Value of Cobaltosic Oxide, 2006 -2013
China’s Export Volume and Export Value of Cobaltosic Oxide, 2006 -2013
Structure (%) of China’s Export Volume of Cobaltosic Oxide by Country, Jan-Sep, 2013
China’s Import Volume and Import Value of Cobalt Chloride, 2006 -2013
China’s Export Volume and Export Value of Cobalt Chloride, 2006 -2013
Structure (%) of China’s Export Volume of Cobaltosic Oxide by Country, Jan-Sep 2013
China’s Import Volume and Import Value of Cobalt Carbonate, 2006-2013
China’s Export Volume and Export Value of Cobalt Carbonate, 2006-2013
Structure (%) of China’s Export Volume of Cobalt Carbonate by Country, Jan-Sep, 2013
China’s Import Volume and Import Value of Cobalt Nitrate, 2006 -2013
China’s Export Volume and Export Value of Cobalt Nitrate, 2006 -2013
Structure (%) of China’s Export Volume of Cobalt Nitrate by Country, Jan-Sep, 2013
China’s Export Volume and Export Value of Cobalt Oxalate, 2006 -2013
Revenue and Net income of Umicore, 2008-2013
Revenue of Umicore by Business, 2008-2013
Revenue Structure (%) of Umicore by Business, 2012
Total Revenue Structure (%) of Umicore by Region, 2012
R&D Costs and % of Total Revenue of Umicore, 2006-2013
Revenue and Profit from Energy Material Business of Umicore, 2008-2013
Output and YoY Growth of Refined Cobalt of Umicore, 2001-2012
Major Investment Plans of Umicore’s Energy Material Business Department, 2013-2014
Umicore’s Subsidiaries in China, by the End of 2012
Umicore’s Major Construction Projects in China, 2012-2015E
Revenue and Net income of Umicore, 2011-2016E
Revenue and Net income of Glencore Xstrata, 2012-2013
Revenue Structure (%) of Glencore Xstrata by Business, H1 2013
Cobalt Output of Glencore Xstrata by Mine Area, 2012-2013
Distribution of Associated Cobalt Ores of Glencore Xstrata, by Oct 2013
Revenue and Net income of Vale, 2008-2013
Revenue and YoY Growth of Vale by Business, 2010-2012
Revenue and Revenue Proportion of Vale by Region/Country, 2010-2012
Cobalt Output of Vale by Mine Area, 2010-2013
Cobalt Product Sales Volume and Sales-Output Ratio of Vale, 2010-2013
Vale’s Revenue from Cobalt Products, 2011-2013
Cobalt Ore Reserves and Grades of Vale, 2011-2012
Vale’s Revenue and YoY Growth in China, 2010-2013
Reserves and Sales Volume of Major Mines of FCX (by Regions/by Products), 2012
Revenue and Net income of Freeport, 2008-2013
Revenue Structure (%) of Freeport by Product, 2012
Revenue Breakdown of Freeport by Country/Region, 2010-2012
Cobalt Business Revenue and Gross Profit of Freeport, 2010-2013
Cobalt Output and Sales Volume and Average Price of Freeport, 2010-2013
Revenue and YoY Growth of Freeport in China, 2008-2012
Revenue and Net income of Shenzhen Green Eco-Manufacture, 2008-2013
Revenue Structure (%) of Shenzhen Green Eco-Manufacture by Product, 2012
Revenue of Shenzhen Green Eco-Manufacture by Region, 2008-2012
Gross Margin of Shenzhen Green Eco-Manufacture by Product, 2009-2012
Structure (%) of Procurement of Shenzhen Green Eco-Manufacture by Means, 2012
R&D Costs and % of Total Revenue of Shenzhen Green Eco-Manufacture, 2010-2012
Production Capacity, Output and Capacity Utilization of Cobalt Powder of Shenzhen Green Eco-Manufacture, 2010-2012
Cobalt Powder Average Selling Price of Shenzhen Green Eco-Manufacture, 2009-2012
Cobalt Powder Revenue and Gross Margin of Shenzhen Green Eco-Manufacture, 2008-2012
Revenue and Net income of Shenzhen Green Eco-Manufacture, 2011-2016E
Reserves and Grades of Mines with Mining Rights of Huayou Cobalt
Distribution of Subsidiaries of Huayou Cobalt
Revenue and Net income of Huayou Cobalt, 2010-2013
Revenue and Proportion of Huayou Cobalt by Product, 2010-2013
Production and Sales, Capacity and Revenue of Cobalt and Copper Products of Huayou Cobalt, 2010-2012
Gross Margin of Huayou Cobalt by Product, 2010-2013
Projects under Construction of Huayou Cobalt, by end-March, 2013
Output of Cobalt Products of Huayou Cobalt by Means, 2010-2012
Production and Sales, Capacity and Revenue of Cobalt Products of Huayou Cobalt, 2010-2012
Revenue and Net income of Jinchuan Group, 2009-2013
Revenue and Proportion of Jinchuan Group by Product, 2009-2013
Gross Margin of Jinchuan Group, 2010-2013
Proposed Projects and Ongoing Projects of Jinchuan Group, as of Sep 2012
Cobalt Metal Production and Sales of Jinchuan Group, 2009-2012
Cobalt Product Revenue of Jinchuan Group, 2009-2013
Self-Sufficiency Rate of Cobalt Metal of Jinchuan Group, 2009-2012
Revenue and Net income of Jinchuan Group, 2012-2016
Revenue and Net income of Shandong Jinling Mining, 2007-2013
Revenue Proportion of Shandong Jinling Mining by Product, 2012
Revenue of Shandong Jinling Mining by Region, 2008-2012
Gross Margin of Shandong Jinling Mining by Product, 2008-2012
Cobalt Production and Sales and Sales-Output Ratio of Shandong Jinling Mining, 2009-2013
Revenue and YoY Growth of Shandong Jinling Mining, 2008-2012
Revenue and Net income of Shandong Jinling Mining, 2012-2016E
Revenue and Net income of Chengdu Huaze Cobalt and Nickel Material, 2009-2013
Cobalt Chloride Production and Sales and Sales-Output Ratio of Chengdu Huaze Cobalt and Nickel Material, 2009-2012
Revenue and Net income of Beijing Easpring Material, 2007-2013
Revenue of Beijing Easpring Material by Business, 2008-2012
Revenue of Beijing Easpring Material by Region, 2008-2012
Gross Margin of Beijing Easpring Material by Business, 2008-2012
Production Capacity of Lithium Cobalt Oxide of Beijing Easpring Material, 2007-2013
Revenue and Net income of Beijing Easpring Material, 2012-2016E
Shareholding Structure of Projects of Ramu Nico Management Limited
Net Assets and Net income of Jiangxi Jiangwu Nickel and Cobalt New Materials, 2012-2013
Revenue and YoY Growth of Global and Chinese Major Cobalt Producers, 2012
Net income and YoY Growth of Global and Chinese Major Cobalt Producers, 2012
Cobalt Production and Sales and Sales-Output Ratio of Global and Chinese Major Cobalt Companies, 2010-2012
Revenue and YoY Growth of Global and Chinese Major Cobalt Companies, 2011-2012
Supply and Demand Balance of the Global Refining Ore Market, 2012-2016E
如果这份报告不能满足您的要求,我们还可以为您定制报告,请 留言说明您的详细需求。
|