|
|
|
报告导航:研究报告—
TMT产业—电子半导体
|
|
2013-2014年全球及中国半导体设备行业研究报告 |
 |
字数:1.3万 |
页数:110 |
图表数:153 |
|
中文电子版:8000元 |
中文纸版:4000元 |
中文(电子+纸)版:8500元 |
|
英文电子版:2200美元 |
英文纸版:2300美元 |
英文(电子+纸)版:2500美元 |
|
编号:ZYW165
|
发布日期:2014-01 |
附件:下载 |
 |
|
|
在经历两年的衰退后,半导体设备市场有望在2014年取得成长。2011年半导体设备市场达到创纪录的435.32亿美元,之后在2012年衰退15.2%, 2013年继续衰退8.1%。衰退的原因主要是来自北美和韩国的订单大幅度减少,北美订单的减少主要是因为Intel,PC市场衰退导致Intel减少了设备支出,而韩国订单的减少主要是DRAM投资基本停止。 2014年,半导体设备市场的驱动力主要源自Foundry和Memory,Foundry开始向20nm以下进军,Memory则开始进入3D时代。 20nm时代,半导体厂家采取两条路线,一条是double/multiple patterning,双重或多重曝光,另一条是EUV。双重或多重曝光会大幅度增加制造成本和设备成本,特别是蚀刻设备(Etching),但是相对EUV,双重或多重曝光比较成熟。 EUV可以大幅度降低制造成本和设备成本,虽然EUV本身设备成本高达1亿美元,但按总体成本核算,14nm级别的Wafer,使用EUV仍然要比多重曝光成本要低40%左右。不过EUV目前还有很多问题未解决,主要是光源的问题,多电子光束直写(multiple e-beam direct write)的方法每小时还不到一片,效率太低,达不到实用阶段。 设备厂家已经无法跟上Foundry的步伐,但Foundry必须等待设备厂家,尤其是几乎垄断全球光刻机Lithography市场ASML的脚步。未来Foundry厂将不得不放慢向Advanced Node前进的步伐,客户可以接受双重曝光的成本,但是三重曝光的成本恐怕是客户无法接受的。但是这不妨碍厂家对此领域继续研究,因此设备采购仍然是增长的。 半导体设备产业整合不断,龙头厂家Applied Material在2013年收购了排名第二的Tokyo Electron,进一步巩固了自己的地位,在蚀刻市场的市场占有率得到大幅度提高。 台湾成为最大的半导体设备市场,TSMC、UMC大量采购先进设备,预计2014年台湾半导体设备市场规模达到109.9亿美元,2015年轻微下滑到108.8亿美元。 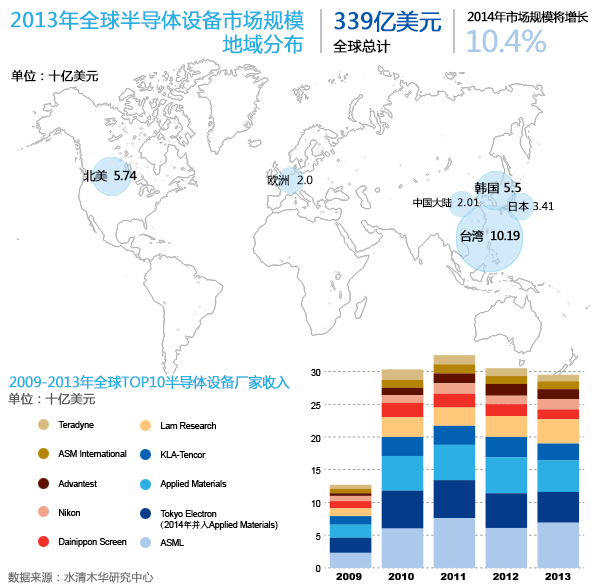
After two years of recession, the semiconductor equipment market is
projected to achieve growth in 2014. In 2011, the semiconductor
equipment market size hit a record high of USD43.532 billion, but it
witnessed a drop by 15.2% in 2012 and a further decline by 8.1% in 2013.
The reduction came mainly as the steep decrease of backlog orders from
North America and South Korea. Notably, the contracted orders from North
America resulted largely from the glooming PC market and Intel’s
reduction of capital expenditure for equipment, while the shrinkage of
orders from South Korea was heavily duel to the suspension of investment
in DRAM. In 2014, the driving force of the semiconductor
equipment market is mainly sourced from foundry and memory. In
particular, foundry began to step into 20nm domain, while memory is
ushering in 3D era. In the era of 20nm, semiconductor vendors employ two
routes: double/multiple patterning and EUV. Double/multiple patterning
is more technologically advanced than EUV, although it means substantial
cost rise in manufacturing and equipments, especially for etching
equipments. EUV can cut the manufacturing and equipments cost
significantly, albeit EUV itself costs as high as USD100 million. But
counted by the total cost, 14nm wafer equipped with EUV technology is
roughly 40% lower than that equipped with multiple patterning
technology. However, there are many hurdles for EUV remained to be
addressed. One of them is light source. Multiple e-beam direct write is
well low-efficiency, thus failing to meet the standard for practical
use. Equipment vendors have failed to catch up with the
development of foundry, especially the ASML which almost monopolize the
global lithography market, so foundry will have to slow down their pace
towards advanced node. The cost of multiple patterning may be OK for
customers, but it is not the case when it comes to the cost of triple
patterning. Nevertheless, this cannot prevent industrial players from
making continued research, so the procurement of equipments still keeps
growing. The semiconductor equipment industry is experiencing
ceaseless integration. Take Applied Material for example, it took over
second-ranked Tokyo Electron in 2013, further consolidating its position
with the market occupancy in the etching market on a big rise. Taiwan
became the largest semiconductor equipment market. Taiwan-based
industrial players such as TSMC and UMC make bulk buying of advanced
equipments. The estimate shows that Taiwan semiconductor equipment
market size will bag USD10.99 billion by 2014 and that the figure by
2015 will slightly decline to USD10.88 billion.
第一章、全球半导体产业
1.1、全球半导体产业概况
1.2、DRAM内存产业
1.2.1、DRAM内存产业现状
1.2.2、DRAM内存厂家市场占有率
1.2.3、移动DRAM内存厂家市场占有率
1.3、NAND闪存
1.4、IC制造与晶圆代工
1.5、IC封测产业概况
1.6、中国IC市场
1.7、中国大陆半导体产业
第二章、半导体设备产业
2.1、半导体设备市场
2.2、刻蚀设备产业
2.3、薄膜沉积设备产业
2.4、光刻机设备产业
2.5、下一代是是EUV还是Multiple Patterning
2.6、半导体进程控制设备
2.7、复合半导体设备市场
2.7.1、Aixtron
2.7.2、VEECO
2.8、半导体设备厂家排名
第三章、主要半导体设备厂家研究
3.1、Applied Materials
3.2、ASML
3.3、Tokyo Electron
3.4、KLA-Tencor
3.5、Lam Research
3.6、DAINIPPON SCREEN
3.7、尼康精机
3.8、Advantest
3.9、Hitachi High-Technologies
3.10、ASM International N.V.
3.11、Teradyne
3.12、ASM太平洋
3.13、Kulicke & Soffa
第四章、半导体下游市场研究
4.1、手机市场
4.1.1、全球手机市场规模
4.1.2、智能手机市场与产业
4.1.3、中国手机市场概况
4.2、 PC市场
4.2.1、台式机市场
4.2.2、笔记本电脑市场
4.2.3、平板电脑市场
1 Global Semiconductor Industry
1.1Overview
1.2 DRAM Memory Industry
1.2.1 Status Quo
1.2.2 Market Share of DRAM Memory Vendors
1.2.3 Market Share of Mobile DRAM Memory Vendors
1.3 NAND Flash Memory
1.4 IC Fabrication and Wafer Foundry
1.5 Overview of IC Packaging and Testing Industry
1.6 Chinese IC Market
1.7 Semiconductor Industry in Mainland China
2 Semiconductor Equipment Industry
2.1 Semiconductor Equipment Market
2.2 Etching Equipment Industry
2.3 Thin Film Deposition Equipment Industry
2.4 Lithography Equipment Industry
2.5 EUV or Multiple Patterning for the Next Generation
2.6 Semiconductor Process Control Equipment
2.7 Compound Semiconductor Equipment Market
2.7.1 Aixtron
2.7.2 VEECO
2.8 Ranking of Semiconductor Equipment Vendors
3 Major Semiconductor Equipment Vendors
3.1 Applied Materials
3.2 ASML
3.3 Tokyo Electron
3.4 KLA-Tencor
3.5 Lam Research
3.6 DAINIPPON SCREEN
3.7 Nikon Precision
3.8 Advantest
3.9 Hitachi High-Technologies
3.10 ASM International N.V.
3.11 Teradyne
3.12 ASM Pacific
3.13 Kulicke & Soffa
4 Semiconductor Downstream Market
4.1 Mobile Phone Market
4.1.1 Global Mobile Phone Market Size
4.1.2 Smart Phone Market and Industry
4.1.3 Overview of Chinese Mobile Phone Market
4.2 PC Market
4.2.1 Desktop Market
4.2.2 Laptop Market
4.2.3 Tablet PC Market
2009-2014年全球半导体产业季度收入
2008-2017年全球半导体产业年度收入
2012-2017年全球半导体市场产品分布
2012-2017年各种半导体产品市场规模增幅
2008-2017年全球半导体设备资本支出额
2008-2017年全球半导体设备资本支出额下游分布
2000-2012年DRAM产业CAPEX
2000-2013年全球DRAM出货量
2009年10月-2012年1月DRAM合约价涨跌幅
2005年1季度-2012年4季度全球DRAM厂家收入
2010年1季度-2012年4季度全球DRAM晶圆出货量
2001-2013年 系统内存需求量
4Q11\3Q13 Revenue Ranking for Branded DRAM Vendor
Q13 Revenue Ranking for Branded Mobile DRAM Vendor
4Q2011\3Q2013 Sales Ranking of Branded Nand Flash Makers
2008-2017年全球Foundry市场规模
2012-2017 Foundry Revenue of Advanced Nodes
2013年全球十大晶圆厂产能
2005-2011年全球晶圆代工厂销售额排名
2012-2017年全球IC Packaging and Test市场规模
2012-2017年全球Outsourcing IC Packaging and Test市场规模
2012-2017年全球IC Packaging 市场规模
2012-2017年全球IC Test市场规模
2009-2013年台湾封测产业收入
2010-2015年中国半导体市场规模
2010-2015年中国IC市场规模
2010-2015年中国Discrete Semiconductor Devices市场规模
2006-2013年中国IC进口额
2006-2013年中国IC出口额
2000年1季度-2013年3季度全球20家上市半导体设备企业收入与利润
2000年1季度-2013年3季度半导体资本支出地域分布
2010-2016年半导体设备市场规模
2010-2015年半导体设备市场规模地域分布
2007-2016全球晶圆设备投入规模
2012-2013年全球TOP 10 半导体厂家资本支出额
2010-2012年全球晶圆设备开支地域分布
2004-2014 Semiconductor Materials Market By Region
2013F Wafer Fabrications Materials Market By Region
2008-2012年Etching Market by Solution
2000\2005\2010\2013刻蚀设备市场主要厂家市场占有率
2000\2005\2010年全球CVD、PVD、ECD、CMP主要厂家市场占有率
2008-2012年Deposition market by Solution
2012 Deposition market share
1992-2011年全球光刻机厂家市场占有率
1995-2012年半导体进程控制设备市场增幅
AIXTRON全球分布
2003-2013年AIXTRON收入与EBIT
1999-2012年AIXTRON收入下游应用分布
2011年4季度-2013年3季度AIXTRON新订单
2011年2季度-2013年3季度AIXTRON Order Backlog
2004-2013年VEECO收入与运营利润率
2007-2013年VEECO MOCVD市场占有率
2006-2013年 全球半导体设备厂家收入排名
2007-2013财年AMAT销售额与毛利率、运营利润率
2007-2011年AMAT新订单额与在手订单额
2010年1季度-2011年4季度AMAT新订单额与运营利润
2010年1季度-2011年4季度AMAT销售额与运营利润率
2009-2011年AMAT新订单地域与分布
2009-2011年AMAT新订单部门分布
2010-2011年AMAT在手订单部门分布
2009-2011年AMAT销售额地域分布
2009-2011年AMAT销售额部门分布
2011-2013 Display部门收入地域分布
2009-2011年AMAT半导体设备部门新订单业务分布
AMAT与TEL合并后产品线分布
2007-2013年ASML销售额与毛利率
2007年1季度-2013年3季度ASML销售额
2012年1季度-2013年3季度每季度ASML销售额与运营利润率
2012年1季度-2013年3季度每季度ASML销量与ASP
2012年1季度-2013年3季度每季度ASML销售额与Netbooking
2010-2013年ASML在手订单额地域分布
2010-2012年ASML销售额地域分布
2010-2013年ASML在手订单额下游应用分布
2010-2013年ASML在手订单额技术分布
ASML路线图
2005-2014财年TEL销售额与运营利润率
TEL全球分布
2006-2014财年TEL收入业务分布
2006-2014财年TEL SEMI EQUIPMENT销售额地域分布
2011财年1季度-2014年2季度TEL新订单
2011财年1季度-2014年2季度TEL新订单地域分布
2005年4季度-2013年3季度TEL半导体设备下游应用分布
2009财年-2014财年TEL R&D Expenses and Capex
2013财年2季度-2014财年2季度TEL资产与负债
2007-2014财年KLA-Tencor收入与运营利润率
2009-2013财年KLA-Tencor收入业务分布
2010-2013年KLA-Tencor收入下游应用分布
2009-2013财年KLA-Tencor收入地域分布
2007-2014财年Lam Research收入与运营利润率
2007-2011年Novellus收入与净利润
2010年1季度-2011年4季度Novellus销售额与毛利
2010年1季度-2011年4季度Novellus Net Order与环比增幅
2009-2011年Novellus收入地域分布
2011-2014财年Lam Research收入下游应用分布
2009-2014财年Lam Research收入地域分布
DAINIPPON SCREEN MFG组织结构
2007-2014财年DAINIPPON SCREEN收入与运营利润率
2011财年2季度-2014财年2季度DAINIPPON SCREEN每季度各部门收入与运营利润率
2011财年2季度-2014财年2季度DAINIPPON SCREEN每季度各部门新订单与在手订单
2011财年2季度-2014财年2季度DAINIPPON SCREEN半导体设备部门订单下游应用分布
2014财年DAINIPPON SCREEN半导体设备部门订单地域分布
2010-2013财年DAINIPPON SCREEN资产负债表
2006-2014财年尼康精机销售额与运营利润率
FY2012-2014 NIKON Precision Equipment IC Steppers & Scanners Sales by Technology
FY2012-2014 NIKON Precision Equipment LCD Steppers & Scanners Sales by Generation
2012财年1季度-2013财年2季度Advantest毛利率与运营利润
2012财年1季度-2013财年2季度Advantest新订单部门分布
2012财年1季度-2013财年2季度Advantest新订单地域分布
2012财年1季度-2013财年2季度Advantest销售额部门分布
2012财年1季度-2013财年2季度Advantest销售额地域分布
2012财年1季度-2013财年2季度Advantest Capex
2012年3季度-2013年3季度Advantest 资产负债
Advantest全球分布
2007-2014财年Hitachi High-Technologies收入与运营利润率
2011-2014财年Hitachi High-Technologies收入部门分布
2011-2014财年Hitachi High-Technologies运营利润部门分布
2013-2014财年Hitachi High-Technologies Electronic Device Systems收入业务分布
2013-2014财年Hitachi High-Technologies Electronic Device Systems Front-end 收入Field 分布
2006-2013年ASM销售额与运营利润率
2006-2011年ASM销售额业务分布
ASM 2007年1季度-2013年3季度Net Sales 和EBIT
ASM 2007年1季度-2013年3季度Bookings & Backlog
2010-2012年ASM Front-end业务销售额地域分布
2006-2013年Teradyne收入与营业利润率
Q4/11、Q2/13、Q3/13季度 Teradyne Booking地域分布
Q4/11、Q2/13、Q3/13季度 Teradyne Sales地域分布
Q2/13、Q3/13季度 Teradyne Sales业务分布
ASM分支结构
2008-2013年ASM太平洋收入与营业利润
ASM太平洋产品线
2012-2013年ASM太平洋收入业务分布
2013年前3季度ASM EBIT业务分布
2012-2013年ASM太平洋收入地域分布
2007-2014年Kulicke & Soffa收入与运营利润率
2011-2013财年Kulicke & Soffa前10大客户
Kulicke & Soffa全球分布
2010年1季度-2011年4季度Kulicke & Soffa收入与运营利润率
2008-2017年Wire Bonder Equipment Market
2012-2017 Copper Bonder Unit
2011年1季度-2013年4季度全球手机出货量
2007-2014年全球手机出货量
2011-2014年全球3G/4G手机出货量地域分布
2013年2季度智能手机操作系统出货量和市场占有率
2013年2季度主要安卓手机厂商出货量和市场占有率
2013年2季度主要Windows Phone 智能手机厂商出货量和市场占有率
2011-2013中国主要智能手机厂家出货量
2013年中国手机市场主要厂家市场占有率
2008-2015年Desktop PC出货量
Worldwide Device Shipments by Operating System (Thousands of Units)
Top 5 Vendors, Worldwide PC Shipments, Fourth Quarter 2013
Top 5 Vendors, Worldwide PC Shipments 2013
2008-2015年笔记本电脑出货量
2010-2013年全球主要笔记本电脑ODM厂家出货量
2011-2016年全球平板电脑出货量
2013年平板电脑主要品牌市场占有率
Quarterly Revenue of Global Semiconductor Industry, 2009-2014
Yearly Revenue of Global Semiconductor Industry, 2008-2017E
Product Distribution of Global Semiconductor Market, 2012-2017E
Market Size and Growth Rate of Various Semiconductor Products, 2012-2017E
Global Semiconductor Equipment Capital Expenditure, 2008-2017E
Downstream Distribution of Global Semiconductor Equipment Capital Expenditure, 2008-2017E
CAPEX of DRAM Industry, 2000-2012
Global DRAM Shipment, 2000-2013
Change of DRAM Contract Price, Oct 2009-Jan 2012
Revenue of Global DRAM Vendors, Q1 2005-Q4 2012
Global DRAM Wafer Shipment, Q1 2010-Q4 2012
System Memory Demand, 2001-2013
Revenue Ranking for Branded DRAM Vendors, Q4 2011-Q3 2013
Revenue Ranking for Branded Mobile DRAM Vendors, Q3 2013
Sales Ranking of Branded NAND Flash Makers, Q4 2011-Q3 2013
Global Foundry Market Size, 2008-2017E
Foundry Revenue of Advanced Nodes, 2012-2017E
Capacity of Top 10 Global Foundries, 2013
Sales Ranking of Global Foundries, 2005-2011
Global IC Packaging and Testing Market Size, 2012-2017E
Global Outsourced IC Packaging and Testing Market Size, 2012-2017E
Global IC Packaging Market Size, 2012-2017E
Global IC Testing Market Size, 2012-2017E
Revenue of Taiwan's IC Packaging and Testing Industry, 2009-2013
China’s Semiconductor Market Size, 2010-2015E
China’s IC Market Size, 2010-2015E
China’s Discrete Semiconductor Device Market Size, 2010-2015E
China’s IC Import Value, 2006-2013
China’s IC Export Value, 2006-2013
Revenue and Profit of 20 Global Listed Semiconductor Equipment Enterprises, Q1 2000-Q3 2013
Geographical Distribution of Semiconductor Capital Expenditure, Q1 2000-Q3 2013
Semiconductor Equipment Market Size, 2010-2016E
Geographical Distribution of Semiconductor Equipment Market Size, 2010-2015E
Global Wafer Equipment Investment, 2007-2016E
Capital Expenditure of Global Top 10 Semiconductor Vendors, 2012-2013
Geographical Distribution of Global Wafer Equipment Expenditure, 2010-2012
Semiconductor Materials Market by Region, 2004-2014
Wafer Fabrications Materials Market by Region, 2013
Etching Market by Solution, 2008-2012
Market Share of Major Etching Equipment Vendors, 2000\2005\2010\2013
Market Share of Major Global CVD PVD ECD CMP Vendors, 2000\2005\2010
Deposition Market by Solution, 2008-2012
Deposition Market Share, 2012
Market Share of Global Lithography Equipment Vendors, 1992-2011
Growth Rate of Semiconductor Process Control Equipment Market, 1995-2012
Global Presence of AIXTRON
AIXTRON’s Revenue and EBIT, 2003-2013
AIXTRON’s Revenue by Application, 1999-2012
AIXTRON’s New Orders, Q4 2011-Q3 2013
AIXTRON’s Order Backlog, Q2 2011-Q3 2013
VEECO’s Revenue and Operating Margin, 2004-2013
VEECO’s MOCVD Market Share, 2007-2013
Ranking of Global Semiconductor Equipment Vendors by Revenue, 2006-2013
AMAT's Revenue, Gross Margin and Operating Margin, FY2007-2013
Value of AMAT's New Orders and Order Backlog, 2007-2011
Value of AMAT's New Orders and Operating Profit, Q1 2010-Q4 2011
AMAT's Revenue and Operating Margin, Q1 2010-Q4 2011
AMAT's New Orders by Region, 2009-2011
AMAT's New Orders by Division, 2009-2011
AMAT's Order Backlog by Division, 2010-2011
Geographical Distribution of AMAT's Revenue, 2009-2011
AMAT's Revenue by Division, 2009-2011
Geographical Distribution of Display Division’s Revenue, 2011-2013
New Orders of AMAT's Semiconductor Equipment Division by Business, 2009-2011
Product Line Distribution after Merger of AMAT and TEL
ASML's Revenue and Gross Margin, 2007-2013
ASML's Revenue, Q1 2007-Q3 2013
ASML's Quarterly Revenue and Operating Margin, Q1 2012-Q3 2013
ASML's Quarterly Sales Volume and ASP, Q1 2012-Q3 2013
ASML's Quarterly Revenue and Netbooking, Q1 2012-Q3 2013
ASML's Order Backlog by Region, 2010-2013
ASML's Revenue by Region, 2010-2012
ASML's Order Backlog by Application, 2010-2013
ASML's Order Backlog by Technology, 2010-2013
ASML's Roadmap
TEL’s Revenue and Operating Margin, FY2005-FY2014
Global Presence of TEL
TEL’s Revenue by Business, FY2006-FY2014
TEL’s Semi Equipment Revenue by Region, FY2006-2014
TEL’s New Orders, Q1 FY2011-Q2 FY2014
TEL’s New Orders by Region, Q1 FY2011-Q2 FY2014
TEL’s Semiconductor Equipment by Application, Q4 2005-Q3 2013
TEL’s R&D Expenses and Capex, FY2009-FY2014
TEL’s Assets and Liabilities, Q2 FY2013-Q2 FY2014
KLA-Tencor’s Revenue and Operating Margin, FY2007-FY2014
KLA-Tencor’s Revenue by Business, FY2009-FY2013
KLA-Tencor’s Revenue by Application, 2010-2013
KLA-Tencor’s Revenue by Region, FY2009-FY2013
Revenue and Operating Margin of Lam Research, FY2007-FY2014
Revenue and Net Income of Novellus, 2007-2011
Revenue and Gross Profit of Novellus, Q1 2010-Q4 2011
Net Orders and MoM Growth of Novellus, Q1 2010-Q4 2011
Revenue of Novellus by Region, 2009-2011
Revenue of Lam Research by Application, FY2011-FY2014
Revenue of Lam Research by Region, FY2009-FY2014
Organizational Structure of DAINIPPON SCREEN MFG
Revenue and Operating Margin of DAINIPPON SCREEN, FY2007-FY2014
Quarterly Revenue and Operating Margin of DAINIPPON SCREEN by Division, Q1 2010-Q4 2011
Quarterly New Orders and Order Backlog of DAINIPPON SCREEN by Division, Q1 2010-Q4 2011
Orders of Semiconductor Equipment Division of DAINIPPON SCREEN by Application, Q1 2010-Q4 2011
Orders of Semiconductor Equipment Division of DAINIPPON SCREEN by Region, FY2014
Balance Sheet of DAINIPPON SCREEN, FY2010-FY2013
Revenue and Operating Margin of Nikon Precision, FY2006-FY2014
IC Steppers & Scanners Sales of NIKON Precision Equipment by Technology, FY2012-FY2014
LCD Steppers & Scanners Sales of NIKON Precision Equipment by Generation, FY2012-FY2014
Advantest's Gross Margin and Operating Profit, Q1 FY2012-Q2 FY2013
Advantest's New Orders by Division, Q1 FY2012-Q2 FY2013
Advantest's New Orders by Region, Q1 FY2012-Q2 FY2013
Advantest's Revenue by Division, Q1 FY2012-Q2 FY2013
Geographical Distribution of Advantest's Revenue, Q1 FY2012-Q2 FY2013
Advantest's Capex, Q1 FY2012-Q2 FY2013
Advantest’s Assets and Liabilities, Q3 2012-Q3 2013
Global Presence of Advantest
Revenue and Operating Margin of Hitachi High-Technologies, FY2007-FY2014
Revenue of Hitachi High-Technologies by Division, FY2011-FY2014
Operating Profit of Hitachi High-Technologies by Division, FY2011-FY2014
Electronic Device System Revenue of Hitachi High-Technologies by Business, FY2013-FY2014
Electronic Device System Front-end Revenue Distribution of Hitachi High-Technologies, FY2013-FY2014
ASM’s Revenue and Operating Margin, 2006-2013
ASM’s Revenue by Business, 2006-2011
ASM’s Net Sales and EBIT, Q1 2007-Q3 2013
ASM’s Bookings & Backlog, Q1 2007-Q3 2013
ASM’s Front-end Revenue by Region, 2010-2012
Teradyne’s Revenue and Operating Margin, 2006-2013
Teradyne’s Quarterly Booking by Region, Q4/11 Q2/13 Q3/13
Teradyne’s Quarterly Sales by Region, Q4/11 Q2/13 Q3/13
Teradyne’s Quarterly Sales by Business, Q2/13 Q3/13
ASM PACIFIC’s Branches
ASM PACIFIC’s Revenue and Operating Profit , 2008-2013
ASM PACIFIC’s Product lines
ASM PACIFIC’s Revenue by Business, 2012-2013
ASM PACIFIC’s EBIT by Business, Q1-Q3 2013
ASM PACIFIC’s Revenue by Region, 2012-2013
Revenue and Operating Margin of Kulicke & Soffa, 2007-2014
Top 10 Clients of Kulicke & Soffa, FY2011-FY2013
Global Presence of Kulicke & Soffa
Revenue and Operating Margin of Kulicke & Soffa, Q1 2010-Q4 2011
Wire Bonder Equipment Market, 2008-2017E
Copper Bonder Unit, 2012-2017E
Global Mobile Phone Shipment, Q1 2011-Q4 2013
Global Mobile Phone Shipment, 2007-2014
Global 3G/4G Mobile Phone Shipment by Region, 2011-2014
Shipment and Market Share of Smart Phone Operating Systems, Q2 2013
Shipment and Market Share of Major Android Mobile Phone Vendors, Q2 2013
Shipment and Market Share of Major Windows Smart Phone Vendors, Q2 2013
Shipment of Major Chinese Smart Phone Vendors, 2011-2013
Market Share of Major Chinese Mobile Phone Vendors, 2013
Desktop PC Shipment, 2008-2015E
Worldwide Device Shipment by Operating System
Worldwide PC Shipment of Top 5 Vendors, Q4 2013
Worldwide PC Shipment of Top 5 Vendors, 2013
Laptop Shipment, 2008-2015E
Shipment of Major Global Laptop ODM Vendors, 2010-2013
Global Tablet PC Shipment, 2011-2016E
Market Share of Major Tablet PC Brands, 2013
如果这份报告不能满足您的要求,我们还可以为您定制报告,请 留言说明您的详细需求。
|