|
|
|
报告导航:研究报告—
金融与服务业—交通物流
|
|
2013-2016年中国航空运输及机场行业研究报告 |
 |
字数:3.9万 |
页数:141 |
图表数:162 |
|
中文电子版:9000元 |
中文纸版:4500元 |
中文(电子+纸)版:9500元 |
|
英文电子版:2200美元 |
英文纸版:2300美元 |
英文(电子+纸)版:2500美元 |
|
编号:LMX046
|
发布日期:2014-01 |
附件:下载 |
 |
|
|
2013年1-11月,中国民航全行业完成运输总周转量616.0亿吨公里,同比增长10.3%;旅客运输量3.26亿人,同比增长11.0%;货邮运输量506.7万吨,同比增长2.4%。相比2011和2012年增速下滑的趋势,2013年增速稍有回升。 在“宏观经济不振”叠加“高铁所带来的结构性影响”的综合作用下,中国航空业整体效益持续下滑。2013年前三季度,中国三大国有航空公司净利润同比有所下降,中国国航净利润40.61亿元,同比下滑3.69%;东方航空净利润36.21亿元,微幅下滑0.23%;南方航空净利润24.60亿元,同比下滑7.69%。但海南航空净利却逆市出现两位数增长,净利润21.84亿元,同比增长28.44%。 为改善业绩,2013年以来,中国航空公司主要通过两个途径寻求突破:加快开辟国际、地区航线和进军低成本航空领域。其中,东航、海航、春秋航空、吉祥航空等已在低成本航空业务上进行布局,不少国外低成本航空公司也在酝酿抢占中国市场。 目前,中国已开通低成本航空运营模式的仅春秋航空一家公司。春秋航空2004年成立,截止2014年1月,公司拥有40架空客A320-200型客机。2013年1-10月,春秋航空旅客运输量884.7万人次,同比增长14.69%。 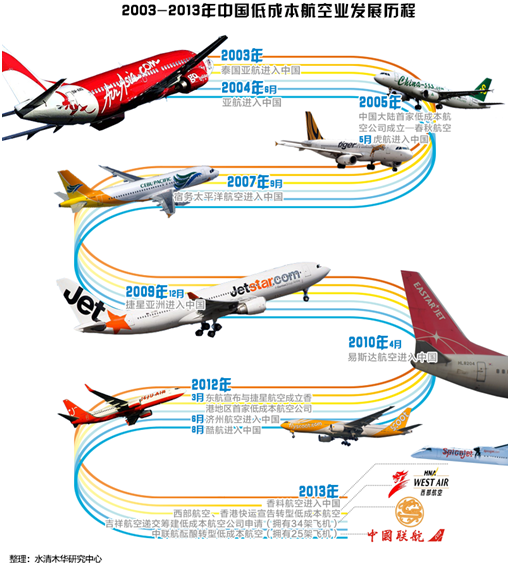
In January-November 2013, China’s civil aviation industry completed
total traffic turnover of 61.6 billion ton kilometers, up 10.3% YoY;
passenger transport volume of 326 million people, up 11.0% YoY; cargo
and mail traffic of 5.067 million tons, up 2.4% YoY. Compared to the
falling tendency in 2011 and 2012, growth rate recovered slightly in
2013. Under the comprehensive action of “sluggish macro-economy”
superimposed by “structural impact brought by high-speed rail”, the
overall effectiveness of Chinese aviation industry continues to decline.
For the first quarters of 2013, net income of China’s three major
state-owned airlines witnessed year-on-year decrease: Air China fell by
3.69% YoY to RMB4.061 billion; China Eastern Airlines RMB3.621 billion, a
slight decline of 0.23%; China Southern Airlines RMB2.46 billion, down
7.69% YoY. But Hainan Airlines embraced double-digit growth in net
income, which rose 28.44% YoY to RMB2.184 billion. In order to
improve their performance, Chinese airlines since 2013 have been looking
for breakthroughs mainly through two ways: to accelerate the open-up of
international and regional airlines and to tap into low-cost aviation
field. Among them, China Eastern Airlines, Hainan Airlines, Spring
Airlines, Juneyao Airlines, etc. have made layout in the low-cost
airline business, and many foreign low-cost airlines are also planning
to seize the Chinese market. So far, there is only Spring
Airlines that has opened the low-cost airline operating model in China.
Founded in 2004, Spring Airlines has boasted 40 Airbus A320-200
aircrafts as of January 2014; volume of passenger traffic reached 8.847
million persons-times in January-October 2013, a year-on-year increase
of 14.69%.
前言
第一章 中国航空运输业发展环境
1.1 经济环境
1.2 政策环境
1.3 社会环境
第二章 中国航空运输业运行状况及发展现状
2.1 运行指标
2.1.1 运力
2.1.2 运输周转量
2.1.3 运输量
2.1.4 运输效率
2.2 低成本航空市场分析
2.2.1 发展历程
2.2.2 发展现状
2.2.3 发展契机
2.3 航空货运业转型
2.3.1 航空公司涉足快递业
2.3.2 快递企业筹建航空公司
2.3.3 航空货运企业转型方向
第三章 中国机场运输行业运行状况
3.1 通航城市与机场数量
3.2 旅客吞吐量
3.3 货邮吞吐量
3.4 飞机起降架次
第四章 中国航空运输及机场行业经济效益分析
4.1 行业整体经济效益
4.2 细分行业
第五章 中国主要航空公司运营状况
5.1 航空公司竞争格局
5.1.1 业绩对比
5.1.2 运力对比
5.1.3 运输量对比
5.1.4 客座率对比
5.2 南方航空
5.2.1 公司简介
5.2.2 经营状况
5.2.3 运力
5.2.4 运载量
5.2.5 载运率
5.2.6 战略转型
5.2.7 业绩预测
5.3 东方航空
5.3.1 公司简介
5.3.2 经营状况
5.3.3 运力
5.3.4 运载量
5.3.5 载运率
5.3.6 发展战略
5.6.7 转型廉价航空
5.3.8 业绩预测
5.4 中国国航
5.4.1 公司简介
5.4.2 经营状况
5.4.3 运力
5.4.4 运载量
5.4.5 载运率
5.4.6 业绩预测
5.5 海南航空
5.5.1 公司简介
5.5.2 经营状况
5.5.3 运力
5.5.4 运载量
5.5.5 载运率
5.5.6 开拓西部市场
5.5.7 业绩预测
5.6 国泰航空
5.6.1 公司简介
5.6.2 经营状况
5.6.3 运力
5.6.4 运载量
5.6.5 载运率
5.6.6 业绩预测
5.7 山东航空
5.7.1 公司简介
5.7.2 经营状况
5.7.3 运力
5.7.4 运载量
5.7.5 业绩预测
5.8 深圳航空
5.8.1 公司简介
5.8.2 运力
5.8.3 运载量
5.8.4 载运率
5.9 厦门航空
5.9.1 公司简介
5.9.2 经营状况
5.9.3 运力
5.9.4 运载量
5.9.5 载运率
5.10 四川航空
5.11 华夏航空
5.12 中国联合航空
5.13 中国邮政航空
5.14 中国货运航空
5.15 春秋航空
5.16 奥凯航空
5.17 吉祥航空
第六章 中国主要机场运营状况
6.1 中国机场竞争格局
6.2 北京首都国际机场
6.2.1 机场简介
6.2.2 财务状况
6.2.3 旅客吞吐量
6.2.4 货邮吞吐量
6.2.5 飞机起降架次
6.2.6 业绩预测
6.3 上海机场(Shanghai Airport)
6.3.1 机场简介
6.3.2 财务状况
6.3.3 生产指标
6.3.4 业绩预测
6.4 白云机场(Baiyun Airport)
6.4.1 机场简介
6.4.2 财务状况
6.4.3 旅客吞吐量
6.4.4 货邮吞吐量
6.4.5 飞机起降架次
6.4.6 业绩预测
6.5 深圳机场(Shenzhen Airport)
6.5.1 机场简介
6.5.2 财务状况
6.5.3 旅客吞吐量
6.5.4 货邮吞吐量
6.5.5 飞机起降架次
6.5.6 竞争优势
6.5.7 业绩预测
6.6 成都双流国际机场
6.7 昆明长水国际机场
6.8西安咸阳国际机场
6.9 重庆江北国际机场
6.10 杭州萧山国际机场
6.11厦门高崎国际机场
6.12 长沙黄花国际机场
6.13 南京禄口国际机场
6.14 武汉天河国际机场
6.15 天津滨海国际机场
6.15.1 机场简介
6.15.2 旅客吞吐量
6.15.3 货邮吞吐量
6.15.4 飞机起降架次
6.15.5天津机场二期扩建工程
6.16 盐城南洋机场
6.16.1 机场简介
6.16.2 旅客吞吐量
6.16.3 货邮吞吐量
6.16.4 飞机起降架次
第七章 中国航空运输及机场行业总结及发展预测
7.1数字看民航2013年
7.2 发展预测
7.2.1 行业发展趋势
7.2.2数据预测
Preface
1. Development Environment for China Air Transport Industry
1.1 Economic Environment
1.2 Policy Environment
1.3 Social Environment
2. Operation and Development Status of China Air Transport Industry
2.1 Operation Indicators
2.1.1 Capacity
2.1.2 Traffic Turnover
2.1.3 Traffic Volume
2.1.4 Traffic Efficiency
2.2 Low-Cost Aviation Market
2.2.1 Development Process
2.2.2 Development Status
2.2.3 Development Opportunities
2.3 Air Cargo Industry Transition
2.3.1 Airlines Step into Express Industry
2.3.2 Express Enterprises Prepare to Build Airlines
2.3.3 Direction of Air Cargo Enterprise Transition
3. Operation of China Airport Transportation Industry
3.1 Number of Navigable Cities and Airports
3.2 Passenger Throughput
3.3 Cargo & Mail Throughput
3.4 Aircraft Movements
4. Economic Benefits of China Air Transport and Airport Industry
4.1 Overall
4.2 Industry Segments
5. Operation of Major Chinese Airlines
5.1 Competition Pattern
5.1.1 Performance
5.1.2 Capacity
5.1.3 Traffic Volume
5.1.4 Passenger Load Factor
5.2 China Southern Airlines
5.2.1 Profile
5.2.2 Operation
5.2.3 Capacity
5.2.4 Traffic
5.2.5 Load Factor
5.2.6 Strategy Transition
5.2.7 Performance Forecast
5.3 China Eastern Airlines
5.3.1 Profile
5.3.2 Operation
5.3.3 Capacity
5.3.4 Traffic
5.3.5 Load Factor
5.3.6 Development Strategy
5.3.7 Transition to Low-Cost Airlines
5.3.8 Performance Forecast
5.4 Air China
5.4.1 Profile
5.4.2 Operation
5.4.3 Capacity
5.4.4 Traffic
5.4.5 Load Factor
5.4.6 Performance Forecast
5.5 Hainan Airlines
5.5.1 Profile
5.5.2 Operation
5.5.3 Capacity
5.5.4 Traffic
5.5.5 Load Factor
5.5.6 Open up the Western Market
5.5.7 Performance Forecast
5.6 Cathay Pacific Airways
5.6.1 Profile
5.6.2 Operation
5.6.3 Capacity
5.6.4 Traffic
5.6.5 Load Factor
5.6.6 Performance Forecast
5.7 Shandong Airlines
5.7.1 Profile
5.7.2 Operation
5.7.3 Capacity
5.7.4 Traffic
5.7.5 Performance Forecast
5.8 Shenzhen Airlines
5.8.1 Profile
5.8.2 Capacity
5.8.3 Traffic
5.8.4 Load Factor
5.9 Xiamen Airlines
5.9.1 Profile
5.9.2 Operation
5.9.3 Capacity
5.9.4 Traffic
5.9.5 Load Factor
5.10 Sichuan Airlines
5.11 China Express
5.12 China United Airlines
5.13 China Postal Airlines
5.14 China Cargo Airlines
5.15 Spring Airlines
5.16 Okay Airways
5.17 Juneyao Airlines
6. Operation of Major Chinese Airports
6.1 Competition Pattern
6.2 Beijing Capital International Airport
6.2.1 Profile
6.2.2 Financials
6.2.3 Passenger Throughput
6.2.4 Cargo & Mail Throughput
6.2.5 Aircraft Movements
6.2.6 Performance Forecast
6.3 Shanghai Airport
6.3.1 Profile
6.3.2 Financials
6.3.3 Production Quotas
6.3.4 Performance Forecast
6.4 Baiyun Airport
6.4.1 Profile
6.4.2 Financials
6.4.3 Passenger Throughput
6.4.4 Cargo & Mail Throughput
6.4.5 Aircraft Movements
6.4.6 Performance Forecast
6.5 Shenzhen Airport
6.5.1 Profile
6.5.2 Financials
6.5.3 Passenger Throughput
6.5.4 Cargo & Mail Throughput
6.5.5 Aircraft Movements
6.5.6 Competitive Advantage
6.5.7 Performance Forecast
6.6 Chengdu Shuangliu International Airport
6.7 Kunming Wujiaba International Airport
6.8 Xi’an Xianyang International Airport
6.9 Chongqing Jiangbei International Airport
6.10 Hangzhou Xiaoshan International Airport
6.11 Xiamen Gaoqi International Airport
6.12 Changsha Huanghua International Airport
6.13 Nanjing Lukou International Airport
6.14 Wuhan Tianhe International Airport
6.15 Tianjin Binhai International Airport
6.15.1 Profile
6.15.2 Passenger Throughput
6.15.3 Cargo & Mail Throughput
6.15.4 Aircraft Movements
6.15.5 Phase II Expansion Project
6.16 Yancheng Nanyang Airport
6.16.1 Profile
6.16.2 Passenger Throughput
6.16.3 Cargo & Mail Throughput
6.16.4 Aircraft Movements
7. Summary and Forecasts for China Air Transport and Airport Industry
7.1 Digital Civil Aviation 2013
7.2 Development Forecast
7.2.1 Trends
7.2.2 Data Forecast
图:1991-2013年中国民航旅客周转量围绕GDP增速波动
表:2011-2013年中国航空运输行业相关法规及政策
表:2013年中国航空运输行业主要政策性措施
图:1990-2010年国内外航线人均乘机次数
图:2004-2013年中国民航民用飞机架数
图:2006-2013年中国民航运输飞机数量
图:2004-2012年中国民用航空航线条数
图:2008-2012年中国民航民用航空航线条数(分航线)
图:2006-2013年中国民航运输总周转量及同比增长
图:2010-2013年中国民航运输总周转量(分航线)
图:2007-2013年中国民航旅客周转量及同比增长
图:2007-2013年中国民航货邮周转量及同比增长
图:2007-2013年中国民航旅客运输量及同比增长
表:2010-2013年中国民航旅客运输量(分航线)
图:2006-2013年中国民航货邮运输量及同比增长
表:2010-2013年中国民航货邮运输量(分航线)
图:2009-2013年中国民航飞机日利用率
图:2010-2013年中国民航正班客座率与正班载运率
表:2003-2013年中国低成本航空业发展历程
图:1980-2012年中国和美国低成本航空市场占有率对比(按旅客客运量)
表:外国低成本航空公司在华布局
图:中国低成本航空公司发展困境
图:2007-2013年中国规模以上快递服务企业业务收入及同比变化
图:2013年底中国全货机数量
图:2007-2012年中国民用航空通航城市与运输机场数量
表:2012年中国运输机场数量区域分布
图:2007-2013年中国运输机场旅客吞吐量及同比增长
表:2010-2012年中国运输机场旅客吞吐量(分航线)
表:2012年中国旅客吞吐量100万人次以上的机场数量
图:2012年中国旅客吞吐量区域分布
图:2007-2013年中国运输机场货邮吞吐量及同比增长
表:2010-2012年中国运输机场货邮吞吐量(分航线)
图:2012年中国货邮吞吐量区域分布
图:2007-2013年中国机场飞机起降架次及同比增长
图:2009-2012年中国民航行业企业营业收入与利润总额
表:2012年中国民航行业营业收入和利润总额构成
图:2009-2012年中国民航行业航空公司营业收入与利润总额
图:2009-2012年中国民航行业机场营业收入与利润总额
表:2013年前三季度中国主要航空公司净利润排名
表:2013年前三季度中国主要航空公司营业收入排名
表:2013年中国主要航空公司国际、地区航线开通情况
表:2013上半年中国主要航空公司飞机拥有量排名
表:2013年中国主要航空公司三大运力指标对比
表:2013年中国主要航空公司运输量对比
表:2013年1-11月中国主要航空公司客座率对比
图:2009-2013年南方航空营业收入与净利润
图:2009-2013年南方航空主营业务收入构成
表:2012-2013年南方航空营运开支构成
表:2009-2013年南方航空飞机拥有量
表:2008-2013年南方航空三大运力指标
表:2008-2012年南方航空运载量情况
图:2010-2013年南方航空旅客运输量构成
图:2008-2013年南方航空载运率
表:南方航空战略转型之路
表:2014-2016年南方航空营业收入与净利润预测
图:2009-2013年东方航空营业收入与净利润
图:2009-2013年东方航空飞机拥有量
表:2008-2013年东方航空运力情况
表:2008-2013年东方航空运载量
图:2010-2013年东方航空旅客运输量构成
图:2008-2013年东方航空载运率
表:2014-2016年东方航空营业收入与净利润预测
图:2009-2013年中国国航营业收入与净利润
表:2012年中国国航营业成本构成
图:2009-2013年中国国航飞机拥有量
表:2008-2013年中国国航主要运力指标
表:2008-2013年中国国航运载量指标
图:2009-2013年中国国航旅客运输量构成
图:2008-2013年中国国航载运率
表:2014-2016年中国国航营业收入与净利润预测
图:2009-2013年海南航空营业收入与净利润
图:2009-2013年海南航空飞机拥有量
表:2008-2013年海南航空运力指标
表:2013年海南航空运力指标
表:2009-2013年海南航空主要载运量指标
图:2008-2013年海南航空载运率
图:2013年1-11月海南航空载运率
表:2013年海南航空西部市场开拓历程
表:2014-2016年海南航空营业收入与净利润预测
图:国泰航空及其附属公司、控股公司飞行航线
图:2009-2013年国泰航空营业收入与净利润
图:2012-2013年国泰航空营业开支构成
图:2009-2013年国泰航空飞机拥有量
表:2007-2013年国泰航空运力指标
表:2007-2013年国泰航空运载量指标
图:2013年1-11月国泰航空RPK分区域构成
图:2007-2013年国泰航空载运率
表:2014-2016年国泰航空营业收入与净利润预测
图:2009-2013年山东航空营业收入与净利润
表:2013年上半年山东航空机队类型
表:2010-2013年山东航空主要营运指标
表:2014-2016年山东航空营业收入与净利润预测
表:2011-2013年深圳航空营业收入与净利润
表:2010-2013年深圳航空运力指标
表:2010-2013年深圳航空运载量指标
表:2010-2013年深圳航空载运率
图:2002-2013年厦门航空主营业务收入与利润总额
图:2011-2013年厦门航空飞机拥有量
表:2009-2013年厦门航空运载量指标
表:2011-2013年厦门航空载运率
表:2009-2013年四川航空主要财务指标
表:2006-2013年四川航空旅客运输量
表:2007-2013年华夏航空旅客运输量
表:新中联航介绍
表:2006-2013年中国联合航空旅客运输量
表:春秋航空介绍
表:2006-2013年春秋航空旅客运输量
表:2006-2013年奥凯航空旅客运输量
表:2007-2013年吉祥航空旅客运输量
表:2013年1-11月中国主要机场三大指标对比
图:2008-2013年北京首都机场营业收入与净利润
表:2009-2013年北京首都国际机场收入构成
图:2012-2013年北京首都国际机场经营费用
图:2007-2013年北京首都国际机场旅客吞吐量
图:2013年上半年北京首都国际机场旅客吞吐量构成
图:2007-2013年北京首都国际机场货邮吞吐量
图:2013年上半年北京首都国际机场货邮吞吐量构成
图:2007-2013年北京首都国际机场飞机起降架次
表:2014-2016年北京首都国际机场营业收入与净利润预测
图:2009-2013年上海机场营业收入与净利润
表:2013年上半年上海机场运营成本构成
表:2009-2013年上海浦东国际机场三大指标
表:2009-2013年上海虹桥机场三大指标
表:2014-2016年上海机场营业收入与净利润预测
图:2008-2013年白云机场营业收入与净利润
表:2013年上半年白云机场运营成本构成
图:2008-2013年白云机场旅客吞吐量
图:2008-2013年白云机场货邮吞吐量
图:2008-2013年白云机场飞机起降架次
表:2014-2016年白云机场营业收入与净利润预测
图:2009-2013年深圳机场营业收入与净利润
图:2007-2013年深圳机场旅客吞吐量
图:2007-2013年深圳机场货邮吞吐量
图:2007-2013年深圳机场飞机起降架次
表:2014-2016年深圳机场营业收入与净利润预测
表:2007-2013年成都双流国际机场三大生产指标
表:2007-2013年昆明长水国际机场三大生产指标
表:2007-2013年西安咸阳国际机场三大生产指标
表:2007-2013年重庆江北国际机场三大生产指标
表:2007-2013年杭州萧山国际机场三大生产指标
表:2007-2013年厦门高崎国际机场三大生产指标
表:2007-2013年长沙黄花国际机场三大生产指标
表:2007-2013年南京禄口机场三大生产指标
表:2007-2013年武汉天河国际机场三大生产指标
表:天津滨海机场基本介绍
表:天津滨海国际机场规划指标
图:1980-2013年天津滨海国际机场旅客吞吐量
图:1980-2013年天津滨海国际机场货邮吞吐量
表:2007-2013年天津滨海国际机场飞机起降架次
表:天津滨海国际机场T2航站楼数字概览
表:天津机场二期扩建工程施工进度
表:盐城南洋机场基本介绍
图:2000-2013年盐城南洋机场旅客吞吐量
图:2000-2013年盐城南洋机场货邮吞吐量
图:2007-2012年盐城南洋机场飞机起降架次
表:2013年前三季度中国主要航空公司净利润排名
表:2013年中国千万级机场级别分布
图:2013-2016年中国民航行业企业营业收入与利润总额预测
表:中国主要低成本航空公司
图:2013-2016年中国民航运输总周转量预测
图:2013-2016年中国民航旅客运输量预测
图:2013-2016年中国民航货邮运输量预测
Fluctuation of China Civil Aviation RPK around GDP Growth Rate, 1991-2013
Laws, Regulations, and Policies on China Air Transport Industry, 2011-2013
Key Measures on Air Transport Industry in China, 2013
Per Capita Number of Flights in China (by Air Routes), 1990-2010
Number of China Civil Aviation Aircrafts, 2004-2013
Number of Transport Aircrafts in China Civil Aviation Industry, 2006-2013
Number of China Civil Aviation Airlines, 2004-2012
Number of China Civil Aviation Airlines in China by Airline, 2004-2012
RTK and YOY Growth of China Civil Aviation, 2006-2013
RTK Structure of China Civil Aviation (by Air Routes), 2006-2013
China Civil Aviation Passenger Turnover and YoY Growth, 2007-2013
China Civil Aviation Cargo & Mail Turnover and YoY Growth, 2007-2013
China Civil Aviation Passenger Traffic and YoY Growth, 2007-2013
Passenger Traffic Breakdown in China Civil Aviation Industry (by Air Routes), 2010-2013
China Civil Aviation Cargo & Mail Traffic and YoY Growth, 2006-2013
Cargo & Mail Traffic Breakdown in China Civil Aviation Industry (by Air Routes), 2010-2013
Daily Utilization Rate of Aircrafts of China Civil Aviation Industry, 2009-2013
Passenger Load Factor and Load Factor of China Civil Aviation Industry, 2010-2013
Development Course of China Low-Cost Aviation Industry, 2003-2013
Market Shares of Low-Cost Aviation Industry (by Passenger Traffic) in China and USA, 1980-2012
Foreign Low-Cost Airlines’ Layout in China
Development Difficulties of Low-Cost Airlines in China
Business Revenue and Change of Express Delivery Companies above Designated Size in China, 2007-2013
Number of All Cargo Carriers in China (as of 2013)
Number of Navigable Cities and Airports in China, 2007-2012
Regional Distribution of Transport Airports in China, 2012
Passenger Throughput and YoY Growth of China Transport Airports, 2007-2013
Passenger Throughput of China Transport Airports (by Air Routes), 2010-2012
Distribution of Navigable Airports with Scheduled Flights in China, 2012
China Passenger Throughput Distribution (by Region), 2012
China Transport Airport Cargo & Mail Throughput and YoY Growth, 2007-2013
Cargo & Mail Throughput of China Transport Airports (by Air Routes), 2010-2012
China Cargo & Mail Throughput Distribution (by Region), 2012
Aircraft Movements and YoY Growth of Airports in China, 2007-2012
Revenue and Total Profits of China Civil Aviation Enterprises, 2009-2012
Structures of Revenue and Total Profits of China Civil Aviation, 2012
Revenue and Total Profits of Airlines in China Civil Aviation Industry, 2009-2012
Revenue and Total Profits of Airports in China Civil Aviation Industry, 2009-2012
Airlines Ranking (by Net Income) in China, Q1-Q3, 2013
Airlines Ranking (by Revenue) in China, Q1-Q3, 2013
Key Chinese Airlines’ Development in International and Regional Air Routes in 2013
Airlines Ranking (by Number of Aircrafts) in China, H1 2013
Key Chinese Airlines’ Three Capacity Indices, 2013
Key Chinese Airlines’ Three Traffic Indices, 2013
Key Chinese Airlines’ Passenger Load Factors, Jan.-Nov., 2013
Revenue and Net Income of China Southern Airlines, 2009-2013
Revenue Breakdown of China Southern Airlines, 2009-2013
Operating Expenses Breakdown of China Southern Airlines, 2012-2013
Total Number of Aircrafts of China Southern Airlines, 2009-2013
Three Capacity Indices of China Southern Airlines, 2008-2013
Traffic Indices of China Southern Airlines, 2008-2012
Passenger Traffic Structure of China Southern Airlines, 2010-2013
Load Factor of China Southern Airlines, 2008-2013
Strategic Route of China Southern Airlines
Revenue and Net Income of China Southern Airlines, 2014E-2016E
Revenue and Net Income of China Eastern Airlines, 2009-2013
Total Number of Aircrafts of China Eastern Airlines, 2009-2013
Capacity Indices of China Eastern Airlines, 2008-2013
Traffic Indices of China Eastern Airlines, 2008-2013
Passenger Traffic Structure of China Eastern Airlines, 2010-2013
Load Factor of China Eastern Airlines, 2008-2013
Revenue and Net Income of China Eastern Airlines, 2014E-2016E
Revenue and Net Income of Air China, 2009-2013
Operating Cost Structure of Air China, 2012
Total Number of Aircrafts of Air China, 2009-2013
Key Capacity Indices of Air China, 2008-2013
Traffic Indices of Air China, 2008-2013
Passenger Traffic Structure of Air China, 2009-2013
Load Factor of Air China, 2008-2013
Revenue and Net Income of Air China, 2014E-2016E
Revenue and Net Income of Hainan Airlines, 2009-2013
Total Number of Aircrafts of Hainan Airlines, 2009-2013
Capacity Indices of Hainan Airlines, 2009-2013
Capacity Indices of Hainan Airlines, 2013
Key Traffic Indices of Hainan Airlines, 2009-2013
Load Factor of Hainan Airlines, 2008-2013
Load Factor of Hainan Airlines, Jan.-Nov., 2013
Progress of Hainan Airlines in Western Market, 2013
Revenue and Net Income of Hainan Airlines, 2014E-2016E
Flight Lines of Cathay Pacific Airways
Revenue and Net Income of Cathay Pacific Airways, 2009-2013
Operating Expenses of Cathay Pacific Airways, 2012-2013
Total Number of Aircrafts of Cathay Pacific Airways, 2009-2013
Capacity Indices of Cathay Pacific Airways, 2007-2013
Traffic Indices of Cathay Pacific Airways, 2007-2013
RPK Structure of Cathay Pacific Airways (by Regions), Jan.-Nov., 2013
Load Factor of Cathay Pacific Airways, 2007-2013
Revenue and Net Income of Cathay Pacific Airways, 2014E-2016E
Revenue and Net Income of Shandong Airlines, 2009-2013
Fleet Type of Shandong Airlines, H1 2013
Key Traffic Indices of Shandong Airlines, 2010-2013
Revenue and Net Income of Shandong Airlines, 2014E-2016E
Revenue and Net Income of Shenzhen Airlines, 2011-2013
Capacity Indices of Shenzhen Airlines, 2010-2013
Traffic Indices of Shenzhen Airlines, 2010-2013
Load Factor of Shenzhen Airlines, 2010-2013
Operating Revenue and Profits of Xiamen Airlines, 2002-2013
Total Number of Aircrafts of Xiamen Airlines, 2011-2013
Key Traffic Indices of Xiamen Airlines, 2009-2013
Load Factor of Xiamen Airlines, 2011-2013
Financials of Sichuan Airlines, 2009-2013
Passenger Traffic of Sichuan Airlines, 2006-2013
Passenger Traffic of China Express, 2007-2013
Introduction of China United Airlines
Passenger Traffic of China United Airlines, 2006-2013
Introduction of Spring Airlines
Passenger Traffic of Spring Airlines, 2006-2013
Passenger Traffic of Okay Airways, 2006-2013
Passenger Traffic of Juneyao Airlines, 2007-2013
Three Production Indicators of Major Chinese Airports, Jan.-Nov., 2013
Revenue and Net Income of Beijing Capital International Airport, 2008-2013
Revenue Breakdown of Beijing Capital International Airport, 2009-2013
Operating Costs of Beijing Capital International Airport, 2012-2013
Passenger Throughput of Beijing Capital International Airport, 2007-2013
Passenger Throughput Structure of Beijing Capital International Airport, H1 2013
Cargo & Mail Throughput of Beijing Capital International Airport, 2007-2013
Cargo & Mail Throughput Structure of Beijing Capital International Airport, H1 2013
Aircraft Movements of Beijing Capital International Airport, 2007-2013
Revenue and Net Income of Beijing Capital International Airport, 2014-2016
Revenue and Net Income of Shanghai Airport, 2009-2013
Operating Cost Structure of Shanghai Airport, H1 2013
Three Production Indicators of Shanghai Airport, 2009-2013
Three Production Indicators of Shanghai Hongqiao Airport, 2009-2013
Revenue and Net Income of Shanghai Airport, 2014E-2016E
Revenue and Net Income of Baiyun Airport, 2008-2013
Operating Costs Structure of Baiyun Airport, H1 2013
Passenger Throughput of Baiyun Airport, 2008-2013
Cargo & Mail Throughput of Baiyun Airport, 2008-2013
Aircraft Movements of Baiyun Airport, 2008-2013
Revenue and Net Income of Baiyun Airport, 2014E-2016E
Revenue and Net Income of Shenzhen Airport, 2009-2013
Passenger Throughput of Shenzhen Airport, 2007-2013
Cargo & Mail Throughput of Shenzhen Airport, 2007-2013
Aircraft Movements of Shenzhen Airport, 2007-2013
Revenue and Net Income of Shenzhen Airport, 2014E-2016E
Three Major Production Indicators of Chengdu Shuangliu International Airport, 2007-2013
Three Major Production Indicators of Kunming Wujiaba International Airport, 2007-2013
Three Major Production Indicators of Xi’an Xianyang International Airport, 2007-2013
Three Major Production Indicators of Chongqing Jiangbei International Airport, 2007-2013
Three Major Production Indicators of Hangzhou Xiaoshan International Airport, 2007-2013
Three Major Production Indicators of Xiamen Gaoqi International Airport, 2007-2013
Three Major Production Indicators of Changsha Huanghua International Airport, 2007-2013
Three Major Production Indicators of Nanjing Lukou International Airport, 2007-2013
Three Major Production Indicators of Wuhan Tianhe International Airport, 2007-2013
Passenger Throughput of Tianjin Binhai International Airport, 1980-2013
Cargo & Mail Throughput of Tianjin Binhai International Airport, 1980-2013
Aircraft Movements of Tianjin Binhai International Airport, 2007-2013
Overview of Yancheng Nanyang Airport
Passenger Throughput of Yancheng Nanyang Airport, 2000-2013
Cargo & Mail Throughput of Yancheng Nanyang Airport, 2000-2013
Aircraft Movements of Yancheng Nanyang Airport, 2007-2012
Airlines Ranking (by Net Income) in China, Q1-Q3, 2013
Airports (>10 million Passenger Traffic) Distribution in China, 2013
Revenue and Total Profits of Enterprises in Chinese Civil Aviation Industry, 2013E-2016E
Introduction of Major Chinese Low-Cost Airlines
RTK of China Civil Aviation, 2013E-201E
China Civil Aviation Passenger Traffic, 2013E-2016E
China Civil Aviation Cargo & Mail Traffic, 2006-2013
如果这份报告不能满足您的要求,我们还可以为您定制报告,请 留言说明您的详细需求。
|