|
|
|
报告导航:研究报告—
制造业—能源矿产
|
|
2013-2015年中国无功补偿装置行业研究报告 |
 |
字数:2.5万 |
页数:83 |
图表数:93 |
|
中文电子版:7500元 |
中文纸版:3750元 |
中文(电子+纸)版:8000元 |
|
英文电子版:2400美元 |
英文纸版:2500美元 |
英文(电子+纸)版:2700美元 |
|
编号:LT013
|
发布日期:2014-02 |
附件:下载 |
 |
|
|
在中国工业和居民用电需求的不断提高、电网投资的加大以及国家加快发展无功功率补偿产业等促进因素的影响下,中国无功补偿装置行业市场规模不断扩大。 目前应用最广泛的依然是传统型无功补偿装置和静止无功补偿装置(SVC)为主,其中传统型无功补偿装置以高压并联电容器组无功补偿装置为主,占据约80%的市场份额。目前SVG只在风电、钢铁冶金、轨道交通领域应用较多,在电网领域还处于试点应用阶段,没有形成市场规模,但是市场潜力很大。 随着SVC和SVG技术日益成熟和完善,产品成本不断下降,应用领域将不断扩大,市场占有率也将增加,并联电容器无功补偿装置市场份额将会下降。 目前条件下,SVC产品的实际需求容量约占无功补偿装置总量的30%。未来十多年内,由于装机容量增加,电力系统对无功补偿产品年均需求量在9,600 万千乏以上,对SVC 产品的年均需求量将保持在2,880 万千乏以上。 水清木华研究中心《2013-2015年中国无功补偿装置行业研究报告》着重研究了以下内容:- 中国无功补偿装置行业运行环境,包括政策环境、国际标杆企业分析等;
- 中国无功补偿装置行业发展分析,包括发展现状,细分产品市场供需及竞争格局分析等;
- 中国无功补偿装置行业上下游行业发展分析,包括电抗器、电容器、聚丙烯膜、钢铁、有色冶金、风电等;
- 中国无功补偿装置行业11家企业(包括欣泰电气、思源电气、恒顺电气、中国西电、荣信股份、南车电气时代、三得普华、杭州银湖、辽宁立德、保定四方三伊、泰开电力)经营情况及无功补偿装置业务分析等。
Stimulated by the continuous improvement of China’s industrial and
residential electricity demand, increasing investment in power grid, and
accelerated development of reactive power compensation industry, the
market scale of reactive power compensation device industry has been
expanding. Currently the most widely used reactive power
compensation devices are still the traditional reactive power
compensation devices and Static Var Compensator (SVC). The traditional
reactive power compensation devices mainly include high voltage shunt
capacitor bank reactive power compensation devices, which occupy about
80% of the market. Static Var Generator (SVG) only applies more in wind
power, steel, metallurgy, rail transit, and its application in power
grid is still in the pilot stage, having not formed a large market scale
but with great market potential. With the gradual maturity and
improvement of SVC and SVG technology, the product costs have been
dropping, the application field will continue to expand, and the market
share will also increase, while the market share of shunt capacitor
reactive power compensation device will decline. Under current
conditions, the actual demand for SVC products occupies about 30% of the
total demand for reactive power compensation devices. In the next
decade, due to the increase in installed capacity, the annual average
demand for reactive power compensation products from the power industry
will exceed 96 million kvar, and the annual average demand for SVC
products will remain over 28.8 million kvar. China Reactive Power Compensation Device Industry Report, 2013-2015 of ResearchInChina focuses on the followings: Operating
environment of China reactive power compensation device industry,
including policy environment, analysis of international benchmark
enterprises, etc.;
Development of China reactive power compensation device industry,
including development status, market supply and demand as well as
competitive landscape by product, etc.;
Development of upstream and downstream sectors of China reactive power
compensation device industry, including reactor, capacitor,
polypropylene film, steel, non-ferrous metallurgy, wind power, etc.;
Operation and reactive power compensation device business of 11
Enterprises in China reactive power compensation device industry
(including DanDong XinTai Electric Co., Ltd., Sieyuan Electric Co.,
Ltd., Qingdao Evercontaining Electric Co., Ltd., China XD Electric Co.,
Ltd., Rongxin Power Electronic Co., Ltd., Zhuzhou CSR Times Electric
Co., Ltd., Beijing Sound Power Technology Co., Ltd., Hangzhou Yinhu
Electrical Equipment Co., Ltd., Liaoning Leader Power Electronic Co.,
Ltd., Baoding Sifang Sanyi Electric Co., Ltd, Shandong Tai Kai Power
Electronic Co., Ltd.)
第一章 无功补偿装置行业概述
1.1 定义及分类
1.2 产业链分析
第二章 中国无功补偿装置行业运行环境分析
2.1政策环境
2.2 国际标杆企业分析
2.2.1 ABB
2.2.2 ALSTOM
2.2.3 AMSC
2.3 行业进入壁垒
2.3.1 技术和人才
2.3.2 资金
2.3.3 资质
2.2.4 营销网络
第三章 中国无功补偿装置行业发展分析
3.1 发展现状
3.2 市场供需
3.2.1 高压并联电容器组无功补偿装置
3.2.2 静止无功补偿装置(SVC)
3.2.3 静止无功发生器(SVG)
3.3 竞争格局
3.3.1 高压并联电容器组无功补偿装置
3.3.2 静止无功补偿装置(SVC )
3.3.3 静止无功发生器(SVG)
第四章 中国无功补偿装置上下游行业发展分析
4.1 上游行业
4.1.1 电抗器
4.1.2 电容器
4.1.3 聚丙烯膜
4.2 下游行业
4.2.1 有色金属
4.2.2 钢铁
4.2.3 风电
第五章 中国食品安全检测行业主要企业
5.1 欣泰电气
5.1.1 企业简介
5.1.2 经营情况
5.1.3 营收构成
5.1.4 无功补偿装置业务
5.1.5 毛利率
5.1.6 预测与展望
5.2 思源电气
5.2.1 企业简介
5.2.2 经营情况
5.2.3 营收构成
5.2.4 无功补偿装置业务
5.2.5 毛利率
5.2.6 预测与展望
5.3 恒顺电气
5.3.1 企业简介
5.3.2 经营情况
5.3.3 营收构成
5.3.4 无功补偿装置业务
5.3.5 毛利率
5.3.6 预测与展望
5.4 中国西电
5.4.1 企业简介
5.4.2 运营情况
5.4.3 营收构成
5.4.4 无功补偿装置业务
5.4.5 毛利率
5.4.6 预测与展望
5.5 荣信股份
5.5.1 公司简介
5.5.2 运营情况
5.5.3 营收构成
5.5.4 无功补偿装置业务
5.5.5 毛利率
5.5.7 预测与展望
5.6 南车时代电气
5.6.1 公司简介
5.6.2 运营情况
5.6.3 营收构成
5.6.4 无功补偿装置业务
5.6.5 毛利率
5.6.7 预测与展望
5.7 三得普华
5.7.1 企业简介
5.7.2 经营情况
5.7.3 无功补偿装置业务
5.8 杭州银湖
5.8.1 企业简介
5.8.2 无功补偿装置业务
5.9 辽宁立德
5.9.1 企业简介
5.9.2 无功补偿装置业务
5.10 保定四方三伊
5.10.1 公司简介
5.10.2 无功补偿装置业务
5.11 泰开电力
5.11.1 公司简介
5.11.2 无功补偿装置业务
1. Overview of Reactive Power Compensation Device Industry
1.1 Definition and Classification
1.2 Industry Chain
2. Operating Environment of China Reactive Power Compensation Device Industry
2.1 Policy Environment
2.2 International Benchmarking Enterprises
2.2.1 ABB
2.2.2 ALSTOM
2.2.3 AMSC
2.3 Entry Barriers
2.3.1 Technology and Talent
2.3.2 Capital
2.3.3 Qualification
2.3.4 Marketing Network
3. Development of China Reactive Power Compensation Device Industry
3.1 Current Development
3.2 Market Supply and Demand
3.2.1 High Voltage Shunt Capacitor Bank Reactive Power Compensation Device
3.2.2 Static Var Compensator (SVC)
3.2.3 Static Var Generator (SVG)
3.3 Competitive Landscape
3.3.1 High Voltage Shunt Capacitor Bank Reactive Power Compensation Device
3.3.2 Static Var Compensator (SVC)
3.3.3 Static Var Generator (SVG)
4. Upstream and Downstream Industries of Reactive Power Compensation Device in China
4.1 Upstream Industries
4.1.1 Reactor
4.1.2 Capacitor
4.1.3 Polypropylene Film
4.2 Downstream Industries
4.2.1 Non-Ferrous Metals
4.2.2 Steel
4.2.3 Wind Power
5. Major Companies
5.1 DanDong XinTai Electric Co., Ltd.
5.1.1 Profile
5.1.2 Operation
5.1.3 Revenue Structure
5.1.4 Reactive Power Compensation Device Business
5.1.5 Gross Margin
5.1.6 Forecast and Outlook
5.2 Sieyuan Electric Co., Ltd.
5.2.1 Profile
5.2.2 Operation
5.2.3 Revenue Structure
5.2.4 Reactive Power Compensation Device Business
5.2.5 Gross Margin
5.2.6 Forecast and Outlook
5.3 Qingdao Evercontaining Electric Co., Ltd.
5.3.1 Profile
5.3.2 Operation
5.3.3 Revenue Structure
5.3.4 Reactive Power Compensation Device Business
5.3.5 Gross Margin
5.3.6 Forecast and Outlook
5.4 China XD Electric Co., Ltd.
5.4.1 Profile
5.4.2 Operation
5.4.3 Revenue Structure
5.4.4 Reactive Power Compensation Device Business
5.4.5 Gross Margin
5.4.6 Forecast and Outlook
5.5 Rongxin Power Electronic Co., Ltd.
5.5.1 Profile
5.5.2 Operation
5.5.3 Revenue Structure
5.5.4 Reactive Power Compensation Device Business
5.5.5 Gross Margin
5.5.6 Forecast and Outlook
5.6 Zhuzhou CSR Times Electric Co., Ltd.
5.6.1 Profile
5.6.2 Operation
5.6.3 Revenue Structure
5.6.4 Reactive Power Compensation Device Business
5.6.5 Gross Margin
5.6.6 Forecast and Outlook
5.7 Beijing Sound Power Technology Co., Ltd.
5.7.1 Profile
5.7.2 Operation
5.7.3 Reactive Power Compensation Device Business
5.8 Hangzhou Yinhu Electrical Equipment Co., Ltd.
5.8.1 Profile
5.8.2 Reactive Power Compensation Device Business
5.9 Liaoning Leader Power Electronic Co., Ltd.
5.9.1 Profile
5.9.2 Reactive Power Compensation Device Business
5.10 Baoding Sifang Sanyi Electric Co., Ltd.
5.10.1 Profile
5.10.2 Reactive Power Compensation Device Business
5.11 Shandong Tai Kai Power Electronic Co., Ltd.
5.11.1 Profile
5.11.2 Reactive Power Compensation Device Business
图:无功补偿装置分类
图:无功补偿装置行业产业链
表:2006-2013年无功补偿装置相关重要法规条例
图:2009-2013年ABB营业收入及净利润
图:2010-2012年ABB低压产品营业收入
图:ABB在华业务分布图
图:2010-2013财年ALSTOM营业收入及净利润
图:2009-2013年ALSTOM(分业务)订单额
图:2009-2013年AMSC营业收入及净利润
图:2011-2013年AMSC(分业务)营业收入
图:AMSC全球服务中心分布
图:2013年中国无功补偿装置(分类型)市场份额
表:2013年中国高压并联电容器组无功补偿装置主要市场容量来源
图:2011-2015年中国高压并联电容器组无功补偿装置市场容量
图:2011-2015年中国高压并联电容器组无功补偿装置平均售价
表:“十二五”期间SVC产品各应用领域需求
图:“十二五”期间中国SVC各应用领域市场份额
图:2011-2015年中国不同类型SVC市场份额
图:2013年中国SVG各应用领域市场份额
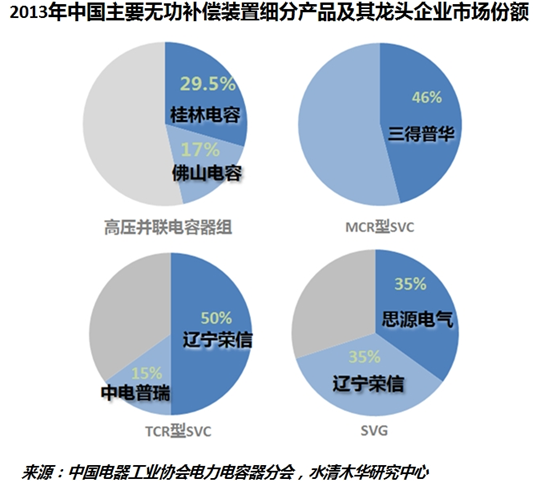
图:2013年中国并联电容器组成套装置市场结构
图:2013年中国电力系统内SVC市场份额
图:2013年中国电力系统外SVC市场份额
表:2013年中国电网用SVC价格
图:2013年中国SVC钢铁、冶金市场份额
图:2013年中国SVC风电市场份额
图:2013年中国SVC煤炭市场份额
图:2013年中国SVC铁路电气化市场份额
表:中国MCR型SVC市场主要企业及其目标市场
图:2013年中国MCR型SVC市场结构
图:2013年中国TCR型SVC市场结构
图:2013年中国SVG市场结构
图:2013-2016年中国电抗器产能及产量
图:2013-2016年中国电抗器供应量及需求量
图:2007-2013年中国电容器市场规模
图:2008-2012年中国电容器产销量
图:2008-2012年中国聚丙烯膜产销量
图:2006-2013年中国现货铜价格
图:2009-2013年上海物贸现货镍价格
图:2005-2013年中国海绵钛(≥99.6%)价格
图:2005-2013年中国海绵锆(≥99%)价格
图:2012-2013年中国钢价走势
图:2007-2013年中国粗钢产量产量及同比增速
表:2009-2013年中国钢铁(分产品)均价
图:2009-2013年中国钢价(分地区)指数均值
图:2003-2013年中国钢铁行业毛利率及利润率
图:2000-2013年中国风电装机容量
图:2011-2013年中国风电招标量
图:2008-2012年中国风电机组数量
图:2009-2013年欣泰电气营业收入及净利润
图:2009-2013年欣泰电气(分产品)营收占比
表:2009-2013年欣泰电气(分地区)营收占比
表:欣泰电气磁控并联电抗器募投项目产能设计
图:2009-2013年欣泰电气毛利率
图:2009-2013年欣泰电气(分产品)毛利率
图:2012-2015年欣泰电气营业收入及净利润
图:2012-2015年欣泰电气(分产品)营业收入
图:2009-2013年思源电气营业收入及净利润
图:2009-2013年思源电气(分产品)营收占比
图:2009-2013年思源电气(分地区)营收占比
图:2011-2013年思源电气国家电网集中采购中标情况
图:思源电气2012/2013年下半年中标量占比对比
图:2009-2013年思源电气毛利率
图:2009-2013年思源电气(分产品)毛利率
图:2012-2015年思源电气营业收入及净利润
表:2012-2015年思源电气(分产品)营业收入
图:2009-2013年恒顺电气营业收入及净利润
图:2009-2013年恒顺电气(分产品)营收占比
图:2009-2013年恒顺电气(分地区)营收占比
图:2009-2013年恒顺电气电能质量优化销售收入及毛利
图:2011-2012年恒顺电气输配电及控制设备产销量
图:2009-2013年恒顺电气毛利率
图:2012-2015年恒顺电气营业收入及净利润
图:2009-2013年中国西电营业收入及净利润
图:2009-2013年中国西电(分产品)营收占比
图:2009-2013年中国西电(分地区)营业收入
图:2009-2013年中国西电毛利率
图:2009-2013年中国西电(分产品)毛利率
图:2012-2015年中国西电营业收入及净利润
图:2009-2013年荣信股份营业收入及净利润
图:2009-2013年荣信股份(分产品)营收占比
图:2009-2013年荣信股份(分地区)营收占比
图:2009-2013年荣信股份毛利率
表:2009-2013年荣信股份(分产品)毛利率
图:2012-2015年荣信股份营业收入及净利润
图:2009-2013年南车时代电气营业收入及净利润
图:2008-2013年南车时代电气(分产品)营收占比
图:2008-2013年南车时代电气毛利率
图:2012-2015年华宇软件营业收入及净利润
图:2006-2013年三得普华合同额
表:保定四方三伊主要无功补偿装置产品
表:泰开电力主要无功补偿装置产品
表:2010-2020年中国无功补偿装置需求总量与SVC 产品的需求量
图:2009-2013年中国无功补偿装置行业上市企业毛利率对比
Classification of Reactive Power Compensation Devices
Reactive Power Compensation Device Industry Chain
Key Laws and Regulations about Reactive Power Compensation Device, 2006-2013
Revenue and Net Income of ABB, 2009-2013
ABB’s Revenue from Low-voltage Products, 2010-2012
ABB’s Business Distribution in China
Revenue and Net Income of ALSTOM, FY2010-FY2013
Order Value of ALSTOM (by Business), 2009-2013
Revenue and Net Income of AMSC, 2009-2013
Revenue of AMSC (by Business), 2011-2013
AMSC’s Service Centers Worldwide
China Reactive Power Compensation Device Market Structure (by Type), 2013
Market Capacity of China High Voltage Shunt Capacitor Bank Reactive Power Compensation Device by Source, 2013
Market Capacity of China High Voltage Shunt Capacitor Bank Reactive Power Compensation Device, 2011-2015E
Average Selling Price of China High Voltage Shunt Capacitor Bank Reactive Power Compensation Device, 2011-2015E
Demand for SVC Products during “Twelfth Five-Year” Period by Application
China SVC Market Structure during “Twelfth Five-Year” Period by Application
China SVC Market Structure by Type, 2011-2015E
China SVG Market Structure by Application, 2013
China Shunt Capacitor Bank Equipment Market Structure, 2013
Market Share of SVC for Power Industry in China, 2013
Market Share of SVC for Industries beyond Power Industry in China, 2013
Price of SVC for Power Grid in China, 2013
Market Share of SVC for Steel, Metallurgy in China, 2013
Market Share of SVC for Wind Power in China, 2013
Market Share of SVC for Coal in China, 2013
Market Share of SVC for Railway Electrification in China, 2013
Major Enterprises in China’s MCR-type SVC Market and Their Target Markets
China MCR-type SVC Market Structure, 2013
China TCR-type SVC Market Structure, 2013
China SVG Market Structure, 2013
China Reactor Capacity and Output, 2013-2016E
China Reactor Supply and Demand, 2013-2016E
China Capacitor Market Scale, 2007-2013
China Capacitor Output and Sales Volume, 2008-2012
China Polypropylene Film Output and Sales Volume, 2008-2012
China Spot Copper Price, 2006-2013
Spot Nickel Price of Shanghai Material Trading, 2009-2013
China Titanium Sponge (≥ 99.6%) Price, 2005-2013
China Zirconium Sponge (≥ 99%) Price, 2005-2013
China Steel Price Trend, 2012-2013
China Crude Steel Output and YoY Growth, 2007-2013
China Steel Price (by Product), 2009-2013
China Steel Price (by Region), 2009-2013
Gross Margin and Profit Margin of China Steel Industry, 2003-2013
China Wind Power Installed Capacity, 2000-2013
China Wind Power Bidding Volume, 2011-2013
China’s Wind Turbine Quantity, 2008-2012
Revenue and Net Income of DanDong XinTai Electric, 2009-2013
Revenue Structure of DanDong XinTai Electric (by Product), 2009-2013
Revenue Structure of DanDong XinTai Electric (by Region), 2009-2013
Design Capacity of Magnetic Shunt Reactor Project of DanDong XinTai Electric
Gross Margin of DanDong XinTai Electric, 2009-2013
Gross Margin of DanDong XinTai Electric (by Product), 2009-2013
Revenue and Net Income of DanDong XinTai Electric, 2012-2015E
Revenue of DanDong XinTai Electric (by Product), 2012-2015E
Revenue and Net Income of Sieyuan Electric, 2009-2013
Revenue Structure of Sieyuan Electric (by Product), 2009-2013
Revenue Structure of Sieyuan Electric (by Region), 2009-2013
State Grid Centralized Procurement Bid Winning Results of Sieyuan Electric, 2011-2013
Bid Winning Results of Sieyuan Electric, 2012/2013 H2
Gross Margin of Sieyuan Electric, 2009-2013
Gross Margin of Sieyuan Electric (by Product), 2009-2013
Revenue and Net Income of Sieyuan Electric, 2012-2015E
Revenue of Sieyuan Electric (by Product), 2012-2015E
Revenue and Net Income of Qingdao Evercontaining Electric, 2009-2013
Revenue Structure of Qingdao Evercontaining Electric (by Product), 2009-2013
Revenue Structure of Qingdao Evercontaining Electric (by Region), 2009-2013
Revenue and Gross Profit of Qingdao Evercontaining Electric from Power Quality Optimization, 2009-2013
Output and Sales Volume of Power Transmission and Distribution Equipment of Qingdao Evercontaining Electric, 2011-2012
Gross Margin of Qingdao Evercontaining Electric, 2009-2013
Revenue and Net Income of Qingdao Evercontaining Electric, 2012-2015E
Revenue and Net Income of China XD Electric, 2009-2013
Revenue Structure of China XD Electric (by Product), 2009-2013
Revenue of China XD Electric (by Region), 2009-2013
Gross Margin of China XD Electric, 2009-2013
Gross Margin of China XD Electric (by Product), 2009-2013
Revenue and Net Income of China XD Electric, 2012-2015E
Revenue and Net Income of Rongxin Power Electronic, 2009-2013
Revenue Structure of Rongxin Power Electronic (by Product), 2009-2013
Revenue Structure of Rongxin Power Electronic (by Region), 2009-2013
Gross Margin of Rongxin Power Electronic, 2009-2013
Gross Margin of Rongxin Power Electronic (by Product), 2009-2013
Revenue and Net Income of Rongxin Power Electronic, 2012-2015E
Revenue and Net Income of Zhuzhou CSR Times Electric, 2009-2013
Revenue Structure of Zhuzhou CSR Times Electric (by Product), 2008-2013
Gross Margin of Zhuzhou CSR Times Electric, 2008-2013
Revenue and Net Income of Beijing Thunisoft, 2012-2015E
Contract Value of Beijing Sound Power Technology, 2006-2013
Main Reactive Power Compensation Device Products of Baoding Sifang Sanyi Electric
Main Reactive Power Compensation Device Products of Shandong Tai Kai Power Electronic
China’s Total Demand for Reactive Power Compensation Devices and Demand for SVC Products, 2010-2020E
Gross Margin of Listed Companies in China’s Reactive Power Compensation Device Industry, 2009-2013
如果这份报告不能满足您的要求,我们还可以为您定制报告,请 留言说明您的详细需求。
|