|
|
|
报告导航:研究报告—
制造业—材料
|
|
2013-2016年全球及中国铝热传输复合材料研究报告 |
 |
字数:3.4万 |
页数:93 |
图表数:81 |
|
中文电子版:8000元 |
中文纸版:4000元 |
中文(电子+纸)版:8500元 |
|
英文电子版:2200美元 |
英文纸版:2300美元 |
英文(电子+纸)版:2500美元 |
|
编号:CYH023
|
发布日期:2014-03 |
附件:下载 |
 |
|
|
铝热传输复合材料主要应用于汽车、家电、机械设备的热交换系统及火力电站空冷系统等领域。2013年,全球铝热复合材料产量约达134万吨,同比增长7.2%。在全球经济市场低迷及中国经济增速变缓的影响下,机械设备、电站、家电等下游需求均出现不同程度萎缩,致使铝热传输材料需求增速变缓,2013全年铝热传输材料需求增幅仅为6.9%。
中国是全球铝热传输材料主要消费国。2013年,中国汽车市场快速增长有效带动铝热传输复合材料需求量增长,全年中国铝热传输材料需求量约为51.06万吨。受中国汽车轻量化及机械装备及家电等行业需求拉动,预计未来几年,中国铝热传输复合材料需求量将继续保持增长。
水清木华研究中心《2013-2016年全球及中国铝热传输复合材料行业研究报告》着重研究了以下内容:
.全球铝热传输复合材料行业市场供需分析、市场竞争、发展预测等;
.中国铝热传输复合材料供需分析、市场竞争格局、发展预测等;
.中国铝热传输复合材料下游主要行业需求现状;
.全球7家铝热传输复合材料生产企业经营情况及在华发展;
.中国14家铝热传输复合材料生产企业的经营状况及发展情况等。

目前,全球范围内铝热传输复合材料市场主要被欧美、日本、加拿大等国企业控制,随着中国汽车工业快速发展,各国企业纷纷在中国投资建厂。而中国本土企业受技术限制等原因起步较晚,目前仅有银邦股份、华峰集团、东北轻合金等少数几家企业发展较为稳定。
Sapa集团是全球最大的铝型材生产商,同时也是全球主要的汽车用铝热传输复合材料(板、带、箔)生产企业。受Sapa业务合并及收购的影响,公司单独成立全资子公司格朗吉斯公司(Gränges),专门负责集团的铝热传输复合材料业务。由此,Sapa中国子公司更名为格朗吉斯铝热传输(上海)有限公司,仍然以生产汽车用热传输材料为主,近年来该子公司不断拓展产能,截至2013年,该公司产能达12万吨/年。
银邦股份是中国本土铝热传输复合材料领军企业之一,近年来公司持续加大科研投入,成功开发出铝合金复合材料、铝钢复合带材等高附加值产品。2012年公司A股成功上市,募集资金新建层压式金属复合材料扩建项目,预计于2016年完全投产,届时公司铝热传输材料总产能有望达到20万吨/年。
华峰日轻铝业股份有限公司主要生产热传输领域内各状态的铝合金板带箔材料。该公司是2012年11月日本轻金属株式会社认购华峰铝业增发的股份后,由华峰铝业股份有限公司更名而来,当前公司在建二期年产5万吨民用空调铝合金复合材料项目,投产后公司铝热传输材料总产能将达到13万吨/年。
Aluminum heat transfer composites are mainly used in heat exchange systems of automobiles, home appliances, machinery and equipment as well as air-cooling systems of thermal power stations. In 2013, the global output of aluminum heat transfer composites reached about 1.34 million tons, representing a year-on-year increase of 7.2%. Affected by the global economic downturn and China's economic slowdown, the downstream demand for machinery, equipment, power stations, home appliances, etc. declined, resulting in the sluggish demand for aluminum heat transfer composites, with a growth rate of only 6.9% in 2013.
China is a major consumer of aluminum heat transfer composites in the world. In 2013, the rapid growth of Chinese automobile market effectively boosted the demand for aluminum heat transfer composites to 510,600 tons. Driven by Chinese automotive light-weighting, machinery and equipment, household appliances and other industries, China’s demand for aluminum heat transfer composites will continue to grow in the coming years.
The report focuses on the following aspects:
.Market supply and demand, market competition and development trends of the global aluminum heat transfer composites industry;
.Supply and demand, market competition patterns and development trends of China aluminum heat transfer composites industry;
.Demand of major Chinese aluminum heat transfer composites downstream industries;
.Operation and Chinese business of 7 global aluminum heat transfer composites manufacturing enterprises;
.Operation and development of 14 Chinese aluminum heat transfer composites manufacturing enterprises.
Capacity of Major Aluminum Heat Transfer Composites Enterprises in China, 2013
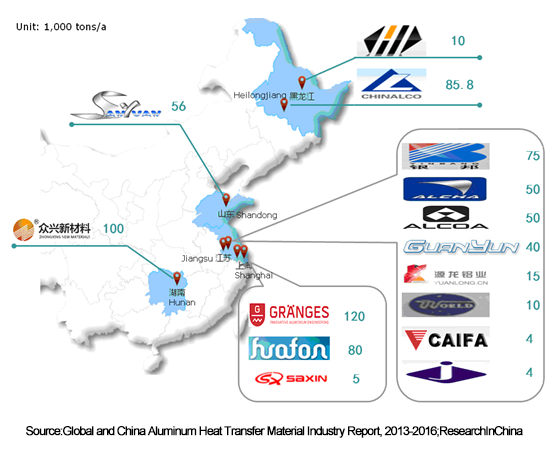
Note: The capacity of foreign-funded companies refers to the capacity of their subsidiaries in Chinese provinces.
On a global basis, the aluminum heat transfer composites market is monopolized by several large corporations from the United States, Europe, Japan, Canada, etc. With the rapid development of China automobile industry, foreign enterprises have set up factories in China. Subject to technical constraints and other reasons, Chinese companies started late, only a few companies such as Yinbang, Huafon Group and Northeast Light Alloy develop stably.
Sapa is the world's largest producer of aluminum profiles, and also one of major manufacturers of automotive aluminum heat transfer composites (sheets, strips, foils) in the world. Impacted by business mergers and acquisitions, Sapa established a wholly owned subsidiary - Gr?nges specializing in aluminum heat transfer composites. Thus, Sapa’s Chinese subsidiary was renamed Gr?nges Aluminum Heat Transfer (Shanghai) Co., Ltd. which is still engaged in the production of automotive heat transfer materials. In recent years, the subsidiary has continuously expanded its capacity; as of 2013, its capacity hit 120 kt/a.
Yinbang, as one of Chinese leaders in aluminum heat transfer composites, has increased investment in scientific research in recent years and successfully developed high-value-added products such as aluminum alloy composites and aluminum steel composite strips. In 2012, the company went public on A-share stock exchange and used the raised funds to build a laminated metal composites expansion project which is expected to go into operation in 2016 when the company’s total aluminum heat transfer composites capacity may hit 200 kt/a.
Huafon Nikkei Aluminium Corporation produces aluminum alloy heat transfer composites (sheets, strips, foils). The company was formerly know as Huafon Aluminum Co., Ltd whose shares were bought by Nippon Light Metal Co., Ltd. in November 2012. Currently, the company is constructing Civil Air Conditioner Aluminum Alloy Composites Project Phase II with annual capacity of 50,000 tons; upon completion, the company’s aluminum heat transfer composites capacity will attain 130 kt/a.
第一章 铝热传输复合材料概述
1.1 定义
1.2 分类
1.3 产业链
1.4 生产工艺
第二章 全球铝热传输复合材料行业发展现状
2.1 概述
2.2 供给
2.3 需求
第三章 中国铝热传输复合材料行业发展现状
3.1 政策
3.2 产业环境
3.3 供给
3.4 需求
第四章 中国铝热传输复合材料主要下游行业需求
4.1 汽车行业
4.2 机械装备
4.3 电站空冷系统行业
4.4 家用电器行业
第五章 全球铝热传输复合材料生产企业
5.1 ALCOA
5.1.1 企业简介
5.1.2 经营情况
5.1.3 营收构成
5.1.4 研发
5.1.5 铝轧制业务
5.1.6 在华业务
5.1.7 美铝昆山铝业有限公司
5.2 Wickeder
5.2.1 企业简介
5.2.2 铝热传输复合材料业务
5.2.3 在华业务
5.3 Gränges(Sapa Heat Transfer)
5.3.1 企业简介
5.3.2 经营情况
5.3.3 营收构成
5.3.4 在华业务
5.3.5 格朗吉斯铝热传输(上海)有限公司(原萨帕铝热传输(上海)有限公司)
5.4 Norsk Hydro
5.4.1 企业简介
5.4.2 经营情况
5.4.3 营收构成
5.4.4 研发
5.4.5 铝热传输复合材料业务(Rolled products)
5.4.6 在华业务
5.5 Aleris
5.5.1 企业简介
5.5.2 经营情况
5.5.3 营收构成
5.5.4 铝热传输材料业务
5.5.5 在华业务
5.6 Novelis
5.6.1 企业简介
5.6.2 经营情况
5.6.3 铝热传输材料业务
5.7 Kobe Steel
5.7.1 企业简介
5.7.2 经营情况
5.7.3 铝热传输材料业务
5.7.4 在华业务
第六章 中国铝热传输复合材料生产企业
6.1 银邦股份(300337)
6.1.1 企业简介
6.1.2 经营情况
6.1.3 营收构成
6.1.4 毛利率
6.1.5 产销量
6.1.6 客户与供应商
6.1.7 研发与投资
6.1.8 业务拓展
6.1.9 发展前景
6.2 江苏常铝铝业股份有限公司(002160)
6.2.1 企业简介
6.2.2 经营情况
6.2.3 营收构成
6.2.4 投资
6.2.5 发展前景
6.3 东北轻合金有限责任公司
6.3.1 企业简介
6.3.2 经营情况
6.3.3 营收构成
6.3.4 毛利率
6.3.5 铝合金产销量
6.3.6 投资
6.3.7 发展前景
6.4 西南铝业(集团)有限责任公司
6.4.1 企业简介
6.4.2 经营情况
6.5 华峰日轻铝业股份有限公司
6.5.1 企业简介
6.5.2 经营情况
6.6 南通华特铝热传输材料有限公司
6.6.1 企业简介
6.6.2 产能
6.6.3 研发
6.7 潍坊三源铝业有限公司
6.8 南通恒秀铝热传输材料有限公司
6.8.1 企业简介
6.8.2 经营情况
6.9 哈尔滨松润
6.9.1 企业简介
6.9.2 铝热传输材料业务
6.10 长沙众兴新材料科技有限公司
6.11 其他企业
6.11.1 上海萨新汽车热传输材料有限公司
6.11.2 无锡冠云铝业有限公司
6.11.3 江苏财发铝业股份有限公司
6.11.4 镇江源龙铝业有限责任公司
第七章 结论与预测
7.1 结论
7.2 预测
7.2.1 全球市场
7.2.2 中国市场
1 Overview of Aluminum Heat Transfer Composites
1.1 Definition
1.2 Classification
1.3 Industry Chain
1.4 Production Process
2 Status Quo of Global Aluminum Heat Transfer Composites Industry
2.1 Overview
2.2 Supply
2.3 Demand
3 Status Quo of China Aluminum Heat Transfer Composites Industry
3.1 Policy
3.2 Industrial Environment
3.3 Supply
3.4 Demand
4 Demand of Major Chinese Aluminum Heat Transfer Composites Downstream Industries
4.1 Automotive Industry
4.2 Machinery and Equipment
4.3 Air Cooling Systems of Power Plants
4.4 Household Appliances
5 Global Aluminum Heat Transfer Composites Manufacturers
5.1 ALCOA
5.1.1 Profile
5.1.2 Operation
5.1.3 Revenue Structure
5.1.4 R & D
5.1.5 Aluminum Rolling Business
5.1.6 Business in China
5.1.7 Alcoa Kunshan Aluminum Products Co., Ltd
5.2 Wickeder
5.2.1 Profile
5.2.2 Aluminum Heat Transfer Composites Business
5.2.3 Business in China
5.3 Gr?nges (Sapa Heat Transfer)
5.3.1 Profile
5.3.2 Operation
5.3.3 Revenue Structure
5.3.4 Business in China
5.3.5 Gr?nges Aluminum Heat Transfer (Shanghai) Co., Ltd. (formerly known as Sapa Heat Transfer (Shanghai) Ltd)
5.4 Norsk Hydro
5.4.1 Profile
5.4.2 Operation
5.4.3 Revenue Structure
5.4.4 R & D
5.4.5 Aluminum Heat Transfer Composites Business (Rolled Products)
5.4.6 Business in China
5.5 Aleris
5.5.1 Profile
5.5.2 Operation
5.5.3 Revenue Structure
5.5.4 Aluminum Heat Transfer Composites Business
5.5.5 Business in China
5.6 Novelis
5.6.1 Profile
5.6.2 Operation
5.6.3 Aluminum Heat Transfer Composites Business
5.7 Kobe Steel
5.7.1 Profile
5.7.2 Operation
5.7.3 Aluminum Heat Transfer Composites Business
5.7.4 Business in China
6 Chinese Aluminum Heat Transfer Composites Manufacturers
6.1 Yinbang (300337)
6.1.1 Profile
6.1.2 Operation
6.1.3 Revenue Structure
6.1.4 Gross Margin
6.1.5 Output and Sales Volume
6.1.6 Customers and Suppliers
6.1.7 R & D and Investment
6.1.8 Business Expansion
6.1.9 Development Prospect
6.2 Jiangsu ALCHA Aluminium Co., Ltd (002160)
6.2.1 Profile
6.2.2 Operation
6.2.3 Revenue Structure
6.2.4 Investment
6.2.5 Development Prospect
6.3 Northeast Light Alloy Co., Ltd
6.3.1 Profile
6.3.2 Operation
6.3.3 Revenue Structure
6.3.4 Gross Margin
6.3.5 Aluminum Alloy Output and Sales Volume
6.3.6 Investment
6.3.7 Development Prospect
6.4 Southwest Aluminum (Group) Co., Ltd
6.4.1 Profile
6.4.2 Operation
6.5 Huafon Nikkei Aluminium Corporation
6.5.1 Profile
6.5.2 Operation
6.6 Nantong Hua Te Aluminum Heat Transfer Co., Ltd
6.6.1 Profile
6.6.2 Capacity
6.6.3 R & D
6.7 Weifang Sanyuan Aluminum Co., Ltd
6.8 Nantong Hengxiu Aluminum Heat Transfer Material Co., Ltd
6.8.1 Profile
6.8.2 Operation
6.9 Harbin Song Run Metal Products Co., Ltd
6.9.1 Profile
6.9.2 Aluminum Heat Transfer Composites Business
6.10 Changsha Zhongxing Aluminum Co., Ltd
6.11 Others
6.11.1 Shanghai Saxin Aluminum Co., Ltd
6.11.2 Wuxi Guanyun Aluminum Co., Ltd
6.11.3 Xuzhou Caifa Aluminum Heat Transfer Co., Ltd
6.11.4 Zhenjiang Yuanlong Aluminum Co., Ltd
7 Conclusion and Forecast
7.1 Conclusion
7.2 Forecast
7.2.1 Global Market
7.2.2 Chinese Market
图:铝合金复合材料结构及性能
图:铝基多金属复合材料结构
图:铝基层状金属复合材料产业链
图:2006-2013年全球铝热传输材料产量
图:2006-2013年全球铝热传输复合材料需求量
表:2006-2013年中国铝热传输复合材料相关政策
图:2006-2013年中国铝材产量及同比增长
图:2006-2013年中国铝合金产量及同比增长
表:2006-2013年中国铝热传输复合材料产能
表:2006-2013年中国铝热传输复合材料(分产品)产能
图:2006-2013年中国铝热传输复合材料需求量
表:2006-2013年中国铝热传输材料(分产品)需求量
表:汽车各零部件铝热传输复合材料用量
表:2000-2016年中国汽车产量及保有量及铝合金复合材料需求量
表:2010-2016年中国各种机械装备产量及铝热传输复合材料需求量
表:2011-2016年中国火电站新增装机容量及铝传热复合材料需求量
表:2011-2016年中国空调产量及铝热传输复合材料需求量
图:2007-2013年Alcoa收入与净利润
图:2012年Alcoa(分业务)收入占比
表:2010-2012年Alcoa(分国家/地区)收入及占比
图:2007-2013年Alcoa研发投入及占比
表:2009-2012年Alcoa Global Rolled Products销售收入及利润
表:2013年Alcoa铝轧制产品(分国家/地区)子公司及产品
图:2009-2012年Alcoa在中国实现收入及占比
表:2013年wickeder集团EMS部门主要产品及应用领域
图:1896-2013年Gränges发展历史
图:Gränges公司地区分布
图:2010-2013年Sapa Heat Transfer业务营业收入与营业利润
表:2010-2012年Gränges(原Sapa Heat Transfer业务)(分地区)营业收入占比
图:1999-2013年萨帕铝热热交换器材料产能
图:2009-2013年Norsk Hydro营业收入与净利润
表:2011-2013年Norsk Hydro(分业务)营业收入及占比
图:2010-2012年Norsk Hydro(分国家/地区)营业收入及占比
表:2013年Norsk hydro公司Rolling mills(分工厂)产品及产能
表:2013年Norsk Hydro铝热传输业务单元分布
图:2010-2013年Norsk Hydro公司 Rolled Products业务营业收入及利润
图:2011-2013年Norsk Hydro公司Rolled Products(分下游)销量
表:2011-2012年Norsk Hydro公司Rolled Products(分工厂)外部市场产量
图:2008-2013年Aleris营业收入与净利润
表:2010-2013年Aleris(分业务)营业收入及占比
表:2010-2012年Aleris(分地区)营业收入及占比
表:2010-2013年Aleris铝轧制品(分业务)营业收入
表:2010-2013年Aleris铝轧制品(分业务)销量
表:2013年Aleris在华子公司
图:2008-2014财年Novelis营业收入及净利润
图:2013年Kobe Steel公司业务结构
图:2007-2014财年神户钢铁销售额及净利润
图:2008-2013年银邦股份营业收入与净利润
图:2008-2013年银邦股份(分业务)营业收入
图:2008-2013年银邦股份(分地区)营业收入
图:2008-2013年银邦股份(分业务)毛利率
表:2009-2011年银邦股份(分产品)产销量及产销率
表:2013H1银邦股份前五名客户名称及营业收入贡献
图:2009-2013年银邦股份研发投入及占比
表:2013年银邦股份主要在建项目
表:2012-2016年银邦股份营业收入与净利润
图:2008-2013年常铝股份营业收入与净利润
图:2008-2013年常铝股份(分产品)营业收入
图:2008-2013年常铝股份(分地区)营业收入
表:2012-2016年常铝股份营业收入与净利润
表:2013年东北轻合金有限责任公司下属企业及其业务
图:2010-2013年东北轻合金营业收入与净利润
表:截止2013年9月底东北轻合金生产线
表:2010-2013年东北轻合金公司铝合金(分产品)营业收入及占比
图:2010-2013年东北轻合金(分产品)毛利率
表:2010-2013年东北轻合金铝合金(分产品)产能及产量
表:2010-2013年东北轻合金公司铝合金(分产品)销量、产销率及价格
表:截止2013年9月底东北轻合金在建项目
表:2012-2016年东北轻合金营业收入与净利润
图:2012-2013年西南铝业营业收入与净利润
图:西南铝业(分产品)营业收入占比
表:2010-2013年华峰铝业铝热传输材料重点项目
图:2005-2013年南通华特铝热传输复合材料产能
表:2011-2013年三源铝业重点项目
表:南通恒秀主要客户
表:2013年冠云铝业主要产品及应用领域
表:2013年龙源铝业各种铝热传输产品产能
表:2012-2013年全球及中国主要铝热传输复合材料生产企业营业收入
表:2013年中国铝热传输材料主要生产企业产能
表:2011-2016年全球铝热传输复合材料产量及需求量
表:2011-2016年中国铝热传输复合材料产能及需求量
Structure and Properties of Aluminum Alloy Composites
Structure of Aluminum-based Multi-metal Composites
Industrial Chain of Aluminum-based Layered Metal Composites
Global Output of Aluminum Heat Transfer Composites, 2006-2013
Global Demand for Aluminum Heat Transfer Composites, 2006-2013
Policies Related with Aluminum Heat Transfer Composites in China, 2006-2013
China's Aluminum Output and YoY Growth, 2006-2013
China's Aluminum Alloy Output and YoY Growth, 2006-2013
China's Aluminum Heat Transfer Composites Capacity, 2006-2013
China’s Aluminum Heat Transfer Composites Capacity (by Product), 2006-2013
China’s Demand for Aluminum Heat Transfer Composites, 2006-2013
China’s Demand for Aluminum Heat Transfer Composites (by Product), 2006-2013
Quantity of Aluminum Heat Transfer Composites Used in Automotive Parts
Automobile Output & Ownership and Demand for Aluminum Alloy Composites in China, 2000-2016E
Machinery & Equipment Output and Demand for Aluminum Heat Transfer Composites in China, 2010-2016E
Newly Installed Capacity and Demand of Chinese Thermal Power Stations for Aluminum Heat Transfer Composites, 2011-2016E
China’s Air-conditioner Output and Demand for Aluminum Heat Transfer Composites, 2011-2016E
Alcoa’s Revenue and Net Income, 2007-2013
Alcoa’s Revenue Percentage (by Business), 2012
Alcoa’s Revenue Breakdown and Percentage (by Country/Region), 2010-2012
Alcoa’s R&D Costs and % of Total Revenue, 2007-2013
Alcoa’s Revenue and Profit of Rolled Products, 2009-2012
Alcoa’s Aluminum Rolled Product Subsidiaries and Products (by Country/Region), 2013
Alcoa’s Revenue in China and % of Total Revenue, 2009-2012
Main Products and Applications of Wickeder's EMS Division, 2013
Development History of Gr?nges, 1896-2013
Geographical Distribution of Gr?nges
Sapa’s Heat Transfer Revenue and Operating Income, 2010-2013
Revenue Percentage of Gr?nges (formerly Sapa’s Heat Transfer Business) (by Region), 2010-2012
Sapa’s Heat Exchanger Material Capacity, 1999-2013
Revenue and Net Income of Norsk Hydro, 2009-2013
Revenue Breakdown and Percentage of Norsk Hydro (by Business), 2011-2013
Revenue Breakdown and Percentage of Norsk Hydro (by Country/Region), 2010-2012
Rolling Products and Capacity of Norsk Hydro (by Factory), 2013
Distribution of Aluminum Heat Transfer Business of Norsk Hydro, 2013
Rolled Product Revenue and Profit of Norsk Hydro, 2010-2013
Rolled Product Sales Volume (by Downstream) of Norsk Hydro, 2011-2013
Rolled Product Output of Norsk Hydro for External Markets (by Factory), 2011-2012
Aleris’ Revenue and Net Income, 2008-2013
Aleris’ Revenue Breakdown and Percentage (by Business), 2010-2013
Aleris’ Revenue Breakdown and Percentage (by Region), 2010-2012
Aleris’ Aluminum Rolled Product Revenue (Business), 2010-2013
Aleris’ Aluminum Rolled Product Sales Volume (by Business), 2010-2013
Aleris’ Subsidiaries in China, 2013
Revenue and Net Income of Novelis, FY2008-FY2014
Business Structure of Kobe Steel, 2013
Sales and Net Income of Kobe Steel, FY2007-FY2014
Yinbang’s Revenue and Net Income, 2008-2013
Yinbang’s Revenue (by Business), 2008-2013
Yinbang’s Revenue (by Region), 2008-2013
Yinbang’s Gross Margin (by Business), 2008-2013
Yinbang’s Output, Sales Volume and Sales/Output Ratio (by Product), 2009-2011
Name List and Revenue Contribution of Yinbang’s Top 5 Clients, 2013H1
Yinbang’s R&D Costs and % of Total Revenue, 2009-2013
Yinbang’s Main Projects under Construction, 2013
Yinbang’s Revenue and Net Income, 2012-2016E
ALCHA’s Revenue and Net Income, 2008-2013
ALCHA’s Revenue (by Product), 2008-2013
ALCHA’s Revenue (by Region), 2008-2013
ALCHA’s Revenue and Net Income, 2012-2016E
Subsidiaries and Their Businesses of Northeast Light Alloy, 2013
Revenue and Net Income of Northeast Light Alloy, 2010-2013
Production Lines of Northeast Light Alloy, as of the end of Sep. 2013
Aluminum Alloy Revenue Breakdown and Percentage of Northeast Light Alloy (by Product), 2010-2013
Gross Margin of Northeast Light Alloy (by Product), 2010-2013
Aluminum Alloy Capacity and Output of Northeast Light Alloy (by Product), 2010-2013
Aluminum Alloy Sales Volume, Sales/Output Ratio and Price of Northeast Light Alloy (by Product), 2010-2013
Projects of Northeast Light Alloy under Construction, as of the end of Sep. 2013
Revenue and Net Income of Northeast Light Alloy, 2012-2016E
Revenue and Net Income of Southwest Aluminum, 2012-2013
Revenue Percentage of Southwest Aluminum (by Product)
Huafon’s Key Aluminum Heat Transfer Composites Projects, 2010-2013
Capacity of Aluminum Heat Transfer Composites of Nantong Hua Te, 2005-2013
Sanyuan’s Key Projects, 2011-2013
Major Clients of Nantong Hengxiu
Major Products and Applications of Guanyun Aluminum, 2013
Capacity of Aluminum Heat Transfer Products of Guanyun Aluminum, 2013
Revenue of Main Global and Chinese Aluminum Heat Transfer Composites Manufacturers, 2012-2013
Capacity of Major Aluminum Heat Transfer Composites Enterprises in China, 2013
Global Aluminum Heat Transfer Composites Output and Demand, 2011-2016E
China’s Aluminum Heat Transfer Composites Capacity and Demand, 2011-2016E
如果这份报告不能满足您的要求,我们还可以为您定制报告,请 留言说明您的详细需求。
|