|
|
|
报告导航:研究报告—
制造业—材料
|
|
2014-2015年全球及中国MO源行业研究报告 |
 |
字数:1.0万 |
页数:71 |
图表数:64 |
|
中文电子版:6500元 |
中文纸版:3250元 |
中文(电子+纸)版:7000元 |
|
英文电子版:1600美元 |
英文纸版:1700美元 |
英文(电子+纸)版:1900美元 |
|
编号:CHW012
|
发布日期:2014-03 |
附件:下载 |
 |
|
|
全球LED行业的MO源需求量已占MO源总需求量90% 以上。新一代太阳能电池、相变存储器、半导体激光器等领域由于尚处于发展初期,还未形成大规模的市场需求。
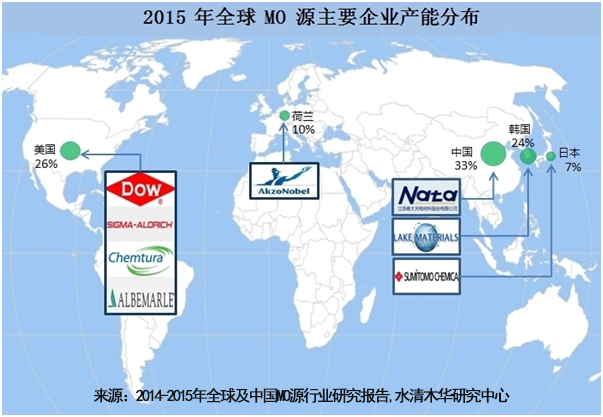
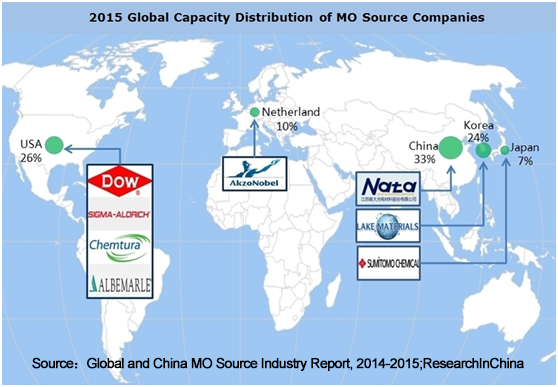
由于早期MO源产品毛利率较高,包括陶氏化学、阿克苏诺贝尔(AKZO Nobel)、赛孚思(SAFC Hitech)和南大光电(NATA)在内的MO源全球四大供应商近三年纷纷扩产,新进企业不断涌现,导致市场竞争日趋激烈,MO源产品价格开始大幅下滑。
MO源的主要下游是LED外延芯片产业,该行业在2013年出现中低端产能过剩,芯片价格持续下跌,导致大部分企业盈利能力不断下降,多数企业处于亏损状态。外延芯片企业的低迷也直接影响到了MO源厂家的盈利。
2014年2月,南大光电发布2013年度业绩快报,公司去年实现营收1.35亿元,同比下降23.81%;归属于上市公司股东的净利润为6035.96万元,同比下降33.08%。
展望2014年,随着LED照明产品的技术进步和价格下跌,LED照明应用需求将快速增长, 2014年MOCVD设备产能利用率将持续回升,带动上游MO源的需求回暖。因此,MO源企业将有望在2014年走出低谷。
中国MO龙头企业南大光电的镓、铟等MO源上游原材料充足,成本较低。因此凭借成本优势,南大光电业绩有望在2014年出现好转。
中国MO龙头企业南大光电的镓、铟等MO源上游原材料充足,成本较低。因此凭借成本优势,南大光电业绩有望在2014年出现好转。
水清木华研究中心《2014-2015年全球及中国MO源行业研究报告》着重研究了以下内容:
. MO源行业发展情况(产业政策、法律法规)分析等;
. MO源行业市场规模、市场结构、供需情况及竞争格局分析等;
. 全球及中国MO源行业上下游产业影响分析等;
. 全球及中国8家MO源行业重点企业经营情况及发展战略分析等。
Global demand for MO source from LED industry has accounted for more than 90% of the aggregate demand for MO source. New-generation solar cell, phase change memory, semiconductor laser and other areas are still in their infancy, and have not yet formed massive market demand.
Because of a higher gross margin of MO source product in the early days, the world’s four major suppliers of MO source involving Dow Chemical, AKZO Nobel, SAFC Hitech and NATA expanded production over the past three years, resulting in the mushrooming of new entrants and increasing fierce market competition, and MO source product prices began to fall sharply.
Downstream of MO source mainly refers to the LED epitaxial chip industry, which in 2013 suffered mid/low-end overcapacity, causing chip price to ceaselessly fall; finally, most companies witnessed a continuous decline in profitability, at a loss. The downturn in epitaxial chip companies also directly affected the profitability of MO source manufacturers.
In February 2014, NATA released a newsletter about its 2013-year performance, according to which the company’s revenue reached RMB135 million in 2013, down 23.81% YoY; and net income attributable to shareholders of the listed company decreased by 33.08% YoY to RMB60.3596 million.
In 2014, along with technological progress and falling prices of LED lighting products, LED lighting application demand will grow rapidly; MOCVD equipment capacity utilization will continue to rise and stimulate recovery in demand for upstream MO source. Therefore, MO source companies are expected to bottom out in 2014.
NATA, the domestic MO leader, has sufficient upstream raw materials of MO source such as gallium and indium with low cost. By virtue of cost advantage, NATA is likely to turn around performance in 2014.
Global and China MO Source Industry Report, 2014-2015 focuses on the followings:
 Development (industrial policies, laws and regulations) of MO source industry; Development (industrial policies, laws and regulations) of MO source industry;
Market size, market structure, supply and demand, competition pattern, etc. of MO source industry;
Influences from upstream and downstream sectors on global and China MO source industry
Operation, development strategy, etc. of eight MO companies at home and abroad.
1第一章MO源行业概述
1.1 MO源简介
1.2分类及应用
1.3产业链
1.4行业特性
1.4.1高集中度
1.4.2高成长性
2全球MO 源行业发展情况
2.1 全球MO源行业发展概况
2.2 供给
2.3 需求
2.3.1 下游需求恢复增长
2.3.2 中上游产能逐渐消化
2.3.3需求量
2.3.4需求结构
2.4市场竞争格局
2.5美国
2.6台湾
2.7韩国
2.8欧洲
2.9日本
3中国MO 源行业发展情况
3.1发展环境
3.1.1政策环境
3.1.2贸易环境
3.1.3技术环境
3.2供应情况
3.2.1 MO源产能
3.2.2产能结构
3.3需求情况
3.4价格走势
4中国MO源上下游行业分析
4.1 MO源上游行业
4.1.1镓
4.1.2铟
4.1.3相关政策及影响
4.2 LED 行业
4.2.1 LED 市场规模
4.2.2 MOCVD及LED芯片市场
4.2.3 LED封装市场
4.2.4 LED 应用市场
4.2.5竞争格局
4.3其他下游行业
4.3.1新型太阳能电池
4.3.2箱变存储器
4.3.3半导体激光器
4.3.4射频集成电路芯片
5全球MO源重点生产企业研究
5.1 陶氏化学 (DOW)
5.1.1公司介绍
5.1.2经营情况
5.1.3销售收入结构
5.1.4 MO 源业务
5.1.5中国区业务发展
5.2赛孚思 (SAFC Hitech)
5.2.1公司介绍
5.2.2经营情况
5.2.3业务结构
5.2.4 MO 源业务
5.3 阿克苏诺贝尔 (AKZO Nobel)
5.3.1公司介绍
5.3.2经营情况
5.3.3销售收入结构
5.3.4 MO 源业务
5.3.5中国区业务发展
5.4 住友化学 (Sumitomo Chemical)
5.4.1公司介绍
5.4.2经营情况
5.4.3 MO源业务
5.4.4中国区业务发展
5.5 Albemarle
5.5.1公司介绍
5.5.2经营情况
5.5.3 MO源业务
5.5.4中国区业务发展
5.6 Chemtura
5.6.1公司介绍
5.6.2经营情况
5.6.3 MO源业务
5.6.4中国区业务发展
5.7 Lake LED Materials
5.7.1公司介绍
5.7.2 MO源业务
5.8 南大光电
5.8.1公司介绍
5.8.2经营情况
5.8.3收入结构
5.8.4毛利率
5.8.5产销情况
5.8.6重点项目
6.总结
6.1 全球MO源市场发展前景
6.2 中国MO源市场发展前景
1 Overview of MO Source Industry
1.1 Introduction
1.2 Classification and Application
1.3 Industry Chain
1.4 Industry Characteristics
1.4.1 High Concentration
1.4.2 High Growth
2 Development of Global MO Source Industry
2.1 Overview
2.2 Supply
2.3 Demand
2.3.1 Downstream Demand Restores Growth
2.3.2 Midstream & Upstream Capacity Gradually Digested
2.3.3 Demand Volume
2.3.4 Demand Structure
2.4 Market Competition Pattern
2.5 USA
2.6 Taiwan
2.7 South Korea
2.8 Europe
2.9 Japan
3 Development of MO Source Industry in China
3.1 Development Environment
3.1.1 Policy Environment
3.1.2 Trade Environment
3.1.3 Technical Environment
3.2 Supply
3.2.1 Production Capacity
3.2.2 Capacity Structure
3.3 Demand
3.4 Price Trend
4 Upstream and Downstream Industries of MO Source in China
4.1 Upstream Sectors
4.1.1 Gallium
4.1.2 Indium
4.1.3 Related Policies and Influence
4.2 LED Industry
4.2.1 LED Market Scale
4.2.2 MOCVD and LED Chip Market
4.2.3 LED Encapsulation Market
4.2.4 LED Application Market
4.2.5 Competition Pattern
4.3 Other Downstream Sectors
4.3.1 New Solar Cell
4.3.2 Phase Change Memory
4.3.3 Semiconductor Laser
4.3.4 RFIC (Radio Frequency Integrated Circuit) Chip
5 Key Enterprises Worldwide
5.1 DOW
5.1.1 Profile
5.1.2 Operation
5.1.3 Revenue Structure
5.1.4 MO Source Business
5.1.5 Business in China
5.2 SAFC Hitech
5.2.1 Profile
5.2.2 Operation
5.2.3 Business Structure
5.2.4 MO Source Business
5.3 AKZO Nobel
5.3.1 Profile
5.3.2 Operation
5.3.3 Revenue Structure
5.3.4 MO Source Business
5.3.5 Business in China
5.4 Sumitomo Chemical
5.4.1 Profile
5.4.2 Operation
5.4.3 MO Source Business
5.4.4 Business in China
5.5 Albemarle
5.5.1 Profile
5.5.2 Operation
5.5.3 MO Source Business
5.5.4 Business in China
5.6 Chemtura
5.6.1 Profile
5.6.2 Operation
5.6.3 MO Source Business
5.6.4 Business in China
5.7 Lake LED Materials
5.7.1 Profile
5.7.2 MO Source Business
5.8 Nata Opto-electronic
5.8.1 Profile
5.8.2 Operation
5.8.3 Revenue Structure
5.8.4 Gross Margin
5.8.5 Production and Marketing
5.8.6 Key Projects
6 Summary
6.1 Global MO Source Market Prospect
6.2 China MO Source Market Prospect
MO源应用领域
MO源产业链
图:2010-2015年全球MO源产量
图:2012-2015年全球LED电视背光总产值
图:2010-2015年全球高亮度LED产品产值及增长率
图:2010-2015年全球新增MOCVD数量及保有量
图:2015年全球新增MOCVD 比例
图:2010-2015年全球MO源需求量
图:2010-2015年全球MO源分行业需求量
表:2012-2013年全球主要MO源供应商发展动态
图:2009-2015年台湾新增MOCVD数量及保有量
图:2009-2015年韩国新增MOCVD数量
表:日本MO源产品生产基地及主要客户
表:2011-2013年中国MO源行业相关政策
图:2010-2015年中国MO源产能
图:2010-2015年中国MO源分产品产能
表:2009-2015年中国新增MOCVD数量及保有量
表:2012-2013年企业兼并案
图:2010-2015年中国地方政府MOCVD采购计划
图:2010-2015年中国MO源需求量
表:2009-2015年中国MO源产品平均价格
图:2004-2014年中国镓价格
表:2009-2015年中国铟产销量
图:2004-2014年中国市场铟(纯度≥99.99%)价格
图:LED 产业链
图:2010-2015年中国LED行业总产值
图:2010-2013年中国MOCVD保有量
图:2010-2013年中国LED外延片产值及增长率
图:2010-2013年中国LED封装行业产值及增长率
图:2013年LED不同应用领域占比
表:中国LED 行业主要生产商及其业务
表:不同类型太阳能电池性能对比
图:2010-2020年中国砷化镓太阳能电池产量
图:2009-2013年陶氏化学销售收入及息税折旧摊销前利润(EBITDA)
图:2013年陶氏化学分业务收入
图:2012年陶氏化学分地区收入
表:陶氏化学电子材料业务生产基地
图:2010-2013年陶氏化学电子及功能性材料业务收入
图:2012年陶氏化学电子材料业务分地区收入
图:2012年陶氏化学电子材料部门分业务收入
图:2009-2013年赛孚思销售收入及净利润
图:2013年赛孚思分业务收入
表:赛孚思MO源生产基地分布
图:2009-2013年阿克苏诺贝尔收入及净利润
图:2013年专用化学品部门分业务收入
表:2012年阿克苏诺贝尔(中国)功能化学产品生产基地分布
图:2009-2013财年住友化学收入及净利润
图:2009-2013财年住友化学分业务收入
表:住友化学分公司及其主要业务
图:2010-2013年Albemarle 收入及净利润
表:2009-2013年Albemarle分业务收入
图:2009-2013年Chemtura销售收入及净利润
图:2013年Chemtura分业务收入
表:Lake LED Materials主要产品
图:2009-2013年南大光电销售收入及净利润
图:2009-2013年南大光电分产品收入
图:2009-2013年南大光电分地区收入
图:2009-2013年南大光电分产品毛利率
表:2010-2015年南大光电销售量及产品单价
表:2011-2013年南大光电主要项目
表:2010-2015年南大光电产能及全球市场份额
表:2010-2015年全球MO源产量及需求量
表:2010-2015年中国MO源产量及需求量
图:2010-2015年中国LED 芯片总产值
Application of MO Source
Industrial Chain of MO Source
Output of MO Source Worldwide, 2010-2015E
Global TV LED Backlight Output Value, 2012-2015E
Output Value and Growth Rate of Global HB LED Products, 2010-2015E
Number of Newly Added MOCVD Machines and Ownership Worldwide, 2010-2015E
Share of Newly Added MOCVD Machines Worldwide, 2015E
Global MO Source Demand, 2010-2015E
Global MO Source Demand by Industry, 2010-2015E
Developments of Major MO Source Suppliers Worldwide, 2012-2013
Number of Newly Added MOCVD Machines and Ownership in Taiwan, 2009-2015E
Number of Newly Added MOCVD Machines in South Korea, 2009-2012
Production Bases and Major Customers of MO Source in Japan
Policies about MO Source Industry in China, 2011-2013
Production Capacity of MO Source in China, 2010-2015E
Production Capacity of MO Source in China by Product, 2010-2015E
Number of Newly Added MOCVD Machines and Ownership in China, 2009-2015E
Mergers and Acquisitions of Companies, 2012-2013
MOCVD Purchase Plan of China's Local Governments, 2010-2015E
Demand for MO Source in China, 2010-2015E
Average Price of MO Source Products in China, 2009-2015E
Price of Gallium in China, 2004-2014
Output and Sales Volume of Indium in China, 2009-2015 E
Market Price of Indium (Purity ≥99.99%) in China, 2004-2014
LED Industry Chain
Total Output Value of LED Industry in China, 2010-2015E
Ownership of MOCVD Machines in China, 2010-2013
Output Value and Growth Rate of LED Epitaxial Wafer in China, 2010-2013
Output Value and Growth Rate of LED Encapsulation Industry in China, 2010-2013
Proportions of LED Applications, 2013
Businesses of Key LED Manufacturers in China
Performance Comparison of Different Types of Solar Cells
Output of GaAs Solar Cell in China, 2010-2020E
Sales and EBITDA of Dow,2009-2013
Revenue Breakdown of Dow by Business, 2013
Revenue Breakdown of Dow by Region, 2012
Production Bases of Dow Electronic Materials
Revenue of Electronic & Functional Materials of Dow, 2010-2013
Revenue Breakdown of Dow Electronic Materials by Region, 2012
Revenue Breakdown of Dow Electronic Materials by Business, 2012
Sales and Net income of SAFC Hitech, 2009-2013
Revenue Breakdown of SAFC Hitech by Business, 2013
MO Source Production Bases of SAFC Hitech
Revenue and Net Income of AKZO Nobel, 2009-2013
Revenue Breakdown of Speciality Chemicals by Business, 2013
Production Bases of Functional Chemical Products of AKZO Nobel in China
Revenue and Net Income of Sumitomo Chemical, FY2009- FY2013
Revenue Breakdown of Sumitomo Chemical by Business, FY2009-FY2013
Branch Companies of Sumitomo Chemical and Their Primary Businesses
Revenue and Net Income of Albemarle, 2010-2013
Revenue Breakdown of Albemarle by Business, 2009-2013
Sales and Net Income of Chemtura, 2009-2013
Revenue Breakdown of Chemtura by Business, 2013
Main Products of Lake LED Materials
Sales and Net Income of Nata, 2009-2013
Revenue Breakdown of Nata by Product, 2009-2013
Revenue Breakdown of Nata by Region, 2009-2013
Gross Margin of Nata by Product, 2009-2013
Sales Volume and Unit Price of Nata, 2010-2015E
Key Projects of Nata, 2011-2013
Production Capacity and Global Market Share of Nata, 2010-2015E
Global MO Source Production and Demand, 2010-2015E
China MO Source Production and Demand, 2010-2015E
Total Output Value of LED Chip in China, 2010-2015E
如果这份报告不能满足您的要求,我们还可以为您定制报告,请 留言说明您的详细需求。
|