|
|
|
报告导航:研究报告—
TMT产业—电子半导体
|
|
2013-2014年全球及中国电子合约制造(EMS & ODM)行业研究报告 |
 |
字数:1.8万 |
页数:115 |
图表数:147 |
|
中文电子版:8000元 |
中文纸版:4000元 |
中文(电子+纸)版:8500元 |
|
英文电子版:2200美元 |
英文纸版:2400美元 |
英文(电子+纸)版:2500美元 |
|
编号:ZYW0167
|
发布日期:2014-03 |
附件:下载 |
 |
|
|
《2013-2014年全球及中国电子合约制造(EMS & ODM)行业研究报告》主要研究了以下内容:
1、EMS(电子制造服务)产业概况
2、电子合约制造业下游市场分析
3、电子合约制造产业分析
4、26家电子合约制造企业研究
电子合约制造服务是指为品牌商提供除品牌销售以外的服务,包括产品开发设计、原材料采购、生产制造、装配及售后服务等一个或多个环节服务。电子合约制造服务模式根据服务范围的不同可划分为EMS 和ODM,目前两者界限已经很难确定。很多ODM企业也参与EMS业务,而EMS企业也不再与设计无关,因此将两者统称为电子合约制造业。
电子合约制造业降低产品成本,因为电子合约制造厂家的产能利用率更高,更擅长控制成本,可以加快出货速度。电子产业产品生命周期短,所以出货速度必须快,电子合约制造厂家产能大,全球物流做得好,可以快速推向市场。电子合约制造还可以提高库存管理水平和采购效率,少占用流动资金和库存场地,降低采购成本,降低资本开支,减少企业财务成本。
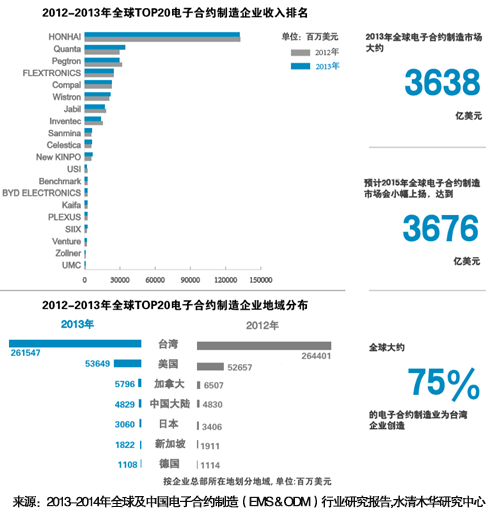
2013年电子合约制造市场大约3638亿美元,比2012年微跌0.3%,主要原因是笔记本电脑出货量大幅度衰退。预计2014年笔记本电脑出货量继续衰退,而全球经济复苏乏力,预计2014年全球电子合约制造市场下滑幅度加大到2%,到2015年才会回升1.5%,达到3676亿美元。
电子合约制造市场主要是电信和网络设备、通讯终端(手机)、电脑(包括Desktop PC、笔记本电脑、平板电脑)和电脑周边产品(包括HDD、显示器、打印机等)、消费类电子(电视、游戏机)、工业电子、汽车电子、医疗和国防电子。
未来5年最有成长潜力的电子合约制造市场还是手机市场。小米的成功为电子合约制造服务做了最佳宣传,小米专注市场炒作与品牌推广,将制造部分完全交给合约制造厂家。小米取得了巨大成功,这刺激了众多的手机企业改走小米模式,为电子合约制造厂家打开广阔空间。而三星和LG未来也有可能将少量制造业务外包给电子合约制造厂家,预计通讯终端的电子合约制造市场规模从2013年的308亿美元增长到2017年的352亿美元,全球电子合约制造产业大约有300-350家企业,行业集中度非常高,前8大企业占据了大约81%的市场份额,这些大企业抢占了大客户。因此中等规模的企业很难有成长空间。
按照企业总部所在地,台湾是全球电子产业心脏,全球大约75%的电子合约制造业为台湾企业,按收入排名依次是鸿海、广达、和硕、仁宝、纬创、英业达、新金宝、环隆电气(日月光)。
Global and China EMS and ODM Industry Report 2013-2014 studies the following aspects:
1, Overview of EMS (Electronic Manufacturing Services) industry
2, EMS and ODM downstream market
3, EMS and ODM industry
4, 26 EMS and ODM companies
EMS and ODM services refer to the services for brand vendors except brand marketing, including product development and design, raw material procurement, manufacturing, assembly and after-sales services. There comes EMS and ODM according to the scope of service, but the boundary between EMS and ODM is difficult to determine. Many ODM companies are engaged in EMS business, and EMS companies are also involved in design, so the EMS and ODM industry arises.
Thanks to high capacity utilization, EMS and ODM vendors are adept at controlling costs, which can speed up the shipment. Electronic products have a short lifespan, so the shipment must be done fast. The huge capacity and sound global logistics enable EMS and ODM vendors to launch products quickly. Besides, they can improve the efficiency of inventory management and procurement to take up less floating capital and space, reduce procurement costs, cut down capital expenditures and abate financial costs.
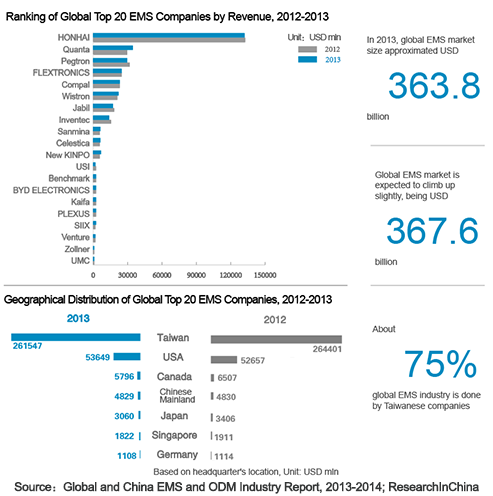
The EMS and ODM market valued about USD363.8 billion in 2013, representing a slight decrease of 0.3% over 2012, mainly due to a significant decline in the laptop shipment which is expected to drop further amid the sluggish global economic recovery in 2014. The global EMS and ODM market will fall by 2% in 2014 and rebound 1.5% to USD367.6 billion in 2015.
The EMS and ODM market covers telecommunications and network equipment, communications terminals (mobile phone), computers (including desktop PC, laptop, Tablet PC), computer peripherals (including HDD, display, printer, etc.), consumer electronics (TV sets, game consoles) , industrial electronics, automotive electronics, medical and defense electronics.
In the upcoming five years, the mobile phone market will embody the hugest growth potentials in the EMS and ODM industry. The success of Xiaomi that focuses on marketing hype and brand promotion while entirely outsources manufacturing to its contract vendors propels EMS and ODM services. Xiaomi’s remarkable achievement stimulates a large number of mobile phone companies to follow suit, which opens a wide space for EMS and ODM vendors. Samsung and LG may commission EMS and ODM vendors to conduct manufacturing partly. The EMS and ODM market size of communication terminals is expected to jump from USD30.8 billion in 2013 to USD35.2 billion in 2017.
In the global EMS and ODM industry, there are about 300-350 companies with high industrial concentration. Top eight enterprises occupy about 81% market share and seize large customers. Accordingly, medium-sized enterprises are hard to see growth.
By corporate headquarters, Taiwan acts as the core of the global electronics industry. In the world, about 75% of EMS and ODM vendors are Taiwanese companies represented by Hon Hai, Quanta, Pegatron, Compal, Wistron, Inventec, New Kinpo and Universal Scientific Industrial (ASE) successively by revenue ranking.
Global Top 20 EMS and ODM Vendors by Ranking, 2012-2013
第一章、EMS与ODM(电子合约制造)简介
1.1、EMS与ODM(电子合约制造)定义
1.2、EMS产业背景
第二章、电子合约制造下游市场
2.1、电子合约制造市场规模
2.2、PC市场
2.2.1、台式机市场
2.2.2、笔记本电脑市场
2.2.3、平板电脑市场
2.3、网络与电信设备
2.3.1、电信设备厂家近况
2.3.2、4G通信
2.3.3、RRH
2.3.4、中国4G电信设备市场
2.3.5、数据中心市场
2.3.6、交换机市场
2.3.7、DSL市场
2.4、手机市场
2.4.1、全球手机市场规模
2.4.2、智能手机市场与产业
2.4.3、中国手机市场与产业概况
第三章、EMS与ODM(电子合约制造)产业
3.1、全球EMS与ODM(电子合约制造)产业概况
3.2、电子合约制造业排名
3.3、中小电子合约制造企业一览
第四章、EMS与ODM(电子合约制造)企业研究
4.1、鸿海
4.2、比亚迪电子
4.3、Flextronics
4.4、Jabil
4.5、广达Quanta Computer
4.6、仁宝Compal
4.7、纬创Wistron
4.8、英业达Inventec
4.9、和硕Pegatron
4.10、Celestica
4.11、泰金宝
4.12、Benchmark
4.13、Sanmina
4.14、环隆电气
4.14.1、环旭电子
4.15、SIIX
4.16、Plexus
4.17、深圳长城开发科技
4.18、Venture
4.19、Zollner
4.20、UMC
4.21、SUMITRONICS
4.22、精成科技
4.23、伟易达集团
4.24、3CEMS
4.25、卓翼科技
4.26、柏能集团
1 Introduction to EMS and ODM
1.1 Definition
1.2 Background
2 EMS and ODM Downstream Market
2.1 EMS and ODM Market Size
2.2 PC Market
2.2.1 Desktop PC Market
2.2.2 Laptop Market
2.2.3 Tablet PC Market
2.3 Network and Telecommunications Equipment
2.3.1 Recent Developments of Telecom Equipment Vendors
2.3.2 4G Communications
2.3.3 RRH
2.3.4 Chinese 4G Telecommunications Equipment Market
2.3.5 Data Center Market
2.3.6 Switch Market
2.3.7 DSL Market
2.4 Mobile Phone Market
2.4.1 Global Mobile Phone Market Size
2.4.2 Smartphone Market and Industry
2.4.3 Overview of Chinese Mobile Phone Market and Industry
3 EMS and ODM Industry
3.1 Overview
3.2 Ranking
3.3 SMEs
4 EMS and ODM Vendors
4.1 Hon Hai
4.2 BYD Electronic
4.3 Flextronics
4.4 Jabil
4.5 Quanta
4.6 Compal
4.7 Wistron
4.8 Inventec
4.9 Pegatron
4.10 Celestica
4.11 Cal-Comp
4.12 Benchmark
4.13 Sanmina
4.14 Universal Scientific Industrial (USI)
4.14.1 Universal Scientific Industrial (Shanghai)
4.15 SIIX
4.16 Plexus
4.17 Shenzhen Kaifa Technology Co., Ltd.
4.18 Venture
4.19 Zollner
4.20 UMC
4.21 SUMITRONICS
4.22 GBM
4.23 VTech
4.24 3CEMS
4.25 Shenzhen Zowee Technology
4.26 PC Partner Group
EMS与ODM(电子合约制造)流程
2011-2017年电子合约制造市场规模
2013、2017年电子合约制造市场下游分布
2008-2015年Desktop PC出货量
Worldwide Device Shipments by Operating System (Thousands of Units)
Top 5 Vendors, Worldwide PC Shipments, Fourth Quarter 2013
Top 5 Vendors, Worldwide PC Shipments 2013
2008-2015年笔记本电脑出货量
2010-2013年全球主要笔记本电脑ODM厂家出货量
2010-2016年全球平板电脑出货量
2013年平板电脑主要品牌市场占有率
2012、2013年全球平板电脑制造厂家产量
全球5大电信厂家2007-2013年3季度收入增幅
全球5大电信厂家2007-2013年3季度利润增幅
2011年1季度-2013年3季度全球33家运营商季度资本开支增幅
2010-2015年中国三大运营商Carrier资本支出
2006-2016年全球移动通信基础设备市场规模
2009-2016年全球LTE设备市场规模
2009-2017年全球LTE BASESTATION出货量与投资规模
2013年全球移动通信基础设备主要厂家市场占有率
2013年全球4G移动通信基础设备主要厂家市场占有率
2012-2017年RRH出货量
2012-2017年RRH市场规模
2013年RRH主要厂家市场占有率
2013年RRH出货量功率分布
中国移动4G Basestation招标厂家占有率
中国电信4G Basestation招标厂家占有率
2011-2017年数据中心市场规模
2011-2017年DC(DataCenter)系统支出增幅
2010-2015年全球Switching市场速度分布
2010-2015年全球Switching市场出货量速度分布
2005-2012年Edge与Core Router市场主要厂家市场占有率
2013年全球DSL业者市场占有率
TOP FIVE DSL/VDSL Vendors by Region
2011年1季度-2013年4季度全球手机出货量
2007-2014年全球手机出货量
Worldwide Smartphone Sales to End Users by Vendor in 2013
Worldwide Smartphone Sales to End Users by Operating System in 2013
Worldwide Mobile Phone Sales to End Users by Vendor in 2013
2013年2季度智能手机操作系统出货量和市场占有率
2013年2季度主要安卓手机厂商出货量和市场占有率
2013年2季度主要Windows Phone 智能手机厂商出货量和市场占有率
2011-2013中国主要厂家智能手机出货量
2013年中国手机市场主要厂家市场占有率
2013年1-11月中国手机产量地域分布
2013年全球电子合约制造业产值地域分布
2012、2013年全球前20大电子合约制造企业收入排名
2012、2013年全球前18大电子合约制造企业毛利率统计
2007-2014年鸿海收入与毛利率
2012年1月-2014年1月鸿海月度收入
2013年鸿海收入客户分布
2012年鸿海大陆关键子公司财务数据
2008-2014年比亚迪电子收入与毛利率
2006-2013年比亚迪电子收入业务分布
2013年比亚迪电子Component&Module事业收入产品分布
2013年比亚迪电子收入客户分布
2009-2014财年Flextronics收入与毛利
2009-2013财年Flextronics资产负债表
2012年2季度-2013年4季度Flextronics季度收入与毛利率
2011-2014财年Flextronics收入地域分布
2012-2014财年Flextronics Property and equipment地域分布
2011-2014财年Flextronics收入业务分布
2009-2014财年Jabil收入与营业利润率
2012财年1季度-2013财年4季度Jabil季度收入与毛利率
2011-2013财年Jabil收入业务分布
2011-2013财年Jabil收入地域分布
2012-2013财年Jabil Long-lived assets地域分布
2005-2013年Quanta收入与毛利率
2011年12月-2013年12月广达月度收入与增幅
2004-2011年广达笔记本电脑出货量及增幅
2013-2014年Quanta收入产品分布
Quanta Computer Organization
Quanta Computer Group Organization
仁宝2005-2013年收入与毛利率
2011年12月-2013年12月仁宝收入与同比增幅
2007-2011年仁宝笔记本电脑出货量与增幅
Compal全球分布
仁宝集团结构
2009-2011年仁宝中国公司产量
纬创2003-2013年收入与毛利率
2011年12月-2013年12月纬创月度收入
纬创2004-2013年笔记本电脑出货量与增幅
2013年纬创收入产品分布
2012年纬创关键子公司财务报表
英业达集团结构
2011年12月-2013年12月英业达收入与每月增幅
2005-2013年Inventec笔记本电脑出货量
2012年英业达关键子公司财务报表
和硕集团结构
2008-2013年和硕收入与毛利率
2011年12月-2013年12月和硕月度收入
2013年和硕收入产品分布
2012年和硕关键子公司财务数据
2008-2013年Celestica收入与毛利率
2012年1季度-2013年4季度Celestica收入下游分布
2010-2013年Celestica收入下游分布
2010-2012 年Celestica收入地域分布
金宝集团组织结构
2007-2013年泰金宝收入与毛利率
2013年泰金宝收入产品分布
泰金宝集团结构
2008-2013年Benchmark收入与毛利率
2010-2013年Benchmark收入下游分布
2009-2014财年Sanmina收入与营业利润率
2012财年4季度-2014财年1季度Sanmina收入与毛利率
2011-2013财年Sanmina收入下游分布
2011-2013年Sanmina收入地域分布
Sanmina生产基地一览
2008-2013年环隆电气收入与毛利率
2012年1季度-2013年4季度环隆电气季度收入与毛利率
2012年1季度-2013年4季度环隆电气季度收入产品分布
2008-2013年环旭电子收入与营业利润率
2011-2013年环旭电子收入下有分布
2011-2012年环旭电子各项产品产量
2012年环旭电子成本结构
2008-2013年SIIX收入与毛利率
SIIX Organizational
2012年SIIX收入下游分布
2013年SIIX前9个月收入下游分布
2012、2013年前9个月SIIX收入地域分布
2009-2013财年Plexus收入与毛利率
2011-2013财年Plexus收入下游分布
2011-2013财年Plexus收入地域分布
2007-2013年深圳长城开发科技收入与毛利率
2008-2013年Venture收入与毛利率
2011-2013年Venture收入业务分布
Zollner主要客户
SUMITRONICS主要产品
SUMITRONICS全球分布
精成科技组织结构
2007-2013年精成科技收入与毛利率
2012年1月-2014年1月精成科技月度收入
2009-2014财年 VTech收入与税前利润率
2010-2013年Vtech收入业务分布
2012-2013年Vtech的CMS业务收入产品分布
2014财年Vtech的CMS事业部收入地域分布
CMS事业部主要产品
CMS制造能力
2011-2014年CMS产能扩展
3CEMS主要产品
3CEMS PCB能力
3CEMS 工厂分布
2009-2014年卓翼科技收入与毛利率
2009-2013年卓翼科技收入产品分布
2009-2013财年柏能集团收入与毛利率
2009-2013财年柏能集团收入产品分布
2009-2013财年柏能集团收入地域分布
Process of EMS and ODM
EMS and ODM Market Size, 2011-2017E
Downstream Distribution of EMS and ODM Market, 2013 vs 2017E
Desktop PC Shipment, 2008-2015E
Global Device Shipment by Operating System
Top 5 PC Vendors and Global PC Shipment, Q4 2013
Top 5 PC Vendors and Global PC Shipment, 2013
Laptop Shipment, 2008-2015E
Shipment of Major Global Laptop ODM Vendors, 2010-2013
Global Tablet PC Shipment, 2010-2016E
Market Share of Major Tablet PC Brands, 2013
Output of Global Tablet PC Vendors, 2012-2013
Revenue Growth Rate of Top Global 5 Telecom Vendors, 2007-Q3 2013
Profit Growth Rate of Top Global 5 Telecom Vendors, 2007-Q3 2013
Quarterly Capital Expenditure Growth Rate of 33 Global Operators, Q1 2011-Q3 2013
Capital Expenditure of Three Major Chinese Operators, 2010-2015E
Global Mobile Communications Infrastructure Equipment Market Size, 2006-2016E
Global LTE Equipment Market Size, 2009-2016E
Global LTE Basestation Shipment and Investment Scale, 2009-2017E
Market Share of Major Global Mobile Communications Infrastructure Equipment Vendors, 2013
Market Share of Major Global 4G Mobile Communications Infrastructure Equipment Vendors, 2013
RRH Shipment, 2012-2017E
RRH Market Size, 2012-2017E
Market Share of Major RRH Vendors, 2013
RRH Shipment by Power, 2013
Market Share of China Mobile 4G Basestation Bidding Vendors
Market Share of China Telecom 4G Basestation Bidding Vendors
Data Center Market Size, 2011-2017E
DC (DataCenter) System Expenditure Growth Rate, 2011-2017E
Global Switching Market by Speed, 2010-2015E
Global Switching Shipment by Speed, 2010-2015E
Market Share of Major Edge and Core Router Vendors, 2005-2012
Market Share of Global DSL Vendors, 2013
Top 5 DSL/VDSL Vendors by Region
Global Mobile Phone Shipment, Q1 2011-Q4 2013
Global Mobile Phone Shipment, 2007-2014
Worldwide Smartphone Sales to End Users by Vendor, 2013
Worldwide Smartphone Sales to End Users by Operating System, 2013
Worldwide Mobile Phone Sales to End Users by Vendor, 2013
Smartphone Operating System Shipment and Market Share, Q2 2013
Shipment and Market Share of Major Android Mobile Phone Vendors, Q2 2013
Shipment and Market Share of Major Windows Smartphone Vendors, Q2 2013
Smartphone Shipment of Major Chinese Vendors, 2011-2013
Market Share of Major Chinese Mobile Phone Vendors, 2013
Mobile Phone Output by Region, Jan-Nov 2013
Global EMS and ODM Output Value by Region, 2013
Ranking of Global Top 20 EMS and ODM Vendors by Revenue, 2012-2013
Gross Margin of Global Top 18 EMS and ODM Vendors, 2012-2013
Hon Hai’s Revenue and Gross Margin, 2007-2014
Hon Hai’s Monthly Revenue, Jan 2012-Jan 2014
Hon Hai’s Revenue by Client, 2013
Financial Data of Hon Hai's Key Subsidiaries in Mainland China, 2012
Revenue and Gross Margin of BYD Electronic, 2008-2014
Revenue of BYD Electronic by Business, 2006-2013
Revenue of BYD Electronic’s Component & Module Division by Product, 2013
Revenue of BYD Electronic by Client, 2013
Revenue and Gross Profit of Flextronics, FY2009-FY2014
Balance Sheet of Flextronics, FY2009-FY2013
Quarterly Revenue and Gross Margin of Flextronics, Q2 2012-Q4 2013
Revenue of Flextronics by Region, FY2011-FY2014
Property and Equipment of Flextronics by Region, FY2012-FY2014
Revenue of Flextronics by Business, FY2011-FY2014
Jabil’s Revenue and Operating Margin, FY2009-FY2014
Jabil’s Quarterly Revenue and Gross Margin, Q1 FY2012-Q4 FY2013
Jabil’s Revenue by Business, 2011-2013
Jabil’s Revenue by Region, FY2011-FY2013
Jabil’s Long-lived Assets by Region, FY2012-FY2013
Quanta’s Revenue and Gross Margin, 2005-2013
Quanta’s Monthly Revenue and Growth Rate, Dec 2011-Dec 2013
Quanta’s Laptop Shipment and Growth Rate, 2004-2011
Quanta’s Revenue by Product, 2013-2014
Quanta’s Organization
Compal’s Revenue and Gross Margin, 2005-2013
Compal’s Revenue and YoY Growth Rate, Dec 2011-Dec 2013
Compal’s Laptop Shipment and Growth Rate, 2007-2011
Compal's Global Presence
Compal's Structure
Output of Compal China, 2009-2011
Wistron’s Revenue and Gross Margin, 2003-2013
Wistron’s Monthly Revenue, Dec 2011- Dec 2013
Wistron’s Laptop Shipment and Growth Rate, 2004-2013
Wistron’s Revenue by Product, 2013
Financial Data of Wistron’s Key Subsidiaries, 2012
Inventec’s Structure
Inventec’s Revenue and Monthly Growth Rate, Dec 2011- Dec 2013
Inventec’s Laptop Shipment, 2005-2013
Financial Data of Inventec’s Key Subsidiaries, 2012
Pegatron’s Structure
Pegatron’s Revenue and Gross Margin, 2008-2013
Pegatron’s Monthly Revenue, Dec 2011- Dec 2013
Pegatron’s Revenue by Product, 2013
Financial Data of Pegatron’s Key Subsidiaries, 2012
Celestica’s Revenue and Gross Margin, 2008-2013
Celestica’s Revenue by Application, Q1 2012-Q4 2013
Celestica’s Revenue by Application, 2010-2013
Celestica’s Revenue by Region, 2010-2012
Kinpo’s Organizational Structure
Cal-Comp's Revenue and Gross Margin, 2007-2013
Cal-Comp's Revenue by Product, 2013
Cal-Comp's Structure
Benchmark’s Revenue and Gross Margin, 2008-2013
Benchmark’s Revenue by Application, 2010-2013
Sanmina’s Revenue and Operating Margin, FY2009-FY2014
Sanmina’s Revenue and Gross Margin, Q4 FY2012-Q1 FY2014
Sanmina’s Revenue by Application, FY2011-FY2013
Sanmina’s Revenue by Region, 2011-2013
Sanmina’s Production Bases
Revenue and Gross Margin of Universal Scientific Industrial, 2008-2013
Quarterly Revenue and Gross Margin of Universal Scientific Industrial, Q1 2012-Q4 2013
Quarterly Revenue of Universal Scientific Industrial by Product, Q1 2012-Q4 2013
Revenue and Operating Margin of Universal Scientific Industrial (Shanghai), 2008-2013
Revenue of Universal Scientific Industrial (Shanghai) by Application, 2011-2013
Output of Universal Scientific Industrial (Shanghai) by Product, 2011-2012
Cost Structure of Universal Scientific Industrial (Shanghai), 2012
SIIX’s Revenue and Gross Margin, 2008-2013
SIIX’s Organizational Structure
SIIX’s Revenue by Application, 2012
SIIX’s Revenue by Application, Sep 2013
SIIX’s Revenue by Region, 2012-Sep 2013
Revenue and Gross Margin of Plexus, FY2009-FY2013
Revenue of Plexus by Application, FY2011-FY2013
Revenue of Plexus by Region, FY2011-FY2013
Revenue and Gross Margin of Shenzhen Kaifa Technology Co., Ltd., 2007-2013
Venture’s Revenue and Gross Margin, 2008-2013
Venture’s Revenue by Business, 2011-2013
Zollner’s Major Clients
Major Products of SUMITRONICS
Global Presence of SUMITRONICS
GBM’s Organizational Structure
GBM’s Revenue and Gross Margin, 2007-2013
GBM’s Monthly Revenue, Jan 2012-Jan 2014
VTech’s Revenue and Pre-tax Profit Margin, FY2009-FY2014
Vtech’s Revenue by Business, 2010-2013
Vtech’s CMS Revenue by Product, 2012-2013
Revenue of Vtech’s CMS Division by Region, FY2014
Major Products of CMS Division
CMS Manufacturing Capacity
CMS Capacity Expansion, 2011-2014
Major Products of 3CEMS
PCB Capacity of 3CEMS
Plants of 3CEMS
Revenue and Gross Margin of Shenzhen Zowee Technology, 2009-2014
Revenue of Shenzhen Zowee Technology by Product, FY2009-FY2013
Revenue and Gross Margin of PC Partner Group, FY2009-FY2013
Revenue of PC Partner Group by Product, FY2009-FY2013
Revenue of PC Partner Group by Region, FY2009-FY2013
如果这份报告不能满足您的要求,我们还可以为您定制报告,请 留言说明您的详细需求。
|