|
|
|
报告导航:研究报告—
制造业—材料
|
|
2013-2016年中国铝轧制行业研究报告 |
 |
字数:3.3万 |
页数:97 |
图表数:96 |
|
中文电子版:8500元 |
中文纸版:4250元 |
中文(电子+纸)版:9000元 |
|
英文电子版:2250美元 |
英文纸版:2400美元 |
英文(电子+纸)版:2550美元 |
|
编号:CYH024
|
发布日期:2014-03 |
附件:下载 |
 |
|
|
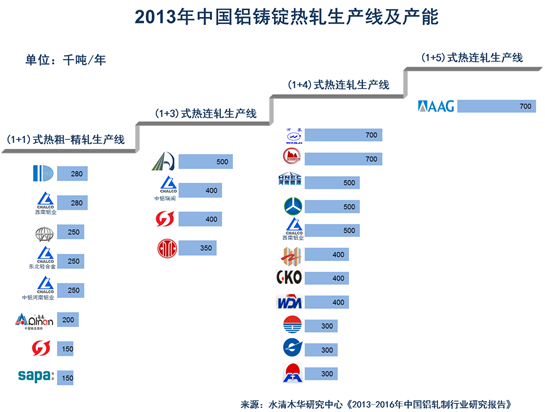
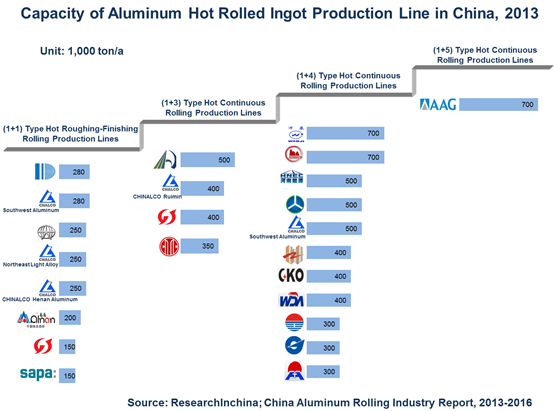
中国是全球最大铝板带箔生产国。截止2013年底,中国铝箔产能达340万吨/年,铝冷轧板带和铝热轧带生产能力均达到1250万吨/年,其中热轧带生产线主要以(1+4)式热连轧为主,占热轧总产能的43.6%。
中国也是全球最大铝轧制产品净出口国,2013年,中国铝板带和铝箔净出口分别达121.4万吨和69.9万吨。因技术短板,中国进口主要以高精铝板带箔为主。
受汽车、包装、印刷等下游需求强劲拉动,中国铝板带和铝箔需求量逐年增长。2013年,中国铝板带和铝箔表观消费量分别同比增长8.4%和4.9%。预计2014-2016年中国铝板带和铝箔复合增长率有望分别达11.0%和9.0%左右,而航空级铝厚板、汽车车身用铝板带、高压阳极电子箔等高端铝板带箔产品将成为其增长的主要拉动力。
因看好中国铝板带箔未来市场前景,西南铝业、南山铝业、云铝股份、鲁丰环保、东阳光铝等中国主要铝轧制生产企业纷纷加大投资力度,扩充铝轧制产品产能。
南山铝业是中国具备铝加工全产业链的生产企业之一。近几年,公司不断扩增铝材产能: 2011年公司上马20万吨超大规格高性能特种铝合金材料生产线项目;2013年公司又新增12万吨/年铝合金铸棒和1.4万吨/年大型精密模锻件项目,上述项目均将于2015年投产,届时公司铝轧制产能有望达222.0万吨/年。
东阳光铝是中国中高压化成箔、电子光箔、亲水箔等细分市场主要生产商。2013年,公司通过非公开发行A股募集资金建设中高压化成箔生产线项目和高比容腐蚀箔生产线项目,投产后将新增2100万平方米/年的化成箔产能和3500万平方米/年的腐蚀箔产能。
水清木华研究中心《2013-2016年中国铝轧制行业研究报告》着重研究了以下内容:
 中国铝冶炼行业市场供需及价格等; 中国铝冶炼行业市场供需及价格等;
中国铝轧制行业发展政策、生产线分布、铝板带及铝箔市场供需、进出口、竞争格局、发展趋势等;
建筑、包装、印刷、电力等铝板带及铝箔产品下游需求发展情况;
中国17家铝轧制重点企业经营情况、铝轧制业务及发展战略等。
As of late 2013, the capacity of aluminum foil in China, as the world’s largest producer of aluminum sheets, strips and foils, hit 3.4 million tons/a; the capacity of aluminum cold rolling sheet/strip and aluminum hot rolling strip both reached 12.5 million tons/a. In particular, “1+4” hot continuous rolling played a large part of hot rolling strip production line, making up 43.6% of the total hot rolling capacity.
China also boasts the largest net exporter of aluminum rolling products in the world. In 2013, China’s net export of aluminum sheet/strip and aluminum foil realized 1.214 million tons and 699,000 tons. Due to technical shortcomings, most of China’s imports are high-precision aluminum sheet/strip products.
Driven by robust demand from downstream sectors like automobile, packaging and printing, China is seeing a rising demand for aluminum sheet/strip/foil. In 2013, China’s apparent consumption of aluminum sheet/strip and aluminum foil grew by 8.4% and 4.9% from a year earlier, respectively. In 2014-2016,it is expected that the CAGRs of aluminum sheet/strip and aluminum foil will claim roughly 11.0% and 9.0%, respectively. The high-end aluminum sheet/strip/foil products such as aerospace-grade thick aluminum sheet, auto body aluminum sheet/strip, and high-voltage anode electron foil are projected to be a major driving force of the growth.
Confident about future alumium sheet/strip/foil marekt, leading domestic alumium rolling enterprsies including Southwest Aluminum (Group) Co., Ltd, Shandong Nanshan Aluminum, Yunnan Aluminum, Loften Environmental Technology Co.,Ltd., and Guangdong Dongyangguang Aluminum have poured more invemsent in expanding the capacity of alumium rolling products.
Shandong Nanshan Aluminum is one of the industrial players involving in the whole industry chain relating to aluminum processing. In recent years, the company has stepped up efforts to expand the capacity of alumium products. In 2011, it rolled out the 200,000 tons/a oversized high-performance special aluminum alloy material production project; in 2013, the company launched new 120,000 tons/a alumium alloy castings and 14,000 tons/a large-scale high-precision die forging projects. These two projects are scheduled to be put into producion in 2015, by when, the company’s aluminum rolling capaicty is expected to hit 2.22 million tons/a.
Guangdong Dongyangguang Aluminum is a major producer in China high-and mid-pressure formed foil, electron aluminum foil, hydrophilic foil markets and other market breakdown. In 2013, the company raised funds through no-pubilc issuing A-share to build high-and mid-pressure formed foil producion line project and high specific volume etched foil production line project. After being put into production, the company wil see an increase in annual capacty of 21 milion sq meters of formed foil and 35 million sq meters of etched foil.
The report highlights the following:
Supply & demand and Prices in China aluminum smelting industry;
Development strategy, production line distribution, supply and demand, import and export, competition pattern and development tendency of aluminum sheet/strip/foil in China aluminum rolling industry;
Demand for aluminum sheet/strip/foil products in the downstream of building, packaging, printing, and electricity;
Operation, aluminum rolling business and development strategy of 17 aluminum rolling key enterprises in China;
第一章铝轧制行业概述
1.1 定义
1.2 产业链
第二章中国铝冶炼行业发展
2.1 供给
2.2 需求
2.3 市场价格
第三章中国铝轧制行业发展
3.1 政策
3.2 发展概述
3.2.1 概述
3.2.2 生产线
3.3 供给
3.3.1 铝合金板带材
3.3.2 铝箔
3.4 进出口
3.4.1 铝合金板带
3.4.2 铝箔
3.5 需求
3.5.1 消费量
3.5.2 消费格局
第四章铝轧制产品在中国的应用
4.1 铝板带的应用
4.1.1 建筑
4.1.2 包装
4.1.3 运输
4.1.4 印刷
4.2 铝箔的应用
4.2.1 热传输
4.2.2 包装
4.2.3 电力电子
第五章中国主要铝轧制行业生产企业
5.1 中国铝业股份有限公司(601600)
5.1.1 企业简介
5.1.2 经营情况
5.1.3 营收构成
5.1.4 铝轧制业务
5.1.5 发展前景
5.2 河南明泰铝业股份有限公司(601677)
5.2.1 企业简介
5.2.2 经营情况
5.2.3 营收构成
5.2.4 毛利率
5.2.5 产销量
5.2.6 在建项目
5.2.7 发展前景
5.3 浙江栋梁新材股份有限公司(002082)
5.3.1 企业简介
5.3.2 经营情况
5.3.3 营收构成
5.3.4 毛利率
5.3.5 发展前景
5.4 山东南山铝业股份有限公司(600219)
5.4.1 企业简介
5.4.2 经营情况
5.4.3 营收构成
5.4.4 毛利率
5.4.5 产能
5.4.6 在建项目
5.4.7 发展前景
5.5 云南铝业股份有限公司(000807)
5.5.1 企业简介
5.5.2 经营情况
5.5.3 营收构成
5.5.4 毛利率
5.5.5 产销量
5.5.6 铝加工业务
5.5.7 发展前景
5.6 广东东阳光铝业股份有限公司(600673)
5.6.1 企业简介
5.6.2 经营情况
5.6.3 营收构成
5.6.4 毛利率
5.6.5 铝轧制业务
5.6.6 发展前景
5.7 江苏常铝铝业股份有限公司(002160)
5.7.1 企业简介
5.7.2 经营情况
5.7.3 营收构成
5.7.4 在建工程
5.7.5 发展前景
5.8 鲁丰环保科技股份有限公司(002379)
5.8.1 企业简介
5.8.2 经营情况
5.8.3 营收构成
5.8.4 在建项目
5.8.5 发展前景
5.9 新疆众和股份有限公司(600888)
5.9.1 企业简介
5.9.2 经营情况
5.9.3 营收构成
5.9.4 毛利率
5.9.5 在建项目
5.9.6 发展前景
5.10 中国忠旺(01333.HK)
5.10.1 企业简介
5.10.2 经营情况
5.10.3 营收构成
5.10.4 产销量
5.10.5 铝轧制业务
5.11 西南铝业(集团)有限责任公司
5.11.1 企业简介
5.11.2 经营情况
5.12 亚洲铝业
5.12.1 企业简介
5.12.2 铝轧制业务
5.13 镇江鼎胜
5.13.1 企业简介
5.13.2 产能
5.13.3 在建工程
5.14 江苏中联科技集团有限公司
5.14.1 企业简介
5.14.2 经营情况
5.15 南通南辉电子材料股份有限公司
5.15.1 企业简介
5.15.2 经营情况
5.16 广西贺州市桂东电子科技有限责任公司
5.16.1 企业简介
5.16.2 经营情况
5.17 厦门厦顺
第六章结论与预测
6.1 竞争格局
6.2 预测
1. Overview of Aluminum Rolling Industry
1.1 Definition
1.2 Industrial Chain
2. Development of China Aluminum Smelting Industry
2.1 Supply
2.2 Demand
2.3 Market Price
3. Development of China Aluminum Rolling Industry
3.1 Policy
3.2 Development Overview
3.2.1 Overview
3.2.2 Production Line
3.3 Supply
3.3.1 Aluminum Alloy Sheet/Strip
3.3.2 Aluminum Foil
3.4 Import & Export
3.4.1 Aluminum Alloy Sheet/Strip
3.4.2 Aluminum Foil
3.5 Demand
3.5.1 Consumption
3.5.2 Consumption Pattern
4. Application of Aluminum Rolled Products in China
4.1 Application of Aluminum Sheet/Strip
4.1.1 Building
4.1.2 Packaging
4.1.3 Transportation
4.1.4 Printing
4.2 Application of Aluminum Foil
4.2.1 Heat Transfer
4.2.2 Packaging
4.2.3 Power Electronics
5. Major Aluminum Rolling Enterprises in China
5.1 Aluminum Corporation of China Limited (601600)
5.1.1 Profile
5.1.2 Operation
5.1.3 Revenue Structure
5.1.4 Aluminum Rolling Business
5.1.5 Development Prospect
5.2 Henan Mingtai Al. Industrial Co., Ltd (601677)
5.2.1 Profile
5.2.2 Operation
5.2.3 Revenue Structure
5.2.4 Gross Margin
5.2.5 Output & Sales Volume
5.2.6 Projects under Construction
5.2.7 Development Prospect
5.3 Zhejiang Dongliang New Material Co., Ltd. (002082)
5.3.1 Profile
5.3.2 Operation
5.3.3 Revenue Structure
5.3.4 Gross Margin
5.3.5 Development Prospect
5.4 Shandong Nanshan Aluminum Co.,Ltd. (600219)
5.4.1 Profile
5.4.2 Operation
5.4.3 Revenue Structure
5.4.4 Gross Margin
5.4.5 Capacity
5.4.6 Projects under Construction
5.4.7 Development Prospect
5.5 Yunnan Aluminium Co. Ltd. (000807)
5.5.1 Profile
5.5.2 Operation
5.5.3 Revenue Structure
5.5.4 Gross Margin
5.5.5 Output & Sales Volume
5.5.6 Aluminum Processing Business
5.5.7 Development Prospect
5.6 Guangdong Dongyangguang Aluminum Co., Ltd (600673)
5.6.1 Profile
5.6.2 Operation
5.6.3 Revenue Structure
5.6.4 Gross Margin
5.6.5 Aluminum Rolling Business
5.6.6 Development Prospect
5.7 Jiangsu ALCHA Aluminium Co.,Ltd. (002160)
5.7.1 Profile
5.7.2 Operation
5.7.3 Revenue Structure
5.7.4 Projects under Construction
5.7.5 Development Prospect
5.8 Loften Environmental Technology Co.,Ltd. (002379)
5.8.1 Profile
5.8.2 Operation
5.8.3 Revenue Structure
5.8.4 Projects under Construction
5.8.5 Development Prospect
5.9 Xinjiang Joinworld Co., Ltd. (600888)
5.9.1 Profile
5.9.2 Operation
5.9.3 Revenue Structure
5.9.4 Gross Margin
5.9.5 Projects under Construction
5.9.6 Development Prospect
5.10 China Zhongwang Holdings Limited (01333.HK)
5.10.1 Profile
5.10.2 Operation
5.10.3 Revenue Structure
5.10.4 Output & Sales Volume
5.10.5 Aluminum Rolling Business
5.11 Southwest Aluminium (Group) Co., Ltd
5.11.1 Profile
5.11.2 Operation
5.12 AsiaAlum Holdings Limited
5.12.1 Profile
5.12.2 Aluminum Rolling Business
5.13 Zhenjiang Dingsheng Aluminium Industries Joint-Stock Limited Company
5.13.1 Profile
5.13.2 Capacity
5.13.3 Projects under Construction
5.14 Jiangsu Zhonglian Technology Group Co., Ltd.
5.14.1 Profile
5.14.2 Operation
5.15 Nantong Southlight Electronic Material Co., Ltd.
5.15.1 Profile
5.15.2 Operation
5.16 Guangxi Hezhou Guidong Electronic Technology Co., Ltd. (GET)
5.16.1 Profile
5.16.2 Operation
5.17 Xiashun Holdings Limited
6. Conclusion & Forecast
6.1 Competition Pattern
6.2 Forecast
图:铝轧制工业产品模型
图:铝轧制产品产业链
图:2008-2013年中国电解铝产量及同比增长
图:2008-2013年中国电解铝消费量及同比增长
图:2008-2014年LME铝现货结算价
图:2008-2014年上海期货交易所铝结算价
表:2006-2013年中国铝轧制行业主要政策
表:2013年中国建成及在建(分企业)(1+1)式热粗-精轧生产线
表:2013年中国建成的(分企业)(1+3)式热连轧生产线
表:2013年中国建成及在建(分企业)(1+4)式热连轧生产线
表:2013年中国铝冷轧带建成及在建项目
图:2008-2013年中国铝冷轧带材产品产能
图:2008-2013年中国铝板带材产品产量及同比增长
图:2008-2013年中国铝箔产能
图:2008-2013年中国铝箔产量及同比增长
表:2013年中国铝箔新投产及在建项目及产能
图:2008-2013年中国铝合金板带材出口量及同比增长
图:2008-2013年中国铝板带进口量及同比增长
图:2008-2013年中国铝箔出口量及同比增长
图:2008-2013年中国铝箔进口量及同比增长
图:2008-2013年中国铝轧制板带材表观消费量
图:2008-2013年中国铝箔表观消费量
图:中国铝合金板带材消费格局
图:中国铝箔消费格局
图:2008-2016年中国建筑工业铝板带需求量
图:2008-2016年中国包装用铝板带需求量
图:2008-2016年中国交通运输设备用铝板带需求量
图:2008-2016年中国印刷产业用板带材需求量
图:2008-2016年中国空调铝箔需求量
图:2008-2016年中国包装用铝箔需求量
图:2008-2016年中国电力用铝箔需求量
图:2008-2013年中国铝业营业收入与净利润
图:2008-2013年中国铝业(分业务)营业收入
图:2009-2013年中国铝业(分地区)营业收入
表:2012年中国铝业公司铝轧制业务子公司分布
表:2013-2016年中国铝业股份营业收入与净利润
图:2008-2013年明泰铝业营业收入与净利润
图:2008-2013年明泰铝业(分产品)营业收入
图:2008-2013年明泰铝业(分地区)营业收入
图:2008-2013年明泰铝业(分产品)毛利率
表:2011-2012年明泰铝业(分产品)产销量、库存及产销率
表:2013年明泰铝业在建项目
表:2012-2016年明泰铝业营业收入与净利润
图:2008-2013年栋梁新材营业收入与净利润
图:2008-2013年栋梁新材(分产品)营业收入
图:2009-2013年栋梁新材(分地区)营业收入
图:2008-2013年栋梁新材(分产品)毛利率
表:2013-2016年栋梁新材营业收入与净利润
图:2008-2013年南山铝业营业收入与净利润
图:2008-2013年南山铝业(分产品)营业收入
图:2009-2013年南山铝业(分地区)营业收入
图:2008-2013年南山铝业(分产品)毛利率
表:2012-2013年南山铝业(分产品)产能
表:2013年南山铝业在建及拟建项目
表:2012-2016年南山铝业营业收入与净利润
图:2008-2013年云铝股份营业收入与净利润
图:2008-2013年云铝股份(分产品)营业收入
图:2008-2013年云铝股份(分地区)营业收入
图:2008-2013年云铝股份(分产品)毛利率
表:2010-2013年云铝股份(分产品)产能、产销量
表:2013年云铝股份主要在建项目
表:2012-2016年云铝股份营业收入与净利润
图:2008-2013年东阳光铝营业收入与净利润
图:2009-2013年东阳光铝(分产品)营业收入
图:2008-2013年东阳光铝(分地区)营业收入
图:2009-2013年东阳光铝(分产品)毛利率
表:2011-2012年东阳光铝铝加工业务(分产品)产能、产销量及产销率
表:2013年东阳光铝铝箔产品在建项目
表:2012-2016年东阳光铝营业收入与净利润
表:2013-2016年常铝股份营业收入与净利润
图:2008-2013年鲁丰环保营业收入与净利润
图:2013H1鲁丰环保(分产品)营业收入占比
图:2008-2013年鲁丰环保(分地区)营业收入
表:2013年鲁丰环保铝轧制业务在建项目
表:2013-2016年鲁丰环保营业收入与净利润
图:2008-2013年众和股份营业收入与净利润
图:2013H1众和股份(分产品)营业收入占比
图:2008-2013年众和股份(分地区)营业收入
图:2008-2013年众和股份(分产品)毛利率
表:2012-2016年众和股份营业收入与净利润
图:2008-2013年忠旺集团营业收入与净利润
表:2010-2013年忠旺集团铝型材(分产品)营业收入及占比
表:2011-2013年忠旺集团(分地区)营业收入及占比
表:2010-2013年忠旺集团铝型材产品产能及产量
表:2010-2013年忠旺集团铝型材(分产品)销量及销售均价
表:2013年镇江鼎胜铝业子公司及产能分布
2013年镇江鼎胜铝业公司在建/拟建项目
图:2008-2013年江苏中联科技营业收入与同比增长
图:2008-2013年江苏中联科技出口额
图:2008-2013年南通南辉电子材料公司营业收入与同比增长
图:2008-2013年桂东电子营业收入与同比增长
图:2012-2013年中国主要铝轧制生产企业营业收入
图:2012-2013年中国主要铝轧制企业营业收入同比增长率
表:2013年中国主要生产企业铝轧制产品产能
表:2013-2016年中国铝板带产量及表观消费量
表:2013-2016年中国铝箔产量及表观消费量
Product Models for Aluminum Rolling Industry
Industrial Chain of Aluminum Rolled Products
Output and YoY Growth of Electrolytic Aluminum in China, 2008-2013
Consumption and YoY Growth of Electrolytic Aluminum in China, 2008-2013
LME Aluminum Spot-Settlement Prices, 2008-2014
SHFE Aluminum Spot-Settlement Prices, 2008-2014
Major Policies for China Aluminum Rolling Industry, 2006-2013
Completed and Ongoing “1+1” Hot Rough - Finish Rolling Production Lines in China by Enterprise, 2013
Completed “1+3” Hot Continuous Rolling Production Lines in China by Enterprise, 2013
Completed and Ongoing”1+4” Hot Continuous Rolling Production Lines in China by Enterprise, 2013
Completed and Ongoing Cold Rolled Aluminum Strip Projects in China, 2013
Capacities of Cold Rolled Aluminum Strip Products in China, 2008-2013
Output and YoY Growth of Aluminum Sheet/Strip Products in China, 2008-2013
Capacity of Aluminum Foil in China, 2008-2013
Output and YoY Growth of Aluminum Foil in China, 2008-2013
Capacities of Start-up and Ongoing Aluminum Foil Projects in China, 2013
China’s Aluminum Alloy Sheet/Strip Export Volume and YoY Growth, 2008-2013
China’s Aluminum Sheet/Strip Import Volume and YoY Growth, 2008-2013
China’s Aluminum Foil Export Volume and YoY Growth, 2008-2013
China’s Aluminum Foil Import Volume and YoY Growth, 2008-2013
Apparent Consumption of Aluminum Rolled Sheet/Strip in China, 2008-2013
Apparent Consumption of Aluminum Foil in China, 2008-2013
Consumption Pattern of Aluminum Alloy Sheet/Strip in China
Consumption Pattern of Aluminum Foil in China
China’s Demand for Aluminum Sheet/Strip Used for Building Industry, 2008-2016E
China’s Demand for Aluminum Sheet/Strip Used in Packaging, 2008-2016E
China’s Demand for Aluminum Sheet/Strip Used for Transport and Communication Facilities, 2008-2016E
China’s Demand for Aluminum Sheet/Strip Used for Printing Industry, 2008-2016E
China’s Demand for Aluminum Foil for Air Conditioner, 2008-2016E
China’s Demand for Aluminum Foil Used in Packaging, 2008-2016E
China’s Demand for Aluminum Foil Used for Electric Power, 2008-2016E
Revenue and Net Income of Aluminum Corporation, 2008-2013
Revenue Breakdown of Aluminum Corporation by Business, 2008-2013
Revenue Breakdown of Aluminum Corporation by Region, 2009-2013
Distribution of Aluminum Rolling Subsidiaries under Aluminum Corporation, 2012
Revenue and Net Income of Aluminum Corporation, 2013-2016E
Revenue and Net Income of Henan Mingtai Al. Industrial, 2008-2013
Revenue Breakdown of Henan Mingtai Al. Industrial by Product, 2008-2013
Revenue Breakdown of Henan Mingtai Al. Industrial by Region, 2008-2013
Gross Margin of Henan Mingtai Al. Industrial by Product, 2008-2013
Output, Sales Volume, Inventory and Sales-Output Ratio of Henan Mingtai Al. Industrial by Product, 2011-2012
Projects under Construction of Henan Mingtai Al. Industrial, 2013
Revenue and Net Income of Henan Mingtai Al. Industrial, 2012-2016E
Revenue and Net Income of Zhejiang Dongliang New Material, 2008-2013
Revenue Breakdown of Zhejiang Dongliang New Material by Product, 2008-2013
Revenue Breakdown of Zhejiang Dongliang New Material by Region, 2009-2013
Gross Margin of Zhejiang Dongliang New Material by Product, 2008-2013
Revenue and Net Income of Zhejiang Dongliang New Material, 2013-2016E
Revenue and Net Income of Shandong Nanshan Aluminum, 2008-2013
Revenue Breakdown of Shandong Nanshan Aluminum by Product, 2008-2013
Revenue Breakdown of Shandong Nanshan Aluminum by Region, 2009-2013
Gross Margin of Shandong Nanshan Aluminum by Product, 2008-2013
Capacity of Shandong Nanshan Aluminum by Product, 2012-2013
Ongoing and Planned Projects of Shandong Nanshan Aluminum, 2013
Revenue and Net Income of Shandong Nanshan Aluminum, 2012-2016E
Revenue and Net Income of Yunnan Aluminium, 2008-2013
Revenue Breakdown of Yunnan Aluminium by Product, 2008-2013
Revenue Breakdown of Yunnan Aluminium by Region, 2008-2013
Gross Margin of Yunnan Aluminium by Product, 2008-2013
Capacity, Output and Sales Volume of Yunnan Aluminium by Product, 2010-2013
Major Projects under Construction of Yunnan Aluminium, 2013
Revenue and Net Income of Yunnan Aluminium, 2012-2016E
Revenue and Net Income of Guangdong Dongyangguang Aluminum, 2008-2013
Revenue of Guangdong Dongyangguang Aluminum by Product, 2009-2013
Revenue of Guangdong Dongyangguang Aluminum by Region, 2008-2013
Gross Margin of Guangdong Dongyangguang Aluminum by Product, 2009-2013
Capacity, Output, Sales Volume and Sales-Output Ratio of Aluminum Processing Business of Guangdong Dongyangguang Aluminum by Product, 2011-2012
Aluminum Foil Product Projects under Construction of Guangdong Dongyangguang Aluminum, 2013
Revenue and Net Income of Guangdong Dongyangguang Aluminum, 2012-2016E
Revenue and Net Income of Jiangsu ALCHA Aluminium, 2013-2016E
Revenue and Net Income of Loften Environmental Technology, 2008-2013
Revenue Structure of Loften Environmental Technology by Product, 2013H1
Revenue Breakdown of Loften Environmental Technology by Region, 2008-2013
Aluminum Rolling Projects under Construction of Loften Environmental Technology, 2013
Revenue and Net Income of Loften Environmental Technology 2013-2016E
Revenue and Net Income of Xinjiang Joinworld, 2008-2013
Revenue Structure of Xinjiang Joinworld by Product, 2013H1
Revenue Breakdown of Xinjiang Joinworld by Region, 2008-2013
Gross Margin of Xinjiang Joinworld by Product, 2008-2013
Revenue and Net Income of Xinjiang Joinworld, 2012-2016E
Revenue and Net Income of China Zhongwang Holdings Limited, 2008-2013
China Zhongwang Holdings Limited’s Aluminum Profile Revenue Breakdown and Percentage by Product, 2010-2013
China Zhongwang Holdings Limited’s Revenue Breakdown and Percentage by Region, 2011-2013
Capacities and Output of Aluminum Profile Products of China Zhongwang Holdings Limited, 2010-2013
Sales Volume and Average Sales Prices of Aluminum Profile Products of China Zhongwang Holdings Limited by Product, 2010-2013
Aluminum Subsidiaries under Zhenjiang Dingsheng Aluminium Industries and Capacity Distribution, 2013
Ongoing and Planned Projects of Zhenjiang Dingsheng Aluminium Industries, 2013
Revenue and YoY Growth of Jiangsu Zhonglian Technology Group, 2008-2013
Export Value of Jiangsu Zhonglian Technology Group, 2008-2013
Revenue and YoY Growth of Nantong Southlight Electronic Material, 2008-2013
Revenue and YoY Growth of GET, 2008-2013
Revenue of Major Aluminum Rolling Enterprises in China, 2012-2013
Revenue and YoY Growth of Major Aluminum Rolling Enterprises in China, 2012-2013
Capacities of Aluminum Rolled Products in China by Enterprise, 2013
Output and Apparent Consumption of Aluminum Sheet/Strip in China, 2013-2016E
Output and Apparent Consumption of Aluminum Foil in China, 2013-2016E
如果这份报告不能满足您的要求,我们还可以为您定制报告,请 留言说明您的详细需求。
|