|
|
|
报告导航:研究报告—
生命科学—生物科技
|
|
2013-2016年全球及中国生物降解塑料行业研究报告 |
 |
字数:4.1万 |
页数:101 |
图表数:66 |
|
中文电子版:8000元 |
中文纸版:4000元 |
中文(电子+纸)版:8500元 |
|
英文电子版:2250美元 |
英文纸版:2400美元 |
英文(电子+纸)版:2550美元 |
|
编号:ALZ-001
|
发布日期:2014-03 |
附件:下载 |
 |
|
|
近些年,全球生物降解塑料产需均呈较快增长趋势。其中,2012-2013年全球生物降解塑料产能为100-150万吨/年。全球研发的生物降解塑料品种达几十种,但实现批量和工业化生产的仅有淀粉基塑料(PSM)、聚乳酸(PLA)、PBS塑料等。2013年, PSM、PLA和PBS三大生物降解塑料产能合计占全球总产能的87%。
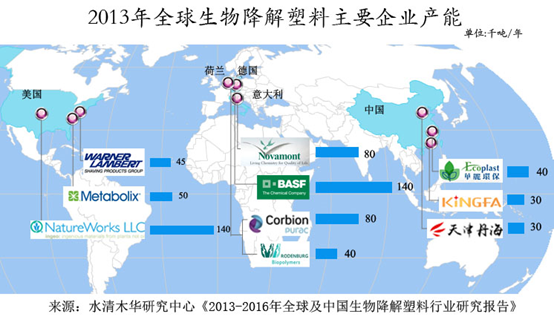
欧美是全球生物降解塑料主要市场,2013年欧洲、北美两地生物降解塑料需求占比分别为54%、28%。德国BASF、美国NatureWorks(2011年12月,泰国PTT Chemical 公司出资1.5亿美元购买其50%的股权)、意大利Novamont以及荷兰Purac是全球生物降解塑料主要供应商,2013年其产能分别为14万吨/年、14万吨/年、8万吨/年、8万吨/年。
中国是全球生物降解塑料重要供应地之一,约占全球产能的20%。2009-2013年,中国生物降解塑料产能年复合增长率超过21%。并且,在国家政策利好以及应用范围不断拓展等刺激下,国内多家企业开始着手生物降解塑料的新建或扩产。
金发科技是中国塑料行业龙头企业,产品覆盖改性塑料、特种工程塑料、完全生物降解塑料、碳纤维及其复合材料等。其中,产能3万吨/年聚丁二酸丁二醇酯与聚己二酸丁二醇酯共聚物(PBSA)已于2011年在珠海建成投产,二期9万吨/年PBSA扩建项目将择机启动。同时,金发科技还在加大下游需求拓展力度。2014年初,金发科技已与新疆建设兵团、贵州、山东等省市签订生物降解塑料地膜示范使用协议。
武汉华丽环保是国家生物降解材料产业化示范基地,主要淀粉基生物降解塑料PSM。2013年华丽环保PSM产能4万吨/年,居中国生物降解塑料行业第一。此外,公司还有6万吨/年PSM正在建设中,预计2014年中期投产。
《2013-2016年全球及中国生物降解塑料行业研究报告》主要包括以下几个方面:
 全球生物降解塑料市场供需、产品结构、区域结构、竞争格局、发展趋势等; 全球生物降解塑料市场供需、产品结构、区域结构、竞争格局、发展趋势等;
中国生物降解塑料市场供需、竞争格局、政策、发展趋势等;
PSM、PLA、PHA、PBS等生物降解塑料细分产品的发展现状、竞争格局等;
全球及中国20余家生物降解塑料生产企业的运营状况、生物降解塑料业务分析及发展情况等。
Global biodegradable plastic production and demand have grown rapidly in recent years, and the capacity reached 1-1.5 million t/a in 2012-2013. Among dozens of biodegradable plastic varieties developed so far, only plastarch material (PSM), polylactic acid (PLA), poly(butylene succinate) (PBS) have realized mass industrial production. In 2013, PSM, PLA and PBS accounted for 87% of the world’s total capacity.
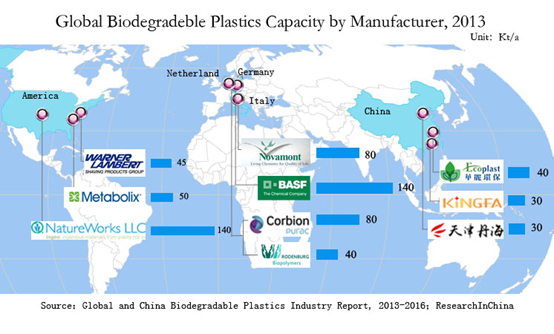
In 2013, demand from Europe and North America, the two main biodegradable plastic markets around the world, for biodegradable plastics accounted for 54% and 28%, respectively. Germany-based BASF, U.S.-based NatureWorks (Thailand’s PTT Chemical paid US$150 million for a 50% stake in NatureWorks in December 2011), Italy’s Novamont as well as the Netherlands-based Purac are the world’s major suppliers of biodegradable plastics, with capacity of 140 kt/a, 140 kt/a, 80 kt/a, 80 kt/a, respectively.
China as one of the world’s important suppliers of biodegradable plastics accounts for about 20% of global production capacity. In 2009-2013, its biodegradable plastic capacity grew at a compound annual growth rate of over 21%. And, under the stimulus of favorable national policies as well as expanding range of applications, many domestic enterprises have embarked on new construction or expansion of biodegradable plastics.
As a leader in domestic plastics industry, Kingfa Sci & Tech Co., Ltd. mainly produces modified plastics, specialty engineering plastics, completely biodegradable plastics, carbon fiber and composite materials, of which, the 30 kt/a PBS and polybutylene succinate adipate (PBSA) has been put into operation in Zhuhai in 2011, the Phase II 90 kt/a PBSA expansion project will be launched. Meanwhile, Kingfa is also increasing intensity of downstream demand expansion. The company has signed biodegradable plastic mulch demonstrative application agreements with Xinjiang Production and Construction Corps, Guizhou, Shandong and other provinces and cities in early 2014.
Wuhan Huali Environment Technology Co., Ltd is a national biodegradable material industrial demonstration base, mainly engaged in PSM, ranking first in China’s biodegradable plastics industry with 40 kt/a PSM in 2013. Besides, the company’s 60 kt/a PSM are under construction, expected to be put into operation by mid-2014.
Global and China Biodegradable Plastics Industry Report, 2013-2016 mainly covers the followings:
Supply and demand, product mix, regional structure, competition pattern, development trends of global biodegradable plastics market;
Supply and demand, competition pattern, policies, development trends of Chinese biodegradable plastics market;
Development status, competition pattern of biodegradable plastic product segments such as PSM, PLA, PHA, PBS;
Operation, biodegradable plastics business analysis and development of more than 20 domestic and foreign biodegradable plastics manufacturers.
第一章 生物降解塑料行业概述
1.1 定义
1.2 分类
1.3 产业链
第二章 全球生物降解塑料市场分析
2.1 市场供给
2.2 市场需求
2.3 产品结构
2.4 区域结构
2.4.1 美国
2.4.2 欧洲
2.4.3 日本
2.4.4 巴西
2.4.5 泰国
2.5 技术趋势
2.6 竞争格局
2.7 发展趋势
第三章 中国生物降解塑料市场分析
3.1 市场供给
3.2 市场需求
3.3 竞争格局
3.4 政策趋势
3.5 发展趋势
第四章 生物降解塑料行业细分市场分析
4.1 可塑淀粉生物降解塑料(PSM)
4.1.1 发展现状
4.1.2 竞争格局
4.2 聚乳酸(PLA)
4.2.1 简介
4.2.2 发展现状
4.2.3 竞争格局
4.3 聚羟基烷酸酯(PHA)
4.3.1 发展现状
4.3.2 竞争格局
4.4 聚丁二酸丁二醇酯(PBS)
4.4.1 简介
4.4.2 竞争格局
4.5 其他
4.5.1 聚己内酯(PCL)
4.5.2 二氧化碳共聚物(PPC)
4.5.3 脂肪族芳香族共聚酯
4.5.4 聚乙烯醇(PVA)
第五章 生物降解塑料行业主要外国企业
5.1 德国巴斯夫(BASF)
5.1.1 企业简介
5.1.2 经营情况
5.1.3 营收构成
5.1.4 毛利率
5.1.5 研发与投资
5.1.6 生物降解塑料业务
5.1.7 在华业务
5.1.8 发展前景
5.2 NatureWorksLLC
5.2.1 企业简介
5.2.2 在华业务
5.3 Novamont
5.4 Dupont
5.5 三菱化学
5.6 昭和电工
5.7 普拉克 PURAC
5.7.1 公司简介
5.7.2 生产情况
5.7.3 经营情况
第六章 生物降解塑料行业中国主要企业
6.1 金发科技(600143)
6.1.1 企业简介
6.1.2 经营情况
6.1.3 营收构成
6.1.4 毛利率
6.1.5 客户与供应商
6.1.6 PBS生物降解塑料业务
6.1.7 研发
6.1.8 发展前景
6.2 鑫富药业(002019)
6.2.1 企业简介
6.2.2 经营情况
6.2.3 营收构成
6.2.4 毛利率
6.2.5 客户与供应商
6.2.6 PBS生物降解塑料业务
6.2.7 研发
6.2.8 发展前景
6.3 武汉华丽环保
6.3.1 企业简介
6.3.2 经营情况
6.3.3 发展前景
6.4 安庆和兴化工
6.4.1 企业简介
6.4.2 经营情况
6.4.3 发展前景
6.5中国其他生物降解塑料生产商发展动态
6.5.1 浙江海正生物材料股份有限公司
6.5.2 宁波天安生物材料有限公司
6.5.3 浙江天禾生态科技有限公司
6.5.4 永乐生物工程有限公司
6.5.5 马鞍山同杰良生物材料有限公司
6.5.6 浙江华发生态科技有限公司
6.5.7 福建百事达生物材料有限公司
6.5.8 广东上九生物降解塑料有限公司
6.5.9 山东汇盈新材料科技有限公司
6.5.10 天津丹海股份有限公司
6.5.11 齐翔腾达(002408)
6.5.12天津国韵生物材料有限公司
6.5.13深圳市光华伟业实业有限公司
第七章 总结与预测
7.1 总结
7.2 供需预测
7.3 塑料薄膜预测
1. Overview of Biodegradable Plastics Industry
1.1 Definition
1.2 Classification
1.3 Industry Chain
2. Global Biodegradable Plastics Market
2.1 Market Supply
2.2 Global Demand
2.3 Product Mix
2.4 Regional Structure
2.4.1 USA
2.4.2 Europe
2.4.3 Japan
2.4.4 Brazil
2.4.5 Thailand
2.5 Technology Trends
2.6 Competition Pattern
2.7 Development Trends
3. China Biodegradable Plastics Market
3.1 Market Supply
3.2 Market Demand
3.3 Competition Pattern
3.4 Policy Trends
3.5 Development Trends
4. Biodegradable Plastics Market Segments
4.1 Plastarch Material (PSM)
4.1.1 Development Status
4.1.2 Competition Pattern
4.2 Polylactic Acid (PLA)
4.2.1 Introduction
4.2.2 Development Status
4.2.3 Competition Pattern
4.3 Polyhydroxyalkanoates (PHA)
4.3.1 Development Status
4.3.2 Competition Pattern
4.4 Poly(Butylene Succinate) (PBS)
4.4.1 Introduction
4.4.2 Competition Pattern
4.5 Others
4.5.1 Polycaprolactone (PCL)
4.5.2 Polypropylene Carbonate (PPC)
4.5.3 Aliphatic-Aromatic Copolyester
4.5.4 Polyvinyl Alcohol (PVA)
5. Main Companies in the World
5.1 BASF
5.1.1 Profile
5.1.2 Operation
5.1.3 Revenue Structure
5.1.4 Gross Margin
5.1.5 R&D and Investment
5.1.6 Biodegradable Plastics Business
5.1.7 Business in China
5.1.8 Development Prospect
5.2 NatureWorks LLC
5.2.1 Profile
5.2.2 Business in China
5.3 Novamont
5.4 Dupont
5.5 Mitsubishi Chemical
5.6 Showa Denko
5.7 PURAC
5.7.1 Profile
5.7.2 Production
5.7.3 Operation
6. Main Companies in China
6.1 Kingfa Sci & Tech Co., Ltd. (600143)
6.1.1 Profile
6.1.2 Operation
6.1.3 Revenue Structure
6.1.4 Gross Margin
6.1.5 Clients and Suppliers
6.1.6 PBS Biodegradable Plastics Business
6.1.7 R&D
6.1.8 Development Prospect
6.2 Zhejiang Hangzhou Xinfu Pharmaceutical Co., Ltd. (002019)
6.2.1 Profile
6.2.2 Operation
6.2.3 Revenue Structure
6.2.4 Gross Margin
6.2.5 Clients and Suppliers
6.2.6 PBS Biodegradable Plastics Business
6.2.7 R&D
6.2.8 Development Prospect
6.3 Wuhan Huali Environment Technology Co., Ltd.
6.3.1 Profile
6.3.2 Operation
6.3.3 Development Prospect
6.4 Anqing Hexing Chemical Co., Ltd
6.4.1 Profile
6.4.2 Operation
6.4.3 Development Prospect
6.5 Others
6.5.1 Zhejiang Hisun Biomaterials Co., Ltd.
6.5.2 Ningbo Tianan Biologic Material Co., Ltd.
6.5.3 Zhejiang Tianhe Environmental Technology Co., Ltd.
6.5.4 Henan Yongle Biological Engineering Co., Ltd.
6.5.5 Maanshan Tong-Jie-Liang Biomaterials Co., Ltd.
6.5.6 Zhejiang Wafa Ecosystem Science & Technology Co., Ltd.
6.5.7 Fujian Beststarch Biodegradable Material Co., Ltd.
6.5.8 Guangdong Shangjiu Biodegradable Plastics Co., Ltd.
6.5.9 Shandong Fuwin New Material Co., Ltd.
6.5.10 Tianjin Danhai Co., Ltd.
6.5.11 Zibo Qixiang Tengda Chemical Co., Ltd (002408)
6.5.12 Tianjin GreenBio Materials Co., Ltd.
6.5.13 Shenzhen BrightChina Industrial Co., Ltd.
7. Summary and Forecast
7.1 Summary
7.2 Supply and Demand Forecast
7.3 Plastic Film Forecast
表:生物降解塑料(按原料)分类及用途
图:生物降解塑料行业产业链
图:2010-2013年全球生物降解塑料、生物基非降解塑料产能
图:2012年全球生物塑料(分品种)产能占比
图:2005-2013年全球生物降解塑料需求量及增长率
图:2013年全球生物降解塑料(分用途)需求量占比
图:2013年全球生物降解塑料(分品种)产能占比
图:2013年全球生物降解塑料(分地区)需求量占比
图:2013年全球生物降解塑料(分地区)产能占比
表:2008-2013年日本从事生物降解塑料应用开发的企业及其主要事件
表:2008-2014年生物降解塑料技术发展
图:2013年全球生物降解塑料主要企业产能
图:2009-2014年中国生物降解塑料产能及增长率
图:2005-2013年中国塑料薄膜产量及同比增长
图:2005-2013年中国农用薄膜产量及同比增长
表:2012年中国生物降解塑料在塑料薄膜与农用薄膜替代情况
图:2013年中国生物降解塑料主要企业产能(单位:千吨)
表:2006-2013年中国生物塑料行业相关政策
表:PSM塑料主要成分及来源
表:2010-2020全球淀粉基生物降解塑料主要企业产能分布
表:聚乳酸材料的性能和用途
表:2010-2020年全球PLA降解生物塑料主要企业产能
表:PHA在医药领域的主要应用
表:聚羟基烷酸脂材料进化史
表:2010-2020年全球PHA生物降解塑料主要企业产能
表:2010-2020年全球PBS降解塑料主要企业产能
表:2013年中国PPC主要生产企业
图:2013年巴斯夫(分业务)结构
图:2002-2013年巴斯夫销售收入及同比增长
图:2002-2013年巴斯夫净利润及同比增长
图:2012-2013年巴斯夫(分业务)销售收入
图:2012-2013年巴斯夫(分地区)销售收入
图:2013年巴斯夫(分地区)销售收入占比
图:2006-2013年巴斯夫毛利率及同比增长
图:2009-2013年巴斯夫研发支出
图:新增专利数量(单位:个)
图:2013年巴斯夫(分部门)研发支出占比
表:巴斯夫公司重点在建项目
表:Ecoflex与Ecovio的成分及用途
表:BASF公司performance polymers部门产品分类及其用途
图:2013年巴斯夫在中国生产、研发基地分布
表:2013年巴斯夫在中国的主要企业及地域分布
图:2007-2013年巴斯夫在中国销售收入及增长率
表:2011-2016年巴斯夫公司销售收入和净利润
表:2013年普拉克公司主要产品和业务领域
表:2013年普拉克公司生产工厂情况
图:2013年普拉克工厂及销售办事处分布
图:2008-2015年普拉克销售收入及EBIT
图:2013年普拉克(分行业)收入占比
图:2009-2012年普拉克资本支出及投资回报率
图:2011-2013年金发科技研发费用及占比
表:截止2013年6月鑫富药业控股子公司及其总资产、净利润
图:2006-2013年鑫富药业营业收入及同比增长
图:2006-2013年鑫富药业净利润及同比增长
图:2006-2013年鑫富药业(分产品)营业收入
图:2006-2013年鑫富药业(分产品)毛利率
图:2006-2012年鑫富药业前五名供应商合计采购金额及占比
图:2006-2013年鑫富药业前五名客户合计营业收入及占比
图:2011-2013年鑫富药业PBS产品营业收入及净利润
图:2008-2013年鑫富药业研发费用及占比
表:2011-2016年鑫富药业营业收入、净利润及增长率
图:2007-2011年武汉华丽环保营业收入及利润总额
图:2007-2008年安庆和兴化工营业收入及利润总额
图:2013年全球生物降解塑料(分地区)需求量、产量占比
表:2010-2020年全球及中国主要企业生物降解塑料产能对比
表:2010-2016年中国塑料薄膜、农业薄膜产量
Classification and Usage of Biodegradable Plastics (by Raw Materials)
Biodegradable Plastics Industry Chain
Capacity of Global Biodegradable Plastics and Non-biodegradable Plastics, 2010-2013
Global Bioplastic Capacity Structure by Variety, 2012
Global Biodegradable Plastic Demand and Growth Rate, 2005-2013
Global Biodegradable Plastic Demand Structure by Usage, 2013
Global Biodegradable Plastic Capacity Structure by Variety, 2013
Global Biodegradable Plastic Demand Structure by Region, 2013
Global Biodegradable Plastic Capacity Structure by Region, 2013
Major Events of Japanese Enterprises Engaged in Biodegradable Plastic Application Development, 2008-2013
Biodegradable Plastic Technology Development, 2008-2014
Capacity of Main Biodegradable Plastic Enterprises in the World, 2013
China’s Biodegradable Plastic Capacity and Growth Rate, 2009-2014
China’s Plastic Film Production and YoY Growth, 2005-2013
China’s Agricultural Film Production and YoY Growth, 2005-2013
Biodegradable Plastics Substitution for Plastic Film and Agricultural Film in China, 2012
Capacity of Main Biodegradable Plastics Enterprises in China, 2013
Policies of China’s Bioplastics Industry, 2006-2013
Main Constituents and Source of PSM
Capacity Distribution of PSM Companies in the World, 2010-2020
Properties and Applications of PLA
Capacity of Main PLA Companies in the World, 2010-2020
Main Application of PHA in Medicine
Evolution of PHA
Capacity of Main PHA Companies in the World, 2010-2020
Capacity of Main PBS Companies in the World, 2010-2020
Main PPC Companies in China, 2013
BASF’s Structure by Business, 2013
Sales and YoY Growth of BASF, 2002-2013
Net Income and YoY Growth of BASF, 2002-2013
Sales Breakdown of BASF by Business, 2012-2013
Sales Breakdown of BASF by Region, 2012-2013
Sales Structure of BASF by Region, 2013
Gross Margin and YoY Growth of BASF, 2006-2013
R&D Expenditures of BASF, 2009-2013
Number of New Patents
R&D Cost Structure of BASF by Department, 2013
BASF’s Key Projects under Construction
Constituents and Applications of Ecoflex and Ecovio
Product Categories and Applications of BASF’s Performance Polymers
Production and R&D Bases of BASF in China, 2013
Regional Distribution of BASF Companies in China, 2013
Sales and Growth Rate of BASF in China, 2007-2013
Sales and Net Income of BASF, 2011-2016
Main Products and Business Areas of PURAC, 2013
PURAC Production Plants, 2013
Distribution of PURAC Plants and Sales Offices, 2013
Sales and EBIT of PURAC, 2008-2015E
Sales Structure of PURAC by Sector, 2013
Capital Expenditure and Return on Investment of PURAC, 2009-2012
R&D Costs and % of Total Revenue of Kingfa, 2011-2013
Total Assets and Net Income of Xinfu Pharmaceutical-controlled Subsidiaries by Jun. 2013
Revenue and YoY Growth of Xinfu Pharmaceutical, 2006-2013
Net Income and YoY Growth of Xinfu Pharmaceutical, 2006-2013
Revenue Breakdown of Xinfu Pharmaceutical by Product, 2006-2013
Gross Margin of Xinfu Pharmaceutical by Product, 2006-2013
Xinfu Pharmaceutical’s Procurement from Top 5 Suppliers and % of Total Procurement, 2006-2012
Xinfu Pharmaceutical’s Revenue from Top 5 Clients and % of Total Revenue, 2006-2013
Revenue and Net Income of PBS Products of Xinfu Pharmaceutical, 2011-2013
R&D Costs and % of Total Revenue of Xinfu Pharmaceutical, 2008-2013
Revenue, Net Income and Growth Rate of Xinfu Pharmaceutical, 2011-2016E
Revenue and Total Profit of Wuhan Huali Environment Technology, 2007-2011
Revenue and Total Profit of Anqing Hexing Chemical, 2007-2008
Global Biodegradable Plastic Demand and Production Structure by Region, 2013
Biodegradable Plastic Capacity Comparison between Domestic and Foreign Enterprises, 2010-2020
China’s Production of Plastic Film and Agricultural Film, 2010-2016E
如果这份报告不能满足您的要求,我们还可以为您定制报告,请 留言说明您的详细需求。
|