|
|
|
报告导航:研究报告—
制造业—能源矿产
|
|
2013-2016年全球及中国锆行业研究报告 |
 |
字数:2.2万 |
页数:50 |
图表数:50 |
|
中文电子版:4500元 |
中文纸版:2250元 |
中文(电子+纸)版:5000元 |
|
英文电子版:1300美元 |
英文纸版:1400美元 |
英文(电子+纸)版:1600美元 |
|
编号:YDN001
|
发布日期:2014-03 |
附件:下载 |
 |
|
|
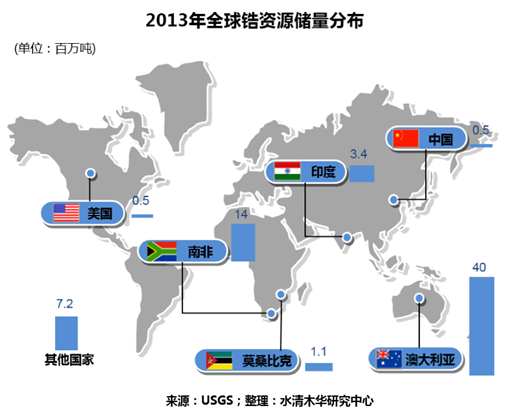
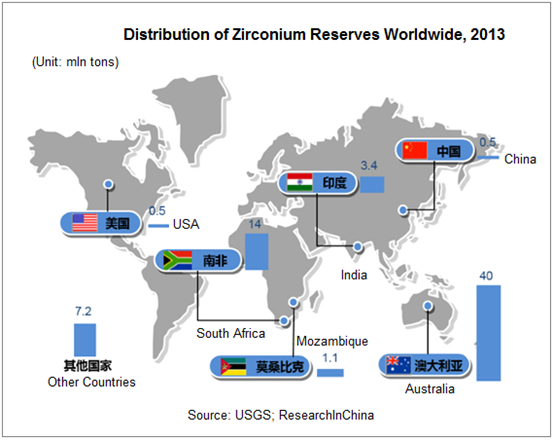
全球锆矿资源分布高度集中。锆矿储量主要掌握在澳大利亚和南非手中,2013年这两国占据全球80.96%的锆矿资源。2013年,中国锆矿资源总储量50万吨,占全球储量不到1%,主要分布在海南、广东、广西等东南沿海省份及西南的四川、云南。近年来,中国正陆续在莫桑比克、印尼等国启动境外锆钛矿开采项目。
锆主要用于陶瓷、化学品、铸造、CRT电视玻壳等领域,2013年中国陶瓷用锆需求占比达54%,化学锆及铸造用锆需求占比也较高,合计达28%。化学锆广泛应用于化工、纺织、造纸、化妆品、电子等领域,而中国作为全球制造业中心,上述领域的快速发展促进了对化学锆的需求。
中国是全球初级锆产品最大的加工地,2013年全球90%的氯氧化锆和硅酸锆在中国生产加工。其中85%以上出口至美国、日本以及欧洲,用于陶瓷、二氧化锆制品和核级海绵锆的生产。
中国生产锆制品的企业较多,竞争力较强的企业主要有东方锆业、亚洲锆业、升华拜克、晶安高科等公司。
2013年,东方锆业锆产品总产能超过7万吨,其中硅酸锆18000吨,氯氧化锆35000吨,二氧化锆7000吨,氧化锆结构陶瓷年产值超过1亿元,是中国锆行业中最具核心竞争力企业之一。升华拜克控股子公司浙江锆谷科技2013年锆系列产品产能也已超过3万吨,90%产品已打入海外市场。
水清木华研究中心《2013-2015年全球及中国锆行业研究报告》着重研究了以下内容:
 全球锆行业发展概况,包括储量、产量分析及主要供应商情况等; 全球锆行业发展概况,包括储量、产量分析及主要供应商情况等;
中国锆行业发展概况,包括储量、产量状况及竞争格局分析等;
中国锆行业发展环境,包括中国锆行业政策法规及进出口状况分析等;
中国锆行业细分产品市场情况,包括传统锆制品、金属锆制品及新型锆制品市场分析等;
中国11家重点锆产品企业(包括东方锆业、亚洲锆业、升华拜克、晶安高科、华神钛业、锦州金属、广通化工、神州锆业、敖汉华钛、上海高泰、国核锆业)经营情况及锆业务分析。
Zirconium resources are highly concentrated across the globe. A overwhelming majority of zirconium ore reserves are in the hands of Austrilia and South Africa which made up 80.96% of the global total in 2013. In 2013, the gross reserves of zirconium ore resources in China hit 500,000 tons, standing at less than 1% of the world’s total, largely spreading in Southeasten coastal regions like Hainan, Guangdong and Guangxi as well as Southwesten regions such as Sichuan and Yunnan. In recent years, China has made continuous efforts in launching uhligite exploitation projects in overseas countries such as Mozambique and Indonesia progressively.
Zirconium is widely applied in such fields as ceramics, chemicals, casting and CRT TV kinescope glass. In 2013, the demand for zirconium for ceramics use accounted for 54%, while the demand for chemicals and casting use made up 28% all together. Zirconium chemicals find wide application in chemical engineering, textile, papermaking, cosmetics and electronics industries. China, as a manufacturing hub in the world, is fueld by the robust development of aforementioned sectors.
China boasts the world’s largest processing base of primary zirconium. In 2013, 90% zirconium oxychloride and zirconium silicate in the world were produced and processed in China, of which, above 85% were exported to the United States, Japan and Europe for the production of ceramics, zirconium dioxide products and nuclear-grade zirconium sponge.
There are a host of zirconium products enterprises in China, with the most competitive including Guangdong Orient Zirconic Ind Sci & Tech Co., Ltd.,Asia Zirconium Limited, Zhejiang Shenghua Biok Biology, JIANGXI KINGAN HI-TECH.CO, LTD.
In 2013, the total zirconium product capacity of Guangdong Orient Zirconic Ind Sci & Tech Co., Ltd., surpassed 70,000 tons, involving 18,000 tons of zirconium silicate, 35,000 tons of zirconium oxychloride, and 7,000 tons of zirconium dioxide. And the annual output value of Zirconia structural ceramics outnumbered RMB100 million. All this made the company become one among the industrial players with strongest core competitiveness. In the same year, Zhejiang Zr-Valley Science & Technology Co Ltd, a holding subsidary under Zhejiang Shenghua Biok Biology, realized the capaicty of 30,000 tons-plus zirconium series products, of which, 90% were marketed in the overseas market.
The report sheds light on the followings:
Development of global zirconium industry, including analysis on reserves and output and main suppliers;
Development of China zirconium industry, including reserves, output and competition pattern;
Developmlent environment of China zirconium industry, including laws and regulations, import and export, etc.;
Segmented product markets of China zirconium industry, including analysis on traditional zirconium products market, metal zirconium products and emerging zirconium product market;
Operation, zirconium business of 11 leading zirconium products enterprises in China, including Guangdong Orient Zirconic Ind Sci & Tech Co., Ltd., Asia Zirconium Limited, Zhejiang Shenghua Biok Biology, JIANGXI KINGAN HI-TECH.CO, LTD., Huashen Titanium Industry, Jinzhou Metal, Zibo Guangtong Chemical Co.,Ltd., Shandong Shenzhou Zirconium Industry, Aohan China Titanium Industry, Shanghai Gaotai, and State Nuclear Baoti Zirconium Industry.
第一章 锆行业概述
1.1 锆金属特点
1.2 锆制品应用
1.3 锆产业链
第二章 全球锆行业发展概况
2.1 供应分析
2.1.1储量分布
2.1.2产量分布
2.2消费分析
2.3全球主要锆英砂供应商
第三章 中国锆行业发展概况
3.1 供应分析
3.1.1储量分布
3.1.2产量分析
3.2需求分析
3.2.1陶瓷行业
3.2.2化学锆行业
3.2.3 耐火材料
3.3消费分析
3.3.1消费结构
3.3.2锆英砂价格
3.4竞争格局
3.5 中国锆行业管理体制
3.6中国锆行业主要政策法规
3.7中国锆行业发展趋势
第四章 中国锆行业细分产品市场发展
4.1 传统锆制品
4.1.1 硅酸锆
4.1.2 氯氧化锆
4.1.3 二氧化锆
4.2 金属锆制品
4.3 新兴锆制品
4.3.1复合氧化锆
4.3.2纳米复合氧化锆
第五章 中国锆产品进出口状况
5.1 进口状况
5.2 出口状况
第六章 中国重点锆产品企业分析
6.1 广东东方锆业科技有限公司
6.1.1 公司简介
6.1.2 公司经营情况
6.1.3 收入构成
6.1.4 毛利率
6.1.5 锆业务分析
6.1.6 经营前景预测
6.2 中国龙新能源控股有限公司
6.2.1 公司简介
6.2.2 公司经营情况
6.2.3收入构成
6.3 浙江升华拜克生物股份有限公司
6.3.1 公司简介
6.3.2 公司经营情况
6.3.3收入构成
6.3.4毛利率
6.3.5锆业务分析
6.3.6经营前景预测
6.4 江西晶安高科技股份有限公司
6.4.1 公司简介
6.4.2 公司经营情况
6.4.3 公司投资情况
6.5 华神钛业
6.5.1 公司简介
6.5.2 公司经营情况
6.6 锦州金属
6.6.1 公司简介
6.6.2 公司经营情况
6.7 广通化工
6.7.1 公司简介
6.7.2 公司经营情况
6.8 神州锆业
6.8.1 公司简介
6.8.2 公司经营情况
6.9 敖汉华钛
6.9.1 公司简介
6.9.2 公司经营情况
6.10 其他企业
6.10.1 上海高泰
6.10.2 国核锆业
第七章 结论与预测
7.1 结论
7.2预测
1. Overview of the Zirconium Industry
1.1 Properties of Zirconium Metal
1.2 Application of Zirconium Products
1.3 Zirconium Industry Chain
2. Development of Global Zirconium Industry
2.1 Supply
2.1.1 Distribution of Reserves
2.1.2 Distribution of Output
2.2 Consumption
2.3 Main Zircon Sand Suppliers Worldwide
3. Development of China Zirconium Industry
3.1 Supply
3.1.1 Distribution of Reserves
3.1.2 Distribution of Output
3.2 Demand
3.2.1 Ceramic Industry
3.2.2 Zirconium Chemical Industry
3.2.3 Refractory Materials
3.3 Consumption
3.3.1 Consumption Structure
3.3.2 Price of Zircon Sand
3.4 Competition Pattern
3.5 Management System of China Zirconium Industry
3.6 Main Laws and Regulations on China Zirconium Industry
3.7 Development Trend of China Zirconium Industry
4. Development of Segmented Products in China Zirconium Industry
4.1 Traditional Zirconium Products
4.1.1 Zirconium Silicate
4.1.2 Zirconium Oxychloride
4.1.3 Zirconium Dioxide
4.2 Metal Zirconium Products
4.3 New Zirconium Products
4.3.1 Composite Zirconia
4.3.2 Nano-composite Zirconia
5. Import & Export of Zirconium Products in China
5.1 Import
5.2 Export
5. Key Chinese Zirconium Product Enterprises
6.1 Guangdong Orient Zirconic Ind Sci & Tech Co., Ltd.
6.1.1 Profile
6.1.2 Operation
6.1.3 Revenue Structure
6.1.4 Gross Margin
6.1.5 Zirconium Business
6.1.6 Business Prospects
6.2 Sino Dragon New Energy Holdings Limited
6.2.1 Profile
6.2.2 Operation
6.2.3 Revenue Structure
6.3 Zhejiang Shenghua Biok Biology
6.3.1 Profile
6.3.2 Operation
6.3.3 Revenue Structure
6.3.4 Gross Margin
6.3.5 Zirconium Business
6.3.6 Business Prospects
6.4 JIANGXI KINGAN HI-TECH.CO, LTD.
6.4.1 Profile
6.4.2 Operation
6.4.3 Investment
6.5 Huashen Titanium Industry
6.5.1 Profile
6.5.2 Operation
6.6 Jinzhou Metal
6.6.1 Profile
6.6.2 Operation
6.7 Zibo Guangtong Chemical Co.,Ltd.
6.7.1 Profile
6.7.2 Operation
6.8 Shandong Shenzhou Zirconium Industry
6.8.1 Profile
6.8.2 Operation
6.9 Aohan China Titanium Industry
6.9.1 Profile
6.9.2 Operation
6.10 Other Enterprises
6.10.1 Shanghai Gaotai
6.10.2 State Nuclear Baoti Zirconium Industry
7. Conclusion and Forecast
7.1 Conclusion
7.2 Forecast
表:锆制品主要应用领域
图:锆产业链流程图
表:2013年全球锆资源储量分布
表:2013年全球锆英砂产量分布
图:2013年全球锆英砂(分地区)消费结构
图:2013年中国锆英砂(分地区)消费结构
表:2013年全球主要锆英砂供应商
表:2008年-2013年ILUKA公司锆英砂产销量
图:2008-2013年中国锆英砂产量
图:2012年中国锆英砂需求结构
图:2008-2013年中国瓷砖产量
图:2008-2013年中国卫生洁具产量
图:2011-2013年澳大利亚锆英砂价格
图:2013年海南锆英砂月均价
表:中国主要锆制品企业
表:中国锆行业发展主要相关产业政策
图:2013年中国硅酸锆产能分布
图:2012-2013年中国硅酸锆(含税)价格
表:2010-2013年中国硅酸锆销量
表:2013年中国主要氯氧化锆企业产能
图:2008-2013年中国氯氧化锆出口量
图:2008-2013年中国二氧化锆出口量
表:2013年中国主要二氧化锆企业产能
图:2008-2013年中国金属锆产量
表:2013年中国主要企业现有核级海绵锆产能规划
图:2000-2016年中国核级海绵锆需求及预测
表:2013年全球纳米复合氧化锆主要企业产能
图:2006-2013年中国锆英砂进口量
图:2013年中国锆英砂(分国别)进口占比量
图:2008-2013年中国锆化学品出口量
图:2008-2013年中国金属锆及其制品出口量
表:2013年东方锆业主要锆产品产能
图:2008-2013年东方锆业营业收入及净利润
表:2010-2013年东方锆业(分产品)营业收入
表:2010-2013年东方锆业(分地区)营业收入
表:2010-2013年东方锆业(分产品)毛利率
表:2013年东方锆业各子公司营业收入与净利润
表:2012-2016年东方锆业营业收入及净利润
图:2008-2013年亚洲锆业营业收入及净利润
表:2010-2013年亚洲锆业分部门收入
图:2008-2013年升华拜克营业收入及净利润
表:2010-2013年升华拜克(分产品)营业收入
表:2010-2013年升华拜克(分产品)毛利率
图:锆谷科技2010-2013年营业收入与净利润
表:2013年晶安高科主要锆产品产能
图:2007-2013年晶安高科工业总产值
图:2009-2013年华神钛业营业收入及营业利润
图:2008-2013年广通化工营业收入
图:2013中国主要锆制品企业营业收入及同比增长
图:2010-2016年全球及中国锆英砂产量
Main Application of Zirconium Products
Flow Chart of Zirconium Industry Chain
Reserve Distribution of Zirconium Resources Worldwide, 2013
Output Distribution of Zircon Sand Worldwide, 2013
Consumption Structure of Zircon Sand Worldwide by Region, 2013
Main Zircon Sand Suppliers Worldwide, 2013
Output and Sales Volume of Zircon Sand of ILUKA, 2008-2013
Output of Zircon Sand in China, 2008-2013
Demand Structure of Zircon Sand in China, 2012
Ceramic Tile Output in China, 2008-2013
Sanitary Ware Output in China, 2008-2013
Price of Zircon Sand in Australia, 2011-2013
Average Monthly Price of Zircon Sand in Hainan, 2013
Leading Zirconium Product Enterprises in China
Major Policies about the Development of China Zirconium Industry
Capacity Distribution of Zirconium Silicate in China, 2013
Zirconium Silicate Prices (Tax Inclusive) in China, 2012-2013
Zirconium Silicate Sales Volume in China, 2010-2013
Capacities of Main Zirconium Oxychloride Enterprises in China, 2013
Export Volume of Zirconium Oxychloride in China, 2008-2013
Export Volume of Zirconium Dioxide in China, 2008-2013
Capacities of Main Zirconium Dioxide Enterprises in China, 2013
Metal Zirconium Output in China, 2008-2013
Available Nuclear-Grade Zirconium Sponge Capacity Planning of Major Enterprises in China, 2013
Demand for Nuclear-Grade Zirconium Sponge in China, 2000-2016E
Capacities of Main Nano-Composite Zirconia Enterprises Worldwide, 2013
Zircon Sand Import Volume in China, 2006-2013
Imports % of Zircon Sand (by Countries) in China, 2013
Export Volume of Zirconium Chemicals in China, 2008-2013
Export Volume of Metal Zirconium and Metal Zirconium Products in China, 2008-2013
Capacities of Main Zirconium Products of Guangdong Orient Zirconic Ind Sci & Tech Co., Ltd., 2013
Revenue and Net Income of Guangdong Orient Zirconic Ind Sci & Tech Co., Ltd., 2008-2013
Revenue of Guangdong Orient Zirconic Ind Sci & Tech Co., Ltd. by Product, 2010-2013
Revenue of Guangdong Orient Zirconic Ind Sci & Tech Co., Ltd. by Region, 2010-2013
Gross Margin of Guangdong Orient Zirconic Ind Sci & Tech Co., Ltd. by Product, 2010-2013
Revenue and Net Income of Subsidiaries under Guangdong Orient Zirconic Ind Sci & Tech Co., Ltd., 2013
Revenue and Net Income of Guangdong Orient Zirconic Ind Sci & Tech Co., Ltd., 2012-2016E
Revenue and Net Income of Asia Zirconium Limited, 2008-2013
Revenue of Asia Zirconium Limited by Business Division, 2010-2013
Revenue and Net Income of Zhejiang Shenghua Biok Biology, 2008-2013
Revenue of Zhejiang Shenghua Biok Biology by Product, 2010-2013
Gross Margin of Zhejiang Shenghua Biok Biology by Product, 2010-2013
Revenue and Net Income of Zhejiang Zr-Valley Science & Technology Co Ltd, 2010-2013
Capacities of Main Zirconium Products of JIANGXI KINGAN HI-TECH.CO, LTD., 2013
Gross Industrial Output Value of JIANGXI KINGAN HI-TECH.CO, LTD., 2007-2013
Revenue and Operating Income of Huashen Titanium Industry, 2009-2013
Revenue of Zibo Guangtong Chemical Co.,Ltd., 2008-2013
Revenue and YoY Growth Rate of Main Zirconium Products Enterprises in China, 2013
Zircon Sand Output in China and the World, 2010-2016E
如果这份报告不能满足您的要求,我们还可以为您定制报告,请 留言说明您的详细需求。
|