|
|
|
报告导航:研究报告—
TMT产业—电子半导体
|
|
2013-2014年全球及中国触摸(触控)屏行业研究报告 |
 |
字数:3.5万 |
页数:150 |
图表数:172 |
|
中文电子版:9000元 |
中文纸版:4500元 |
中文(电子+纸)版:9500元 |
|
英文电子版:2500美元 |
英文纸版:2700美元 |
英文(电子+纸)版:2800美元 |
|
编号:ZYW168
|
发布日期:2014-03 |
附件:下载 |
 |
|
|
《2013-2014年全球及中国触摸(触控)屏行业研究报告》包含以下内容:
1、触摸(触控)屏简介
2、大中小三种尺寸触摸(触控)屏技术趋势
3、Metal Mesh与AgNW现状与趋势
4、触摸(触控)屏市场分析
5、ITO Film市场分析
6、9家中小显示屏厂家研究
7、19家触摸(触控)屏厂家研究
2013年的触摸屏市场特点是:价格战激烈,触摸屏笔记本电脑需求严重低于预期。
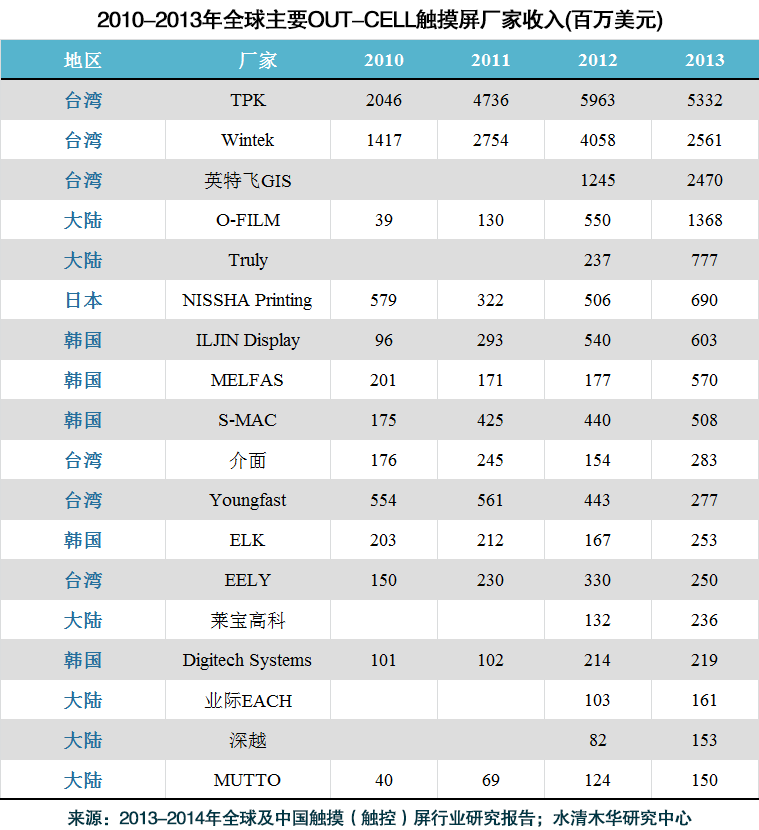
GFF领域,很多厂家特别是中国大陆厂家在2012年全力扩产,2013年不得不靠价格战拉拢客户。价格战致使部分厂家收入大幅度下滑,赢得价格战的厂家也付出沉重代价,触摸屏高利润时代一去不返。大陆厂家欧菲光顺利夺得GFF霸主地位,毛利率下滑大约4%。另一家韩国企业MELFAS在2013年收入同比大增322%,而营业利润率从8.6%直线下滑到0.04%。MELFAS明确表示在2014年退出某些低利润领域,预计收入将大幅度下滑。
因为触摸屏笔记本电脑需求严重低于预期,使得压注笔记本电脑触摸屏的厂家叫苦不迭。最典型的是TPK,因为需求不足,为了节省成本和费用,F-TPK转投资Cando于2013年11月4日宣布新竹厂3.5代线及4.5代线全面停产。紧接着在11月下旬,F-TPK位于厦门的威鸿光学也停止生产。
技术方面,GFF依靠低廉价格占据了主流市场,但OGS成长迅速,侵蚀GFF的市场。信利是其中的典型代表,2013年其收入同比大增了328%,信利最核心的产品就是OGS,占领了国产手机高端市场。
新技术方面,Metal Mesh的优点包括:
 超低阻抗,支持其最大可以做到24英寸触摸屏 超低阻抗,支持其最大可以做到24英寸触摸屏
有竞争力的价格,比ITO Film的价格要低不少
可以折叠弯曲,尤其适合智能穿戴产品,例如iwatch
支持超窄边框设计(Super Narrow Border)
对于13.3英寸笔记本电脑来说,Metal Mesh可以将边框控制在4毫米以下,15英寸笔记本电脑控制在5毫米以下。Metal Mesh缺点一是产业链上游被Fujifilm和三菱少数厂家掌控,其次是需要重新添置设备,初期成本较高。洋华Youngfast、欧菲光和J-Touch三家倾向于Metal Mesh ,J-Touch目前进展最快,主要目标锁定中尺寸和大尺寸领域。
纳米银线(AgNW)最大的优势在于无需购买新设备,只要对Touch Sensor生产设备进行小范围改造即可。但是其阻抗高,目前还不适合中尺寸领域,透光度也稍差。在对品质要求不高的小尺寸领域非常适合,据传TPK的纳米银已经拿到苹果iwatch 的触控屏订单。
苹果手机触控屏iPhone5后都采用IN-CELL设计,iPhone6也是如此,因为GFF性能满足不了苹果的要求,而OGS屏幕强度不足,也无法满足苹果的要求。而TOL虽然能满足苹果的要求,但是TPK产能不足,月产能仅200万片,而TPK不大可能为了苹果扩产。因为TPK已经因为过分依赖苹果订单而造成业绩下滑,TPK的目标是尽量减少对单一大客户尤其是对苹果的依赖。
苹果在iPhone6上极有可能延续IN-CELL设计,但也会稍稍改变,这就是Hybrid In-cell/On-cell。目前JDI的该技术已经很成熟,此等设计最大好处是可以利用原来的IN-CELL生产线,足以满足苹果庞大的产能需求,其次是更高信噪比( SNR)、更高的面板生产良率(Panel Yield Rates)和可做在更大尺寸的机种上 。这种做法的缺点是专利由JDI和Snaptics掌握,苹果需要购买其专利,并将其专利转让给夏普、LG DISPLAY。
针对Windows 8 Modern UI触控界面做优化设计的软件很少,用户能够感受触控的地方大多只有Windows开机时的方块砖初始画面、相片/影像放大缩小等作业,最常用的MS Office、浏览器等软件还是都不太需要触控,让买了Touch NB的消费者无用武之地。当触控的好用处越少、消费者愿意付出的价差也越小、Touch NB市场就越小。
而触控笔记本电脑或者说超极本(Ultrabook)与非触控笔记本电脑的成本差不是靠缩小触控屏本身的成本来能实现的。触控屏的成本已经和2013年比下降了一半还多,但是超极本所需要的固态硬盘SSD、锂聚合物电池LIPOLY、超薄机壳(Casing)、超薄主板(Motherboard)价格丝毫未降。超极本与普通笔记本电脑之间的价格差异还是很大。消费者依然远离超极本。
Global and China Touch Screen (Panel) Industry Report, 2013-2014 covers the followings:
1. Brief Introduction to Touch Screen (Panel)???
2. Technological Trends of Small, Medium and Large-sized Touch Screen (Panel)
3. Status Quo and Trends of Metal Mesh and AgNW
4. Touch Screen (Panel) Market
5. ITO Film Market
6. 9 Small and Medium-sized Display Companies
7. 19 Touch Screen (Panel) Companies
?
In 2013, the touch screen market was featured with fierce price war and far lower demand for touch screen laptops than expected.
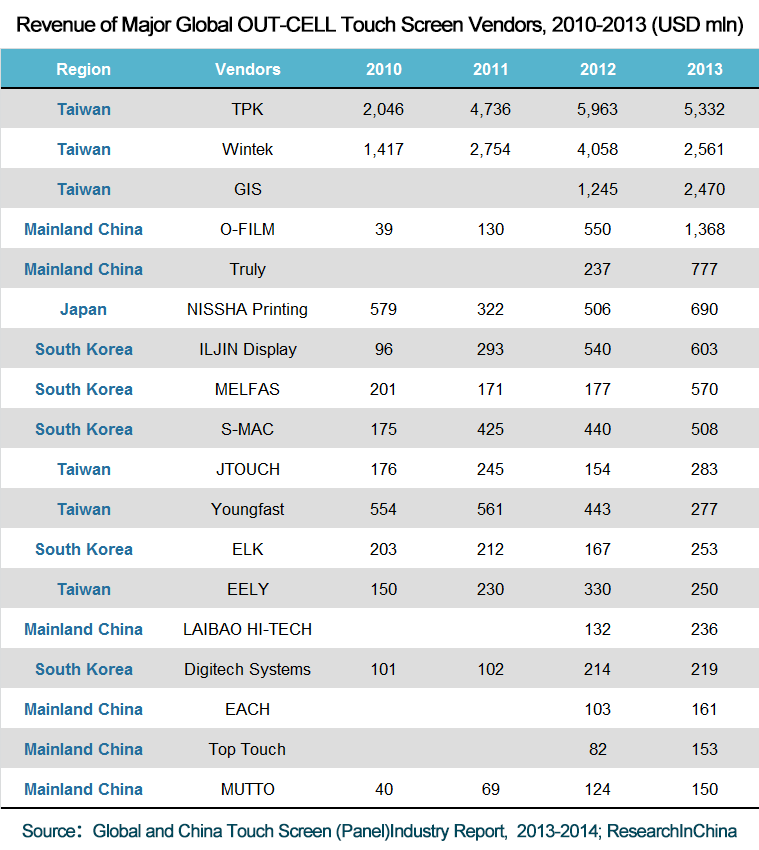
In the GFF field, many vendors, especially the ones in Mainland China, conducted expansion aggressively in 2012, but had to trigger a price war to seize customers in 2013. As a result, some vendors witnessed a significant decline in revenue, even the winners also paid a heavy price. The high-profit era of touch screens was gone for ever. The Mainland Chinese vendor SHENZHEN O-FILM TECH won the crown of laurels in the GFF field, but its gross margin fell by about 4%. The revenue of South Korean company MELFAS violently surged by 322% year on year, while its operating margin plummeted from 8.6% to 0.04% in 2013. MELFAS has expressly claimed its exit from some low-margin areas in 2014, which means that its revenue is expected to drop sharply.
The vendors who focused on laptop touch screens felt frustrated because the demand for touch screen laptops was severely lower than expected. TPK is the most typical example. Owing to the insufficient demand, F-TPK turned to invest in Cando in order to save costs and expenses; on November 4, 2013, it announced the halt of Hsinchu Plant’s 3.5-generation line and 4.5-generation line; in late November, F-TPK also stopped the production of its subsidiary G&P Optical Solutions(Xiamen) Inc.
As for the technical aspect, GFF occupies the mainstream market by virtue of low prices, but threatened by the fast-growing OGS. Truly's revenue soared by 328% year on year in 2013 with the core product -- OGS, so that the company dominated the domestic high-end mobile phone market.
Metal Mesh has the merits below:
20120114.gif? Ultra low impedance, support for the touch screen with the maximum size of 24 inches.
20120114.gif? Competitive price, much lower than the ITO Film price
20120114.gif? Foldable and bendable, especially suitable for smart wearable products like iwatch
20120114.gif? Support ultra-narrow border design
For 13.3-inch laptops, Metal Mesh can control the border at 4 mm or less; for 15-inch laptops, it can do the border at 5 mm or less.
The upstream metal mesh industry chain is grasped by minority vendors including Fujifilm and Mitsubishi; moreover, it requires new equipment, so the initial cost is quite high. YOUNG FAST, SHENZHEN O-FILM TECH and J-Touch prefer Metal Mesh, and J-Touch targeting medium and large-sized fields makes the quickest progress.
The biggest advantage of AgNW lies in the small-scale transformation of touch sensor production equipment instead of buying new equipment. However, due to its high resistance and poor light transmission, it is not appropriate for the medium-sized field for the time being, but very suitable for the small-sized field which has lower requirements on quality. It is reported that TPK’s SNW has got the order from Apple iwatch for touch screens.
Apple adopts the IN-CELL design for iPhone5 and iPhone6 because of the unsatisfying GFF’s performance and OGS’ screen intensity. TOL meets Apple's requirements, but TPK's TOL monthly capacity is only 2 million and TPK is unlikely to implement expansion simply for Apple, as TPK’s over-reliance on Apple has caused declining performance. TPK's goal is to minimize the dependence on a single client, especially Apple.
As for iPhone6, Apple may still make advantage of IN-CELL or Hybrid In-cell/On-cell. Currently, JDI has performed maturely in Hybrid In-cell/On-cell, which can be accomplished through the original IN-CELL production lines to meet Apple’s huge demand with higher signal-to-noise ratio (SNR) and panel yield. Besides, such technology is fit for large-sized cell phones. However, only JDI and Snaptics master the patent of the technology, so Apple needs to buy the patent from them and then transfer it to Sharp and LG DISPLAY.
Few softwares make optimal design for Windows 8 Modern UI touch, and users can see the touch function mostly from Windows boot screen and photo / video zoom, while the most commonly used MS Office, browsers and other softwares do not need touch function. Therefore, touch laptop buyers feel sort of disappointed. The less useful the touch function becomes, the less consumers will pay, and the smaller the touch laptop market will be.
The cost difference between touch laptops (or Ultrabooks) and non-touch laptops does not rest with reduced costs of touch screens. Touch screen costs have dropped by over 50% over 2013, but the prices of solid state disk (SSD), lithium polymer batteries, thin casings and motherboards applied to Ultrabooks remain unchanged. Ultrabooks are still more expensive than ordinary laptops, so consumers prefer the latter.
第一章、触控屏简介
1.1、触控屏发展历程
1.2、GLASS-TO-GLASS (G/G)
1.3、GLASS-TO-FILM-TO-FILM (G/F/F)
1.4、G1F
1.5、TOC
1.6、ON-CELL
1.7、IN-CELL
1.8、手机触控屏技术发展趋势
1.9、中尺寸触控屏发展趋势
1.10、笔记本电脑触控屏发展趋势
1.11、AIO PC触控屏
1.12、METAL MESH 优势
1.13、METAL MESH供应链
1.14、SILVER NANOFIBERSWIRES纳米银线
第二章、触控屏下游市场
2.1、触控屏市场规模
2.2、笔记本电脑市场
2.3、平板电脑市场
2.4、手机市场
2.4.1、全球手机市场规模The Market Size of Global Mobile Phone
2.4.2、智能手机市场与产业The Smartphone Market and Industry
2.4.3、中国手机市场与产业概况
第三章、触控屏产业
3.1、触控屏产业链
3.2、ITO FILM市场规模
3.3、ITO FILM供应链
3.4、ITO FILM行业分析
3.5、触控屏厂家排名
3.6、触控屏厂家与客户配套关系
第四章、中小显示屏厂家研究
4.1、LTPS与IGZO 市场
4.2、JAPAN DISPLAY
4.3、天马微电子
4.4、信利国际
4.5、彩晶
4.6、华映
4.7、友达
4.8、群创光电
4.8.1、英特飞GIS
4.9、LG DISPLAY
4.10、SMD
第五章、触控屏厂家研究
5.1、胜华
5.2、洋华
5.3、介面
5.4、S-MAC
5.5、ILJIN DISPLAY
5.6、MELFAS
5.7、ELK
5.8、DIGITECH SYSTEMS
5.9、和鑫光电(SINTEK PHOTRONIC)
5.10、达鸿科技(CANDO)
5.11、NISSHA PRINTING
5.12、TPK (宸鸿光电科技)
5.13、中华意力(EELY)
5.14、牧东光电(MUTTO OPTRONICS)
5.15、莱宝高科(LAIBAO HI-TECH)
5.16、欧菲光 SHENZHEN O-FILM TECH
5.17、业际光电
5.18、深越光电
5.19、骏达
1. Introduction to Touch Screen
1.1 Development Course
1.2 GLASS-TO-GLASS (G/G)
1.3 GLASS-TO-FILM-TO-FILM (G/F/F)
1.4 G1F
1.5 TOC
1.6 ON-CELL
1.7 IN-CELL
1.8 Development Trend of Mobile Phone Touch Screen Technology
1.9 Development Trend of Medium-sized Touch Screen
1.10 Development Trend of Laptop Touch Screen
1.11 AIO PC Touch Screen
1.12 Advantages of METAL MESH
1.13 METAL MESH Supply Chain
1.14 Silver Nanofibers Wires
2 Touch Screen Downstream Market
2.1 Touch Screen Market Size
2.2 Laptop Market
2.3 Tablet PC Market
2.4 Mobile Phone Market
2.4.1 Global Mobile Phone Market Size
2.4.2 Smart Phone Market and Industry
2.4.3 Chinese Mobile Phone Market and Industry
3 Touch Screen Industry
3.1 Touch Screen Industry Chain
3.2 ITO FILM Market Size
3.3 ITO FILM Supply Chain
3.4 ITO FILM Industry
3.5 Ranking of Touch Screen Vendors
3.6 Relationship between Touch Screen Vendors and Clients
4. Small and Medium-sized Display Companies
4.1 LTPS and IGZO Market
4.2 JAPAN DISPLAY
4.3 TIANMA
4.4 TRULY
4.5 HANNSTAR
4.6 CPT
4.7 AUO
4.8 INNOLUX
4.8.1 GIS
4.9 LG DISPLAY
4.10 SMD
5 Touch Screen Vendors
5.1 WINTEK
5.2 YOUNG FAST
5.3 JTOUCH
5.4 S-MAC
5.5 ILJIN DISPLAY
5.6 MELFAS
5.7 ELK
5.8 DIGITECH SYSTEMS
5.9 SINTEK PHOTRONIC
5.10 CANDO
5.11 NISSHA PRINTING
5.12 TPK
5.13 EELY
5.14 MUTTO OPTRONICS
5.15 LAIBAO HI-TECH (LAIBAO HI-TECH)
5.16 SHENZHEN O-FILM TECH
5.17 EACH
5.18 Top Touch
5.19 Junda
Glass-to-glass (G/G)型投射式电容触控屏
Glass-to-film-to-film (G/F/F)投射式电容触控屏
G1F触控
TOC触控屏
Sheet型TOC
Piece型TOC
2011-2016年手机触控屏技术分布
2011-2015年中尺寸触控屏技术分布
2012-2016年笔记本电脑触控屏出货量技术分布
2012-2016年AIO PC触控屏出货量技术分布
纳米银Silver NanofibersWires供应链
2010-2016年全球触控屏市场规模(金额)
2010-2016年全球触控屏市场规模(出货量)
2010-2015年全球触控屏市场出货量下游分布
2008-2015年笔记本电脑出货量
2010-2013年全球主要笔记本电脑ODM厂家出货量
2011-2016年全球平板电脑出货量
2013年平板电脑主要品牌市场占有率
2012、2013年全球平板电脑制造厂家产量
2011年1季度-2013年4季度全球手机出货量
2007-2014年全球手机出货量
2011-2014年全球3G/4G手机出货量地域分布
2013年2季度智能手机操作系统出货量和市场占有率
2013年2季度主要安卓手机厂商出货量和市场占有率
2013年2季度主要Windows Phone 智能手机厂商出货量和市场占有率
2011-2013中国主要厂家智能手机出货量
2013年2-12月中国手机月度产量
2013年1-12月中国手机月度出口额
2013年2-12月中国手机行业月度收入与利润
2013年中国手机市场主要厂家市场占有率
2013年1-11月中国手机产量地域分布
触控屏产业链
触控屏生产工艺流程
2012-2017年触控屏材料市场规模
2011-2016年ITO FILM市场出货量
2011-2016年ITO FILM市场规模
ITO Film结构
ITO Film供应链
ITO Film主要厂家性能对比
2013年全球主要ITO FILM厂家市场占有率
2010-2013年全球主要OUT-CELL触摸屏厂家收入
2012-2013年全球主要OUT-CELL触摸屏厂家营业利润率
2010-2013主要触控屏厂家出货量
三星2012-2013年手机触控屏供应商市场占有率
三星2012-2013年TabletPC触控屏供应商市场占有率
2012年诺基亚触控屏主要供应厂家所占比例
2012年LG触控屏主要供应厂家所占比例
2012年HTC触控屏主要供应厂家所占比例
2013年1季度-2014年4季度LTPS手机 面板出货量
2013、2014年全球LTPS生产线产能一览
2013-2015年全球LTPS厂家产能一览
2005-2013年深圳天马微电子收入与运营利润率
2012-2013年天马微电子各子公司财务数据
2005-2013年信利国际收入与运营利润率
2006-2011年信利国际LCD业务收入技术分布
2012-2013年信利半导体收入业务分布
信利手机LCD主要客户
信利汽车显示器主要客户
信利触摸屏产能
信利CCM主要客户
彩晶组织结构
2006-2014年彩晶收入与运营利润率
2012年3季度-2013年4季度彩晶季度收入、毛利率与营业利润率
2012年3季度-2013年4季度彩晶季度出货量
2012年3季度-2013年4季度彩晶季度收入尺寸分布
彩晶基地分布
2004-2014年华映收入与运营利润率
2013年1月-2014年2月华映月度收入、出货量
2004-2013年友达收入与运营利润率
2012年1月-2014年1月友达月度收入与增幅
2011年1季度-2013年4季度友达收入下游应用分布
2011年1季度-2013年4季度友达中小尺寸出货量与收入
2011年1季度-2013年4季度友达收入尺寸分布
友达2012年1季度各生产线产能
友达2012年4季度-2014年1季度产能变化
2007-2013年群创光电收入与运营利润率
2012年1季度-2013年4季度群创光电收入与毛利率
2012年1季度-2013年4季度群创光电
2012年1季度-2013年4季度群创光电
2012年1季度-2013年4季度群创光电
2012年1季度-2013年4季度群创光电收入下游应用分布
2011、2012年群创光电收入应用分布
2012年1季度-2013年4季度群创光电收入尺寸分布
2012年1季度-2013年4季度群创光电中小尺寸收入与出货量
2011年1季度-2012年4季度群创光电触摸屏出货量
2012年1季度群创光电各生产线产能
2013年4季度群创光电各生产线产能
2012年1季度群创光电Touch Sensor产能
2013年4季度群创光电Touch Sensor产能
2002-2013年LG DISPLAY收入与运营利润率
2011年1季度-2013年4季度LG DISPLAY每季度收入与运营利润率、毛利率
2011年1季度-2013年4季度LGD收入下游应用分布
2011年1季度-2012年1季度LGD各生产线产量
2012年4季度-2013年4季度LGD各生产线产量
2012年4季度-2013年4季度LGD Shipments and ASP
2012-2013年LGD收入地域分布
2013年LGD关键子公司Assets、Liabilities、Sales、Net income
2009-2014年SMD收入与运营利润率
2011年1季度-2013年4季度SMD季度收入与运营利润率
2010-2013年SMD AMOLED产能
2012-2014年三星液晶事业部收入下游分布
2011年1季度-2014年4季度SMD AMOLED 产能路线图
2003-2013年胜华收入与毛利率
2003-2013年胜华收入与运营利润率
2012年2月-2014年2月胜华月度收入
胜华全球分布
2006-2011年胜华收入技术分布
2009-2012年胜华收入客户分布
2010-2011年胜华销量、销售额、ASP
胜华电容触控屏产能
胜华触控屏COVER GLASS产能
胜华ATT结构
胜华ATT工艺流程
胜华ATT与传统电容G/G触控屏对比
2011年胜华大陆子公司财务状况
2005-2013年洋华收入与运营利润率
2012年2月-2014年2月洋华月度收入与增幅
2010-2013年洋华收入客户分布
2008-2012年洋华产能\产量\销量
洋华工厂分布
2006-2013年介面收入与运营利润率
2012年2月-2014年2月介面月度收入与增幅
2008-2012年介面产能\产量\销量
2008-2011年介面收入地域分布
2005-2014年SMAC收入与营业利润率
S-MAC生产流程
2013年1季度-2014年S-MAC季度收入业务分布
ILJIN Display组织结构
2008-2014年ILJIN Display收入与运营利润率
2011年1季度-2013年4季度ILJIN Display季度收入与运营利润率
2011年1季度-2013年4季度ILJIN Display收入业务分布
2010年1季度-2013年4季度ILJIN Display 7英寸TSP产量
2007-2014年Melfas收入与运营利润率
2007-2014年Melfas收入产品分布
2011年1季度-2013年4季度Melfas季度收入与运营利润率
2006-2013年ELK收入与运营利润率
2012年 -2013年 ELK 收入下游应用分布
2012年 -2013年 ELK 收入客户分布
2007-2014年Digitech Systems收入与运营利润率
2009-2012年Digitech Systems收入产品分布
和鑫组织结构
2004—2013年和鑫收入与运营利润率
2012年2月-2014年2月和鑫月度收入与增幅
2004-2013年达鸿科技收入与运营利润率
2012年2月-2014年2月达鸿月度收入与增幅
2005-2014财年NISSHA收入与运营利润率
2009-2014财年NISSHA收入业务分布
2010-2014财年NISSHA Touch Panel业务收入下游分布
2010年4季度-2013年4季度NISSHA 季度收入与营业利润率
2010年4季度-2013年4季度NISSHA Touch Panel业务季度收入与营业利润率
TPK Organizational Chart
2007-2014年TPK收入、毛利率、运营利润率
2011年1季度-2013年4季度TPK季度收入与运营利润率
2011年1季度-2013年4季度TPK季度收入与毛利率
2011年1季度-2012年4季度TPK季度收入与净利率
2012年1季度-2013年4季度TPK季度收入收入尺寸分布
2012年1季度-2013年3季度TPK季度收入TPK收入产品分布
2012年1月-2014年1月TPK月度收入与增幅
2008-2013年 TPK Holding触摸屏 产能、产量、销量
TPK Holding公司与关联公司关系图
2008-2013年牧东光电收入与运营利润率
2012年牧东光电收入客户分布
莱宝高科组织结构
2005-2014年莱宝高科收入与净利润
2012/2013上半年来宝高科收入业务分布
2005-2011年莱宝高科收入产品分布
2007-2013年欧菲光收入与运营利润率
2009-2013年欧菲光收入产品分布
2012年欧菲光客户结构
Glass-to-Glass (G/G) Projective Capacitive (P-cap) Touch Screen
Glass-to-Film-to-Film (G/F/F) P-cap Touch Screen
G1F Touch Screen
TOC Touch Screen
Sheet Type TOC
Piece Type TOC
Mobile Phone Touch Screen by Technology, 2011-2016E
Medium-sized Touch Screen by Technology, 2011-2015E
Laptop Touch Screen Shipment by Technology, 2012-2016E
AIO PC Touch Screen Shipment by Technology, 2012-2016E
Nano Silver Supply Chain
Global Touch Screen Market Size (by Value), 2010-2016E
Global Touch Screen Market Size (by Shipment), 2010-2016E
Global Touch Screen Market Shipment by Application, 2010-2015E
Laptop Shipment, 2008-2015E
Shipment of Major Global Laptop ODM Vendors, 2010-2013
Global Tablet PC Shipment, 2011-2016E
Market Share of Major Tablet PC Brands, 2013
Output of Global Tablet PC Vendors, 2012-2013
Global Mobile Phone Shipment, Q1 2011-Q4 2013
Global Mobile Phone Shipment, 2007-2014
Global 3G/4G Mobile Phone Shipment by Region, 2011-2014
Worldwide Smartphone Sales to End Users by Vendor, 2013
Worldwide Smartphone Sales to End Users by Operating System, 2013
Worldwide Mobile Phone Sales to End Users by Vendor, 2013
Shipment and Market Share of Smart Phone Operating Systems, Q2 2013
Shipment and Market Share of Major Android Mobile Phone Vendors, Q2 2013
Shipment and Market Share of Major Windows Phone Smart Phone Vendors, Q2 2013
Smart Phone Shipment of Chinese Major Vendors, 2011-2013
China's Monthly Mobile Phone Output, Feb-Dec 2013
China's Monthly Mobile Phone Export Value, 2013
Monthly Revenue and Profit of China Mobile Phone Industry, Feb-Dec 2013
Market Share of Major Vendors in Chinese Mobile Phone Market, 2013
China's Mobile Phone Output by Region, Jan-Nov 2013
Touch Screen Industry Chain
Touch Screen Production Process
Touch Screen Material Market Size, 2012-2017E
ITO Film Shipment, 2011-2016E
ITO Film Market Size, 2011-2016E
ITO Film Structure
ITO Film Supply Chain
Comparison between Major Vendors in Performance of ITO Film
Market Share of Major Global ITO Film Vendors, 2013
Revenue of Major Global OUT-CELL Touch Screen Vendors, 2010-2013
Operating Margin of Major Global OUT-CELL Touch Screen Vendors, 2012-2013
Shipment of Major Touch Screen Vendors, 2010-2013
Market Share of Samsung's Mobile Phone Touch Screen Suppliers, 2012-2013
Market Share of Samsung's Tablet PC Touch Screen Suppliers, 2012-2013
Nokia's Touch Screen Supplier Structure, 2012
LG's Touch Screen Supplier Structure, 2012
HTC's Touch Screen Supplier Structure, 2012
LTPS Mobile Phone Panel Shipment, Q1 2013-Q4 2014
Capacity of Global LTPS Production Lines, 2013-2014
Capacity of Global LTPS Vendors, 2013-2015E
TIANMA’s Revenue and Operating Margin, 2005-2013
Financial Data of TIANMA's Subsidiaries, 2012-2013
TRULY’s Revenue and Operating Margin, 2005-2013
TRULY’s LCD Revenue by Technology, 2006-2011
TRULY’s Semiconductor Revenue by Business, 2012-2013
TRULY’s Major Mobile Phone LCD Clients
TRULY’s Major Automotive Display Clients
TRULY’s Touch Screen Capacity
TRULY’s CCM Major Clients
HANNSTAR’s Organizational Structure
HANNSTAR’s Revenue and Operating Margin, 2006-2014
HANNSTAR’s Quarterly Revenue, Gross Margin and Operating Margin, Q3 2012-Q4 2013
HANNSTAR’s Quarterly Shipment, Q3 2012-Q4 2013
HANNSTAR’s Quarterly Revenue by Size, Q3 2012-Q4 2013
Distribution of HANNSTAR’s Bases
CPT’s Revenue and Operating Margin, 2004-2014
CPT’s Monthly Revenue and Shipment, Jan 2013-Feb 2014
AUO’s Revenue and Operating Margin, 2004-2013
AUO’s Monthly Revenue and Growth Rate, Jan 2012-Jan 2014
AUO’s Revenue by Application, Q1 2011-Q4 2013
AUO's Small and Medium-sized Product Shipment and Revenue, Q1 2011-Q4 2013
AUO's Revenue by Size, Q1 2011-Q4 2013
Capacity of AUO's Production Lines, Q1 2012
AUO's Capacity, Q4 2012-Q1 2014
INNOLUX's Revenue and Operating Margin, 2007-2013
INNOLUX's Revenue and Gross Margin, Q1 2012-Q4 2013
INNOLUX's Revenue by Application, Q1 2012-Q4 2013
INNOLUX's Revenue by Application, 2011-2012
INNOLUX's Revenue by Size, Q1 2012-Q4 2013
INNOLUX's Small and Medium-sized Product Revenue and Shipment, Q1 2012-Q4 2013
INNOLUX's Touch Screen Shipment, Q1 2011-Q4 2012
Capacity of INNOLUX's Production Lines, Q1 2012
Capacity of INNOLUX's Production Lines, Q4 2013
INNOLUX's Touch Sensor Capacity, Q1 2012
INNOLUX's Touch Sensor Capacity, Q4 2013
LG DISPLAY's Revenue and Operating Margin, 2002-2013
LG DISPLAY's Quarterly Revenue, Operating Margin and Gross Margin, Q1 2011-Q4 2013
LGD's Revenue by Application, Q1 2011-Q4 2013
Output of LGD's Production Lines, Q1 2011-Q1 2012
Output of LGD’s Production Lines, Q4 2012-Q4 2013
LGD’s Shipment and ASP, Q4 2012-Q4 2013
LGD’s Revenue by Region, 2012-2013
Assets, Liabilities, Sales and Net income of LGD's Key Subsidiaries, 2013
SMD’s Revenue and Operating Margin, 2009-2014
SMD’s Quarterly Revenue and Operating Margin, Q1 2011-Q4 2013
SMD’s AMOLED Capacity, 2010-2013
Revenue of Samsung LCD Division by Application, 2012-2014
SMD’s AMOLED Capacity, Q1 2011-Q4 2014
WINTEK's Revenue and Gross Margin, 2003-2013
WINTEK's Revenue and Operating Margin, 2003-2013
WINTEK's Monthly Revenue, Feb 2012 - Feb 2014
WINTEK's Global Presence
WINTEK's Revenue by Technology, 2006-2011
WINTEK's Revenue by Client, 2009-2012
WINTEK's Sales Volume, Sales Revenue and ASP, 2010-2011
WINTEK's Capacitor Touch Screen Capacity
WINTEK's Touch Screen COVER GLASS Capacity
WINTEK's ATT Structure
WINTEK's ATT Process
Comparison between WINTEK's ATT and Traditional Capacitor G / G Touch Screen
Financial Conditions of WINTEK's Subsidiaries in Mainland China, 2011
YOUNG FAST's Revenue and Operating Margin, 2005-2013
YOUNG FAST's Monthly Revenue and Growth Rate, Feb 2012-Feb 2014
YOUNG FAST's Revenue by Client, 2010-2013
YOUNG FAST's Capacity, Output and Sales Volume, 2008-2012
YOUNG FAST's Factory Distribution
JTOUCH's Revenue and Operating Margin, 2006-2013
JTOUCH's Monthly Revenue and Growth Rate, Feb 2012-Feb 2014
JTOUCH's Capacity, Output and Sales Volume, 2008-2012
JTOUCH's Revenue by Region, 2008-2011
SMAC's Revenue and Operating Margin, 2005-2014
SMAC's Production Process
SMAC's Quarterly Revenue by Business, Q1 2013 -2014
ILJIN Display's Organizational Structure
ILJIN Display's Revenue and Operating Margin, 2008-2014
ILJIN Display's Quarterly Revenue and Operating Margin, Q1 2011-Q4 2013
ILJIN Display's Revenue by Business, Q1 2011-Q4 2013
ILJIN Display's 7-inch TSP Output, Q1 2010-Q4 2013
Melfas' Revenue and Operating Margin, 2007-2014
Melfas' Revenue by Product, 2007-2014
Melfas' Quarterly Revenue and Operating Margin, Q1 2011-Q4 2013
ELK's Revenue and Operating Margin, 2006-2013
ELK's Revenue by Application, 2012-2013
ELK's Revenue by Client, 2012-2013
Digitech Systems' Revenue and Operating Margin, 2007-2014
Digitech Systems' Revenue by Product, 2009-2012
Sintek Photronic's Organizational Structure
Sintek Photronic's Revenue and Operating Margin, 2004-2013
Sintek Photronic's Monthly Revenue and Growth Rate, Feb 2012-Feb 2014
CANDO's Revenue and Operating Margin, 2004-2013
CANDO's Monthly Revenue and Growth Rate, Feb 2012-Feb 2014
NISSHA's Revenue and Operating Margin, FY2005-FY2014
NISSHA's Revenue by Business, FY2009-FY2014
NISSHA's Touch Panel Revenue by Application, FY2010-FY2014
NISSHA's Quarterly Revenue and Operating Margin, Q4 2010-Q4 2013
NISSHA's Quarterly Touch Panel Revenue and Operating Margin, Q4 2010-Q4 2013
TPK's Organizational Chart
TPK's Revenue, Gross Margin and Operating Margin, 2007-2014
TPK's Quarterly Revenue and Operating Margin, Q1 2011-Q4 2013
TPK's Quarterly Revenue and Gross Margin, Q1 2011-Q4 2013
TPK's Quarterly Revenue and Net Profit Margin, Q1 2011-Q4 2012
TPK's Quarterly Revenue by Size, Q1 2012-Q4 2013
TPK's Quarterly Revenue by Product, Q1 2012-Q3 2013
TPK's Monthly Revenue and Growth Rate, Jan 2012-Jan 2014
TPK's Touch Screen Capacity, Output and Sales Volume, 2008-2013
TPK Holding and Its Affiliated Companies
Revenue and Operating Margin of MUTTO OPTRONICS, 2008-2013
Revenue of MUTTO OPTRONICS by Client, 2012
Organizational Structure of LAIBAO HI-TECH
Revenue and Net Income of LAIBAO HI-TECH, 2005-2014
Revenue of LAIBAO HI-TECH by Business, 2012-H1 2013
Revenue of LAIBAO HI-TECH by Product, 2005-2011
Revenue and Operating Margin of SHENZHEN O-FILM TECH, 2007-2013
Revenue of SHENZHEN O-FILM TECH by Product, 2009-2013
Clients of SHENZHEN O-FILM TECH, 2012
如果这份报告不能满足您的要求,我们还可以为您定制报告,请 留言说明您的详细需求。
|