|
|
|
报告导航:研究报告—
制造业—化工
|
|
2013年中国固体废弃物处理行业研究报告 |
 |
字数:3.3万 |
页数:106 |
图表数:119 |
|
中文电子版:8000元 |
中文纸版:4000元 |
中文(电子+纸)版:8500元 |
|
英文电子版:2250美元 |
英文纸版:2400美元 |
英文(电子+纸)版:2550美元 |
|
编号:LMX048
|
发布日期:2014-03 |
附件:下载 |
 |
|
|
2012-2013年,中国固体废弃物处理行业主要呈现以下几个发展特点:
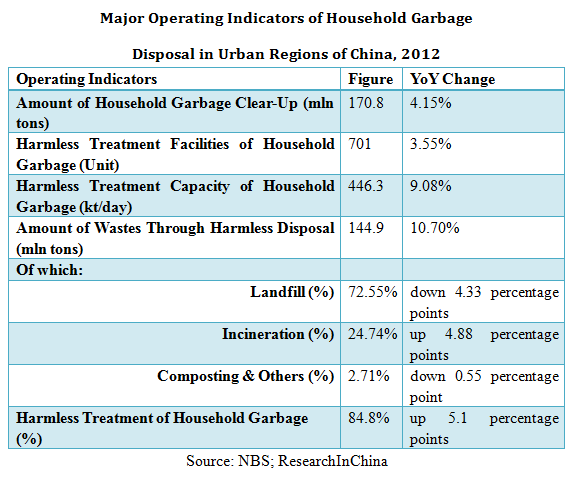
第一,行业处理规模继续保持增长。2012年,中国城市生活垃圾清运量1.7亿吨,同比增长4.15%;无害化垃圾处理量1.45亿吨,同比增长10.7%。2012年,中国工业固废产生量32.9亿吨,同比增长1.94%。
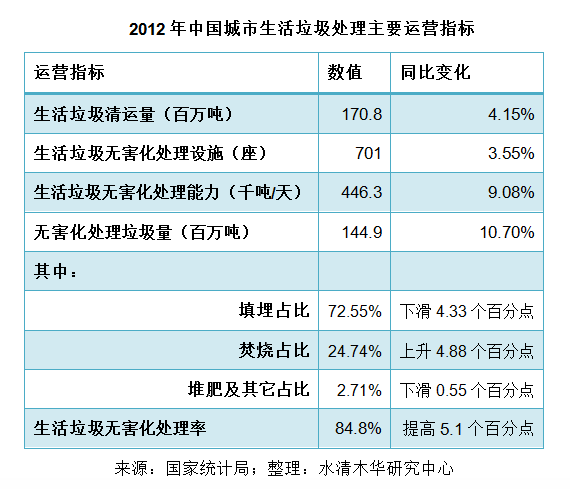
第二,城市生活垃圾处理构成中,焚烧处理占比逐年提高。城市生活垃圾焚烧处理从2004年5.55%上升至2012年的24.74%。截止2012年底,中国城市垃圾焚烧厂138座,同比2011年增加了29座;处理能力12.3万吨/日,同比增长30.32%;处理量3584万吨,同比增长37.89%。
第三,受益行业高增长,龙头企业大力拓展固废处理业务。
-
桑德环境是国内固废处理领域的龙头企业,业务领域涉及固废处理全产业链,业务模式主要以工程承包为主。2013年上半年,公司固废处理工程业务收入7.27亿元,同比增长15.91%。公司固废业务收入占公司总收入的比重达到70.22%。2014年2月,桑德环境公告其五个对外投资项目:毕节市碧清生物科技有限公司、湖北桑德环保有限公司、魏县德尚环保有限公司、湖南桑德污泥处理有限公司、昌邑致美环卫有限公司,分别涉及餐厨垃圾处理、资源化项目拓展、焚烧项目、污泥项目及环卫项目拓展领域。
-
2014年1月,城投控股将回购环境集团40%股权,此举加强了公司固废处理业务的综合实力。2012年以来,公司固废处理业务保持快速增长,2013年上半年,该业务收入2.46亿元,同比增长18.54%。
-
2013年12月,瀚蓝环境拟收购创冠(中国)100%股权。若成功收购创冠,瀚蓝环境处理能力将接近1.5万吨,而且将摆脱区域限制,业务布局将从广东南海拓展到全国。2013年上半年,公司固废处理业务1.38亿元,同比增长22.28%。公司固废处理业务收入占比逐年增加,从2007年的4.38%提高至2013年上半年的31.09%。
《2013年中国固体废弃物处理行业研究报告》主要包含以下几个方面内容:
1、中国城市生活垃圾处理行业现状,包括整体产生量及处理量分析,三种主要处理技术分析,区域分布,以及市场竞争格局分析;
2、中国工业固体废物处理行业现状,包含产生量及三种主要处理技术分析;
3、中国固废处理设备行业分析,包括整体产量以及区域分布;
4、中国14家重点固废处理企业分析,包含企业经营状况、固废处理业务、主要投资项目以及发展战略等。
China solid waste disposal industry was chiefly featured by the followings between 2012 and 2013.
Firstly, disposal scale continued growing: in 2012, the amount of household garage clear-up in urban regions of China rose by 4.15% year-on-year to 170 million tons; the volume of harmless garbage disposal grew by 10.7% year-on-year to 145 million tons; in 2012, the industrial solid waste output in China increased by 1.94% year-on-year to 3.29 billion tons.
Secondly, Incineration disposal occupied a growing proportion in the structure of household waste disposal in urban regions of China, with the proportion up from 5.55% in 2004 to 24.74% in 2012. As of late 2012, China had 138 garbage incineration plants in urban regions, a year-on-year rise of 29 ones over 2011, with the disposal capacity jumping by 30.32% year-on-year to 123,000 tons/day, and the amount of disposal soaring by 37.89% year-on-year to 35.84 million tons.
Thirdly, leading industrial players strove to expand solid waste disposal business thanks to the industrial boom.
-
Sound Environmental Resources Co., Ltd.is the leader in domestic solid waste disposal field, with businesses covering the whole range of the solid waste disposal industry chain. With engineering contracting as its major business pattern, the company’s revenue from solid waste disposal engineering business hit RMB727 million in H1 2013, up 15.91% year-on-year, or accounting for 70.22% of its total revenue. In Feb. 2014, it announced five outbound investment projects: Biqing Bio-Technology (Bijie) involving in kitchen waste disposal, Hubei Sound Environmental Protection involving in recycling project development, Weixian County Sound Environmental Protection involving in incineration field, Hunan Sound Sludge Treatment referring to sludge project and Changyi Zhimei Environmental Sanitation relating to sanitation project development field.
-
In Jan.2014, Shanghai Chengtou Holding Co., Ltd will make a buy-back of 40% stake of Shanghai Environment Group as a move to consolidate its comprehensive strength in solid waste disposal business. Since 2012, the solid waste disposal business of the company has sustained rapid development; in 2013H1, the company’s revenue of the business increased by 18.54% year-on-year to RMB246 million.
-
In Dec.2013, Grandblue Environment Co., Ltd was set to take over 100% stake of C & G (China) as a move to realize its disposal capacity approaching 15,000 tons. The acquisition, moreover, will make the company get rid of regional limitation, stretching its business from Nanhai of Guangdong Province towards all across China. In H1 2013, the revenue of the company from solid waste disposal business went up by 22.28% year-on-year to RMB138 million, with the proportion up from 4.38% in 2007 to 31.09%.
The report highlights the followings:
1. status quo of household garbage disposal industry in urban regions of China, including analysis on the overall generation and disposal amount, three major disposal technologies, regional distribution, market competition pattern;
2. status quo of industrial solid waste disposal industry in China, including analysis on the generation amount and three major disposal technologies;
3. analysis on China solid waste disposal equipment industry, including overall output and regional distribution;
4. 14 key solid waste disposal enterprises in China, including operation, solid waste disposal business, and major investment projects, development strategies.
前言
第一章 中国固废处理行业发展环境分析
1.1 行业背景
1.2 政策环境
第二章 中国城市生活垃圾处理行业分析
2.1 总体分析
2.1.1 产生量分析
2.1.2 处理情况统计
2.1.3 常用技术
2.2填埋技术
2.3堆肥技术
2.4 焚烧技术
2.4.1 国外发展现状
2.4.2 国内发展历程
2.4.3 主要运营指标
2.4.4 运营模式
2.4.5 技术路线
2.5 区域分析
2.5.1 厂数
2.5.2 处理能力
2.5.3处理量
2.5.4处理率
2.6 企业竞争格局
2.6.1 产业链布局
2.6.2 盈利情况
第三章 中国工业固体废物处理行业现状分析
3.1 产生量
3.2 处理方式
第四章 中国固废处理设备行业分析
4.1产量分析
4.2 区域分布
第五章 重点企业分析
5.1 桑德环境
5.1.1 公司简介
5.1.2 经营状况
5.1.3 营收构成
5.1.4 毛利率
5.1.5 固废处理业务
5.1.6 研发投入及主要项目
5.1.7 企业并购与投资合作
5.1.8 竞争优势
5.1.9 业绩预测
5.2 城投控股
5.2.1 公司简介
5.2.2 经营状况
5.2.3 营收构成
5.2.4 毛利率
5.2.5 固废处理业务
5.2.6主要项目
5.2.7 主要客户
5.2.8 环保转型
5.2.9 业绩预测
5.3 瀚蓝环境
5.3.1 公司简介
5.3.2 业务介绍
5.3.3 经营状况
5.3.4 营收构成
5.3.5 毛利率
5.3.6 固废处理业务
5.3.7 收购创冠(中国)
5.3.8 业绩预测
5.4 光大国际
5.4.1 公司简介
5.4.2 经营状况
5.4.3 固废处理业务
5.4.4 业绩预测
5.5 盛运股份
5.5.1 公司简介
5.5.2 经营状况
5.5.3 营收构成
5.5.4 毛利率
5.5.5 研发投入及主要客户
5.5.6 固废处理业务
5.5.7 业绩预测
5.6 泰达股份
5.6.1 公司简介
5.6.2 经营状况
5.6.3 营收构成
5.6.4 毛利率
5.6.5 固废处理业务
5.6.6 主要客户
5.6.7 业绩预测
5.7 杭州锦江集团
5.7.1 公司简介
5.7.2 固废处理业务
5.8 伟明环保
5.8.1 公司简介
5.8.2 发展历程
5.8.3 固废处理业务
5.9 三峰环境
5.9.1 公司简介
5.9.2 发展历程
5.9.3 固废处理业务
5.10 深能环保
5.11 绿色动力
5.12 天楹环保
5.12.1 公司简介
5.12.2 经营状况
5.12.3 固废处理业务
5.12.4 天楹环保借壳上市获通过
5.13 中国节能
5.13.1 公司简介
5.13.2 固废处理业务
5.14 杭州新世纪
5.14.1 公司简介
5.14.2 固废处理业务
第六章 市场总结及发展预测
6.1 市场总结
6.2 发展预测
6.2.1 生活垃圾
6.2.2 工业固废
Preface
1. Development Environment of China Solid Waste Disposal Industry
1.1 Background
1.2 Policy Environment
2. Development of Urban Household Garbage Disposal in China
2.1 Overview
2.1.1 Output
2.1.2 Disposal Volume
2.1.3 Disposal Technology
2.2 Landfill Technology
2.3 Composting Technology
2.4 Incineration Technology
2.4.1 Development in Overseas Market
2.4.2 Development Course in China
2.4.3 Operating Indicators
2.4.4 Operation Model
2.4.5 Technology Route
2.5 Regional Analysis
2.5.1 Number of Plants
2.5.2 Disposal Capacity
2.5.3 Disposal Volume
2.5.4 Disposal Rate
2.6 Competion among Enterprises
2.6.1 Layout in Industrial Chain
2.6.2 Profitability
3. Development of Industrial Solid Waste Disposal in China
3.1 Output
3.2 Disposal Technology
4. Development of Solid Waste Disposal Equipment in China
4.1 Output
4.2 Regional Distribution
5. Key Enterprises
5.1 Sound Environmental Resources Co., Ltd.
5.1.1 Profile
5.1.2 Operation
5.1.3 Revenue Structure
5.1.4 Gross Margin
5.1.5 Solid Waste Disposal Business
5.1.6 R&D Expense and Projects
5.1.7 Acquisition and Cooperation
5.1.8 Competitive Advantage
5.1.9 Performance Forecast
5.2 Shanghai Chengtou Holding Co., Ltd
5.2.1 Profile
5.2.2 Operation
5.2.3 Revenue Structure
5.2.4 Gross Margin
5.2.5 Solid Waste Disposal Business
5.2.6 Major Projects
5.2.7 Clients
5.2.8 Business Transformation
5.2.9 Performance Forecast
5.3 Grandblue Environment Co., Ltd
5.3.1 Profile
5.3.2 Business
5.3.3 Operation
5.3.4 Revenue Structure
5.3.5 Gross Margin
5.3.6 Solid Waste Disposal Business
5.3.7 Acquisition on C & G (China)
5.3.8 Performance Forecast
5.4 China Everbright International Limited
5.4.1 Profile
5.4.2 Operation
5.4.3 Solid Waste Disposal Business
5.4.4 Performance Forecast
5.5 Anhui Shengyun Machinery Co., Ltd
5.5.1 Profile
5.5.2 Operation
5.5.3 Revenue Structure
5.5.4 Gross Margin
5.5.5 R&D Expense and Clients
5.5.6 Solid Waste Disposal Business
5.5.7 Performance Forecast
5.6 Tianjin Economic-technological Development Area Co., Ltd
5.6.1 Profile
5.6.2 Operation
5.6.3 Revenue Structure
5.6.4 Gross Margin
5.6.5 Solid Waste Disposal Business
5.6.6 Clients
5.6.7 Performance Forecast
5.7 Hangzhou Jinjiang Group
5.7.1 Profile
5.7.2 Solid Waste Disposal Business
5.8 Zhejiang Weiming Environmental Protection Co., Ltd
5.8.1 Profile
5.8.2 Development Course
5.8.3 Solid Waste Disposal Business
5.9 Chongqing Sanfeng Environmental Industry Group Co., Ltd
5.9.1 Profile
5.9.2 Development Course
5.9.3 Solid Waste Disposal Business
5.10 Shenzhen Energy Environment Co., Ltd
5.11 Dynagreen Environmental Protection Group Co., Ltd
5.12 Jiangsu T.Y. Environmental Protection & Energy Co., Ltd.
5.12.1 Profile
5.12.2 Operation
5.12.3 Solid Waste Disposal Business
5.12.4 IPO
5.13 China Energy Conservation And Environmental Protection Group
5.13.1 Profile
5.13.2 Solid Waste Disposal Business
5.14 Hangzhou New Century Energy Environmental Protection Engineering Co., Ltd.
5.14.1 Profile
5.14.2 Solid Waste Disposal Business
6. Market Summary and Development Forecast
6.1 Market Summary
6.2 Development Forecast
6.2.1 Urban Household Garbage Disposal
6.2.2 Industrial Solid Waste Disposal
图:中国环保产业所处的发展阶段
图:中国环保治理子行业“十二五”规划投资额增速
表:固废处理行业政策的目标
图:固废处理行业发展阶段
表:2011-2013年中国固废处理行业相关政策
图:2003-2012年中国城市生活垃圾清运量及同比变化
图:1949-2012年中国城镇化率水平
图:2003-2012年中国城市生活垃圾处理厂数量和处理能力
图:2003-2012中国城市生活垃圾处理量及无害化处理率
表:中国常用的城市垃圾处理技术
图:2003-2012年中国城市生活垃圾处理量技术构成
表:2012年主要发达国家城市垃圾处理方式分布
图:2003-2012年中国城市垃圾填埋厂数
图:2003-2012中国城市垃圾填埋处理能力及同比增长
图:2003-2012年中国城市垃圾填埋处理量及同比增长
图:2003-2012中国城市垃圾堆肥厂数
图:2003-2012中国城市垃圾堆肥处理能力
图:2003-2012中国城市垃圾堆肥处理量
图:2012年全球主要国家垃圾焚烧所占比例及焚烧垃圾量
表:中国垃圾焚烧发电业发展历程
图:2003-2012中国城市垃圾焚烧厂数
图:2003-2012中国城市垃圾焚烧处理能力
图:2003-2012中国城市垃圾焚烧处理量及同比增长
图:中国垃圾焚烧发电产业的市场结构与盈利模式
表:中国主要固废处理企业业务区域分布
表:炉排炉与循环流化床对比
表:中国垃圾焚烧锅炉技术路线
表:2012年中国城市垃圾处理厂数排名前10位省市
表:2012年中国城市垃圾处理能力排名前10位省市
表:2012年中国城市垃圾处理量排名前10位省市
表:2012年中国城市垃圾处理率排名前10位省市
表:中国城市生活垃圾处理细分领域主要代表企业
表:2013上半年中国固废处理企业固废业务收入对比
表:2013年前三季度中国固废处理企业营业收入与净利润对比
表:2013上半年中国固废处理企业固废业务毛利率
图:2003-2012年中国工业固体废物产生量及同比增长
图:2012年中国工业固体废物处理技术构成(按产生量)
图:2003-2012年中国工业固体废物综合利用量及同比增长
图:2006-2012年中国工业固体废物贮存量及同比增长
图:2006-2012年中国工业固体废物处置量及同比增长
图:2004-2013年中国固废处理设备产量及同比增长
表:2011-2013年中国主要地区固废处理设备产量
图:2009-2013年桑德环境营业收入与净利润
表:2007-2012年桑德环境营业收入(分业务)构成
图:2007-2013年桑德环境营业收入(分区域)构成
表:2010-2013年桑德环境毛利率(分业务)
图:2007-2012年桑德环境固废处理工程业务营业收入及同比变化
表:2010-2013年桑德环境研发投入及占总营业收入的比重
表:桑德环境已完工典型固废处理项目
表:桑德环境主要立项、在建项目
表:2013-2014年桑德环境主要投资成立的公司
表:2013-2017年桑德环境营业收入与净利润预测
图:2009-2013年城投控股营业收入与净利润
表:2010-2013年城投控股营业收入(分业务)构成
表:2012-2013年上半年城投控股营业收入(分区域)构成
表:2010-2013年城投控股毛利率
表:2008-2012年上海环境集团垃圾中转,焚烧以及发电处理
图:2009-2013年城投控股环保处理业务营业收入及同比变化
表:城投控股主要固废处理项目
表:2013年上半年城投控股TOP5客户收入及占营业收入的比例
图:城投控股股权结构
表:2013-2017年城投控股营业收入与净利润预测
图:瀚蓝环境股权结构
图:瀚海环境业务拓展历程
图:2009-2013年瀚蓝环境营业收入与净利润
图:2007-2013年瀚蓝环境营业收入(分业务)构成
表:2009-2013年瀚蓝环境毛利率
图:瀚蓝环境南海固废处理环保产业园
表:瀚蓝环境垃圾转运产能规模
表:瀚蓝环境南海区飞灰、污泥、餐厨项目
表:创冠(中国)垃圾焚烧项目
表:2013-2017年瀚蓝环境营业收入与净利润预测
图:光大国际业务结构
图:2007-2013年光大国际营业收入与净利润
图:光大国际主要运营环保能源项目
图:光大国际在建或筹建的项目
图:2012-2013年光大国际环保能源业务主要运营指标
表:2014-2017年光大国际营业收入与净利润预测
图:2009-2013年盛运股份营业收入与净利润
表:2011-2013年盛运股份营业收入(分产品)构成
图:2009-2013年盛运股份营业收入(分区域)构成
表:2010-2013年盛运股份毛利率
表:2010-2012年盛运股份研发投入及占公司营业收入的比重
表:2013年上半年盛运股份TOP5客户收入及占营业收入的比例
表:盛运股份主要BOT项目
表:2013-2017年盛运股份营业收入与净利润预测
图:2007-2013年泰达股份营业收入与净利润
表:2007-2013年泰达股份营业收入(分业务)构成
图:2007-2013年泰达股份营业收入(分区域)构成
表:2012-2013年泰达股份毛利率
表:2011-2013年泰达股份固废处理业务主要运营指标
表:泰达股份主要固废处理项目
图:2007-2013年泰达股份环境管理业营业收入及同比变化
表:2013年上半年泰达股份TOP5客户收入及占公司营业收入的比重
表:2013-2017年泰达股份营业收入与净利润预测
表:杭州锦江集团已投产的垃圾发电厂
图:锦江集团固废处理项目区域分布
表:伟明环保发展历程
表:浙江伟明集团垃圾发电厂一览
表:三峰环境发展历程
图:三丰环境垃圾焚烧发电BOT项目
表:深能环保已建垃圾焚烧发电项目
图:绿色动力固废处理项目分布
表:2012-2013年天楹环保营业收入与净利润及2014年预测
图:2012-2014年天楹环保主营业务收入构成
图:2011-2016年天楹环保垃圾焚烧发电项目日处理能力
表:2012-2014年天楹环保固废处理业务运营指标及预测
表:2012-2014年天楹环保固废处理业务平均单价及预测
图:中国节能业务板块
表:中国节能固废处理项目
表:杭州新世纪固废处理项目
表:2012年中国城市生活垃圾处理主要运营指标
图:2004-2012年中国城市生活垃圾焚烧处理量占城市生活垃圾处理总量的比重
表:2015年中国城镇生活垃圾处理能力预测
表:2015年中国城镇生活垃圾处理能力技术构成预测
表:2015年中国餐厨垃圾处理能力及处理厂数预测
图:2013-2017年中国工业固体废物产生量及预测
图:2013-2017年中国工业固体废物综合利用率预测
Development Phase of China Environmental Protection Industry
Growth Rate for Investments in Environmental Treatment in China (by Segments) during “12th Five-Year” 2011-2015
Objectives of Solid Waste Disposal Industry Policies
Development Phase of Solid Waste Disposal Industry
Policies on Solid Waste Treatment in China, 2011-2013
Collection Volume and YoY Change of Urban Household Garbage in China, 2003-2012
Urbanization Rate in China, 1949-2012
Number of Urban Household Garbage Disposal Plants and Disposal Capacity in China, 2003-2012
Urban Household Garbage Disposal Volume and Harmless Disposal Rate in China, 2003-2012
Urban Household Garbage Disposal Technologies Commonly Used in China
Disposal Volume Structure of Urban Household Garbage (by Disposal Technologies) in China, 2003-2012
Disposal Technologies of Urban Household Garbage in Major Developed Countries, 2012
Number of Urban Household Garbage Landfill Plants in China, 2003-2012
Disposal Capacity and YoY Growth Rate of Urban Household Garbage Landfill in China, 2003-2012
Disposal Volume and YoY Growth Rate of Urban Household Garbage Landfill in China, 2003-2012
Number of Urban Household Garbage Composting Plants in China, 2003-2012
Urban Household Garbage Composting Disposal Capacity in China, 2003-2012
Urban Household Garbage Composting Disposal Volume in China, 2003-2012
Disposal Volume of Garbage Incineration and % of Total Disposal Volume in Major Countries, 2012
Development Course of Garbage Incineration Power Generation Industry in China
Number of Urban Household Garbage Incineration Plants in China, 2003-2012
Urban Household Garbage Incineration Disposal Capacity in China, 2003-2012
Urban Household Garbage Incineration Disposal Volume in China, 2003-2012
Industry Structure and Profit Model of Garbage Incineration Power Generation Industry in China
Major Solid Waste Disposal Enterprises’ Business Distribution in China
Contrast between Grate Boiler and Circulating Fluidized Bed Boiler
Technology Route of Garbage Incineration Boiler in China
Top 10 Provinces/Cities by Number of Urban Household Garbage Disposal Plants in China, 2012
Top 10 Provinces/Cities by Urban Household Garbage Disposal Capacity in China, 2012
Top 10 Provinces/Cities by Urban Household Garbage Disposal Volume in China, 2012
Top 10 Provinces/Cities by Urban Household Garbage Disposal Rate in China, 2012
Representative Enterprises in Segment Markets of Urban Household Garbage Disposal in China
Solid Waste Disposal Business Revenue Constrast among Major Enterprises in China, H1 2013
Revenue and Net Income of Major Solid Waste Disposal Enterprises in China, Q1-Q3, 2013
Gross Margin of Solid Waste Disposal Business of Major Enterprises in China, H1 2013
Output and YoY Growth Rate of Industrial Solid Waste Disposal in China, 2003-2012
Output of Industrial Solid Waste Disposal (by Disposal Technologies) in China, 2012
Utilized Volume and YoY Growth Rate of Industrial Solid Waste Disposal in China, 2003-2012
Stocked Volume and YoY Growth Rate of Industrial Solid Waste Disposal in China, 2006-2012
Disposed Volume and YoY Growth Rate of Industrial Solid Waste Disposal in China, 2006-2012
Output and YoY Growth Rate of Solid Waste Disposal Equipment in China, 2004-2013
Output of Solid Waste Disposal Equipment in China (by Regions), 2011-2013
Revenue and Net Income of Sound Environmental Resources, 2009-2013
Revenue Structure of Sound Environmental Resources (by Business), 2007-2012
Reveneu Structure of Sound Environmental Resources (by Region), 2007-2013
Gross Margin of Sound Environmental Resources (by Business), 2010-2013
Revenue and YOY Growth Rate of Solid Waste Disposal Business of Sound Environmental Resources, 2007-2012
R & D Expense and % of Total Revenue of Sound Environmental Resources, 2010-2013
Typical Solid Waste Disposal Projects Completed by Sound Environmental Resources
Major Projects Approved/ Under Construction of Sound Environmental Resources
Companies Invested by Sound Environmental Resources in 2013-2014
Revenue and Net Income of Sound Environmental Resources, 2013-2017E
Revenue and Net Income of Shanghai Chengtou Holding, 2009-2013
Revenue Structure of Shanghai Chengtou Holding (by Business), 2010-2013
Revenue Structure of Shanghai Chengtou Holding (by Region), 2012-2013
Gross Margin of Shanghai Chengtou Holding, 2010-2013
Solid Waste Disposal Volume of Shanghai Environment Group, 2008-2012
Revenue and YoY Growth Rate of Shanghai Environment Group, 2009-2013
Major Solid Waste Dispodal Projects of Shanghai Chengtou Holding
Shanghai Chengtou Holding’ Revenue from TOP Five Clients and % of Total Revenue, H1 2013
Equity Structure of Shanghai Chengtou Holding
Revenue and Net Income of Shanghai Chengtou Holding, 2013-2017E
Equity Structure of Grandblue Environment
Business Extension of Grandblue Environment
Revenue and Net Income of Grandblue Environment, 2009-2013
Revenue Structure of Grandblue Environment (by Business), 2007-2013
Gross Margin of Grandblue Environment, 2009-2013
Solid Waste Disposal Industrial Park of Grandblue Environment
Garbage Transport Capacity of Grandblue Environment
Projects of Fly Ash, Sludge, and Kichen Waste of Grandblue Environment
Waste Incineration Projects of C & G (China)
Revenue and Net Income of Grandblue Environment, 2013-2017E
Business Structure of China Everbright International
Revenue and Net Income of China Everbright International, 2007-2013
Environmental Energy Projects of China Everbright International
Projects under Construction or Planned of China Everbright International
Major Operating Indicators of Environmental Energy Business of China Everbright International, 2012-2013
Revenue and Net Income of China Everbright International, 2014E-2017E
Revenue and Net Income of Anhui Shengyun Machinery, 2009-2013
Reveue Breakdown of Anhui Shengyun Machinery (by Business), 2011-2013
Revenue Breakdown of Anhui Shengyun Machinery (by Regions), 2009-2013
Gross Margin of Anhui Shengyun Machinery, 2010-2013
R & D Expense and % of Total Revenue of Anhui Shengyun Machinery, 2010-2012
Anhui Shengyun Machinery’s Revenue from TOP 5 Clients and % of Total Revenue, H1 2013
Major BOT Projects of Anhui Shengyun Machinery
Revenue and Net Income of Anhui Shengyun Machinery, 2013-2017E
Revenue and Net Income of Tianjin Economic-technological Development Area, 2007-2013
Revenue Structure of Tianjin Economic-technological Development Area (by Segments), 2007-2013
Revenue Structure of Tianjin Economic-technological Development Area (by Regions), 2007-2013
Gross Margin of Tianjin Economic-technological Development Area, 2012-2013
Major Operating Indicators of Solid Waste Disposal Business of Tianjin Economic-technological Development Area, 2011-2013
Solid Waste Disposal Projects of Tianjin Economic-technological Development Area
Revenue and YoY Growth Rate of Environmental Management Business of Tianjin Economic-technological Development Area, 2007-2013
Tianjin Economic-technological Development Area’s Revenue from Top 5 Clients and % of Total Revenue, H1 2013
Revenue and Net Income of Tianjin Economic-technological Development Area, 2013-2017E
Garbage Power Plants in Operation of Hangzhou Jinjiang Group
Solid Waste Disposal Projects of Jinjiang Group by Region
Development Course of Zhejiang Weiming Environmental Protection
Garbage Power Plants of Zhejiang Weiming Environmental Protection
Development Course of Chongqing Sanfeng Environmental Industry Group
BOT Projects of Garbage Incineration Power Generation of Chongqing Sanfeng Environmental Industry Group
Constructed Garbage Incineration Power Generation Projects of Shenzhen Energy Environment
Solid Waste Disposal Projects Distribution of Dynagreen Environmental Protection Group
Revenue and Net Income of Jiangsu T.Y. Environmental Protection & Energy, 2012-2014E
Operating Revenue Structure of Jiangsu T.Y. Environmental Protection & Energy, 2012-2014E
Daily Disposal Capacity of Garbage Incineration Power Generation Projects of Jiangsu T.Y. Environmental Protection & Energy, 2011-2016E
Operating Indicators of Solid Waste Disposal Business of Jiangsu T.Y. Environmental Protection & Energy, 2012-2014E
Avaege Unit Price of Solid Waste Disposal of Jiangsu T.Y. Environmental Protection & Energy, 2012-2014E
Business of China Energy Conservation And Environmental Protection Group
Solid Waste Disposal Projects of China Energy Conservation And Environmental Protection Group
Solid Waste Disposal Projects of Hangzhou New Century Energy Environmental Protection Engineering
Major Operating Indicators in Urban Household Garbage Industry in China, 2012
Incineration Disposal Volume of Urban Household Garbage and % of Total Disposal Volume in China, 2004-2012
Disposal Capacity of Urban Household Garbage in China in 2015
Disposal Capacity of Urban Household Garbage in China (by Disposal Technologies) in 2015
Number of Plants and Capacity of Kichen Waste Disposal in China in 2015
Output of Industrial Solid Waste Disposal in China, 2013-2017E
Utilized Rate of Industrial Solid Waste Disposal in China, 2013-2017E
如果这份报告不能满足您的要求,我们还可以为您定制报告,请 留言说明您的详细需求。
|