|
|
|
报告导航:研究报告—
TMT产业—电子半导体
|
|
2013-2014年全球及中国显示驱动与触控IC行业研究报告 |
 |
字数:3.0万 |
页数:145 |
图表数:138 |
|
中文电子版:9000元 |
中文纸版:4500元 |
中文(电子+纸)版:9500元 |
|
英文电子版:2500美元 |
英文纸版:2900美元 |
英文(电子+纸)版:2800美元 |
|
编号:ZYW169
|
发布日期:2014-04 |
附件:下载 |
 |
|
|
《2013-2014年全球及中国显示驱动与触控IC行业研究报告》包含以下内容:
1、显示驱动IC与触控IC简介
2、大中小三种尺寸触摸(触控)屏技术趋势
3、Metal Mesh与AgNW现状与趋势
4、显示下游市场分析
5、显示驱动IC市场与产业分析
6、触控IC市场与产业分析
7、11家驱动IC设计公司研究
8、10家触控IC设计公司研究
2013年全球显示驱动IC市场大涨10.7%达到68.82亿美元,预计2014年上升到72.78亿美元,增幅为5.6%。显示驱动IC市场规模增加的原因有:
 4K2K级的UHD-TV市场接受度超出了预期,预计市场规模可迅速扩大 4K2K级的UHD-TV市场接受度超出了预期,预计市场规模可迅速扩大
手机显示屏和平板电脑显示屏分辨率大幅度提升,2014年将有至少3000万部分辨率达到QHD(Quad High Definition,2560*1440)级的手机出货,这其中包括重量级产品三星的S5、LG的G3、诺基亚的Lumia1820、OPPO的Find7
电脑显示器和笔记本电脑屏幕的分辨率同样大幅度提升,驱动IC数量大幅度增加。
2014年驱动IC产业最值得关注的就是Renesas出售其显示驱动IC部门。Renesas成立以来亏损不断,为了摆脱亏损局面,Renesas出售了一些非核心资产,然而其中小尺寸显示驱动IC部门盈利相当好。 Renesas是苹果手机驱动IC的主供应商,只是Renesas的主业是MCU。Broadcom、Synaptics、Novatek是最有可能的买家。尤其Synaptics是触控IC龙头厂家,收购成功的话,Synaptics就将成为中小显示驱动IC和触控IC双龙头厂家。
手机Touch IC未来的趋势是整合,整合的原因有成本和技术两个驱动力。技术上包括与Driver IC整合或与AP整合,预计未来和Driver IC整合才是主流趋势。除了成本下降之外,On-cell/In-cell技术更适合整合Driver IC + Touch IC。Driver IC和Touch IC都属于LCD display module零件,可以完全独立于AP之外。预计2H14开始TDDI(Touch Display Driver)就会开始慢慢放量。
触控IC领域另一个趋势是In-cell和On-cell。过去的On-cell主要都是高贵的AMOLED面板,2014年开始,将看到台湾和中国很多家面板厂的a-Si LCD手机面板开始搭配On-cell触控出货,包括AUO、Innolux、CPT、Hannstar、BOE、Tianma等。预计2014年中国手机产业将有5~10%配置On-cell Touch LCD。几家大IC厂都在做On-cell Touch IC,但放量最快的是Synaptics,其次是FocalTech。
触控IC市场方面,由于中低端手机对多点触控应用不感兴趣,所以市场主流仍然是自容式(Self Capacitance)触控IC,这类型的IC门槛比较低,价格战异常激烈。台湾厂家依靠供应链优势能够做到最低成本,大陆公司不得不退出,不过台湾厂家也并未获得太多利润。2013年触控IC市场规模仅微增7.4%,并且未来增速会持续放缓。未来市场的增长动力在In-cell/On-cell的触控IC领域,中低端市场虽然大,然而却利润微薄。
Global and China Display Driver & Touch IC Industry Report, 2013-2014 involves the followings:
1. Introduction to Display Driver IC and Touch IC
2. Technology Trends of Small-, Medium- and Large-sized Touch screens
3. Status Quo and Trend of Metal Mesh and AgNW
4. Analysis on Display Downstream Market
5. Analysis on Display Driver IC Market and Industry
6. Analysis on Touch IC Market and Industry
7. 11 Driver IC Design Houses
8. 10 Touch IC Design Houses
In 2013, global display driver IC market size skyrocketed by 10.7% to USD 6.882 billion, and is expected to be worth USD 7.278 billion in 2014, with an increase of 5.6%. The rise in the display driver IC market scale can be attributed to the factors below:
Market acceptance of 4K2K UHD-TV exceeded expectations and it is expected that market size will expand rapidly.
Resolution of screens on mobile phones and tablet PCs improved significantly, and there will be at least 30 million mobile phones with QHD (Quad High Definition, 2560*1440) screens to be shipped in 2014, including blockbuster Samsung S5, G3 from LG, Lumia 1820 from Nokia, and Find7 from OPPO.
Resolution of computer display and notebook computer screen also improved substantially, and the number of Driver IC increased greatly.
The most noteworthy in Driver IC industry in 2014 is the sale of Display Driver IC unit by Renesas. Since its inception, Renesas has operated in the red. In order to dig its way out of losses, the company sold some non-core assets, while its medium and small-sized Display Driver IC unit is fairly profitable. Renesas is a principal supplier of driver IC for Apple phones, but its main business comes to MCU. Broadcom, Synaptics and Novatek will be the most likely buyers. Especially, Synaptics, a leading company in touch IC market, would become a dual leader in medium and small-sized Display Driver IC and Touch IC markets, if its bid for Renesas succeeded.
For its future trend, the touch IC of mobile phone is to be integrated mainly driven by cost and technology. Technically, it can be integrated with either Driver IC or AP, with the former being expected to be the mainstream. In addition to cost cuts, On-cell/In-cell technology is more suitable for integrating Driver IC and Touch IC. As parts of LCD display module, Driver IC and Touch IC can be completely independent of AP. It is expected that TDDI (Touch Display Driver IC) will start to be shipped progressively from the second half of 2014.
Another trend in Touch IC field is In-cell and On-cell. In the past, On-cell was mainly expensive and noble AMOLED panel. However, from the year 2014, we will see a-Si LCD mobile phone panel equipped with On-cell Touch to be shipped from Taiwanese and Chinese companies, including AUO, Innolux, CPT, Hannstar, BOE and Tianma, etc. It is expected that 5%-10% of China’s mobile phone industry will be provided with On-cell Touch LCD. Several IC tycoons are producing On-cell Touch IC, among which Synaptics releases its production at the fastest pace, followed by FocalTech.
In Touch IC market, as mid- to lower range mobile phones have no interest in multi-point touchscreen, the mainstream market is still dominated by self capacitance Touch IC, which has a relatively low entry barrier and is faced with fierce price war. Relying on its advantages in supply chain, Taiwanese players can achieve the lowest costs, forcing mainland peers out of the market, but do not make handsome profit. In 2013, Touch IC market size edged up only 7.4%, and its growth rate will continue to slow in the future. The driving force of the market is in Touch IC field of In-cell/On-cell. Although its market is large, the low- and medium-end market generates meager profits.
第一章、驱动IC简介
1.1、TFT-LCD驱动IC简介
1.2、驱动IC制造流程
1.3、触控IC简介
1.4、触控IC发展趋势
1.5、手机触控屏技术发展趋势
1.6、中尺寸触控屏发展趋势
1.7、笔记本电脑触控屏发展趋势
1.8、AIO PC触控屏
1.9、METAL MESH 优势
1.10、METAL MESH供应链
1.11、纳米银线
第二章、显示下游市场
2.1、触控屏市场规模
2.2、笔记本电脑市场
2.3、平板电脑市场
2.4、手机市场
2.4.1、全球手机市场规模
2.4.2、智能手机市场与产业
2.4.3、中国手机市场与产业概况
2.5、UHD-TV市场
第三章、触控与驱动IC产业
3.1、驱动IC产业链
3.2、驱动IC发展趋势
3.3、显示驱动IC市场
3.4、显示驱动IC产业
3.5、触控屏市场规模
3.6、触控屏厂家排名
3.7、触控屏厂家与客户配套关系
3.8、触控IC市场趋势
3.9、ON-CELL触控IC
3.10、触控IC市场规模
3.11、触控IC产业分析
第四章、驱动IC厂家研究
4.1、RENESAS瑞萨
4.2、联咏
4.3、奇景
4.4、奕力
4.5、瑞鼎
4.6、旭曜
4.7、矽创
4.8、天钰
4.9、SILICON WORKS
4.10、LUSEM
4.11、MAGNACHIP
第五章、触控IC设计公司研究
5.1、MELFAS
5.2、敦泰
5.3、汇顶科技
5.4、义隆电子
5.5、SYNAPTICS
5.6、CYPRESS
5.7、ATMEL
5.8、禾瑞亚EETI
5.9、瀚瑞微PIXCIR
5.10、晨星半导体
5.11、其他
5.11.1、贝特莱
5.11.2、艾为电子
5.11.3、思立微
第六章、驱动IC产业链厂家研究
6.1、南茂科技
6.2、颀邦科技
6.3、世界先进
1. Profile of Driver IC
1.1 Introduction to TFT-LCD Driver IC
1.2 Manufacturing Process of Driver IC
1.3 Introduction to Touch IC
1.4 Development Trend of Touch IC
1.5 Technology Trend of Mobile Phone Touch Screen
1.6 Development Trend of Medium-sized Touch Screen
1.7 Development Trend of Laptop Computer Touch Screen
1.8 AIO PC Touch Screen
1.9 Advantages of METAL MESH
1.10 Supply Chain of METAL MESH
1.11 Nanometer Silver Wire
2. Display Downstream Market
2.1 Market Size of Touch Screen
2.2 Laptop Computer Market
2.3 Tablet PC Market
2.4 Mobile Phone Market
2.4.1 Global Mobile Phone Market Size
2.4.2 Smartphone Market and Industry
2.4.3 China’s Mobile Phone Market and Industry
2.5 UHD-TV Market
3. Touch and Driver IC Industry
3.1 Supply Chain of Driver IC
3.2 Development Trend of Driver IC
3.3 Display Driver IC Market
3.4 Display Driver IC Industry
3.5 Market Size of Touch Screen
3.6 Ranking of Touch Screen Vendors
3.7 Relationship between Touch Screen Vendors and Customers
3.8 Market Trend of Touch IC
3.9 Touch IC of ON-CELL
3.10 Market Size of Touch IC
3.11 Analysis on Touch IC Industry
4. Major Driver IC Vendors
4.1 Renesas
4.2 Novatek
4.3 Himax
4.4 Ilitek
4.5 Raydium
4.6 Orise
4.7 Sitronix
4.8 Fitipower
4.9 Silicon Works
4.10 Lusem
4.11 Magnachip
5. Major Touch IC Design Houses
5.1 Melfas
5.2 FocalTech
5.3 Goodix
5.4 ELAN
5.5 Synaptics
5.6 Cypress
5.7 Atmel
5.8 EETI
5.9 PIXCIR
5.10 MStar
5.11 Others
5.11.1 Betterlife
5.11.2 Awinic
5.11.3 Silead
6. Major Players in Driver IC Industry Chain
6.1 ChipMOS
6.2 Chipbond
6.3 VIS
Driver IC Manufaturing Process
2011-2016年手机触控屏技术分布
2011-2015年中尺寸触控屏技术分布
2012-2016年笔记本电脑触控屏出货量技术分布
2012-2016年AIO PC触控屏出货量技术分布
纳米银Silver NanofibersWires供应链
2010-2016年全球触控屏市场规模(金额)
2010-2016年全球触控屏市场规模(出货量)
2010-2015年全球触控屏市场出货量下游分布
2008-2015年笔记本电脑出货量
2010-2013年全球主要笔记本电脑ODM厂家出货量
2011-2016年全球平板电脑出货量
2013年平板电脑主要品牌市场占有率
2012、2013年全球平板电脑制造厂家产量
2011年1季度-2013年4季度全球手机出货量
2007-2014年全球手机出货量
2011-2014年全球3G/4G手机出货量地域分布
Worldwide Smartphone Sales to End Users by Vendor in 2013 (Thousands of Units)
Worldwide Smartphone Sales to End Users by Operating System in 2013 (Thousands of Units)
Worldwide Mobile Phone Sales to End Users by Vendor in 2013 (Thousands of Units)
2013年2季度智能手机操作系统出货量和市场占有率
2013年2季度主要安卓手机厂商出货量和市场占有率
2013年2季度主要Windows Phone 智能手机厂商出货量和市场占有率
2011-2013中国主要厂家智能手机出货量
2013年2-12月中国手机月度产量
2013年1-12月中国手机月度出口额
2013年2-12月中国手机行业月度收入与利润
2013年中国手机市场主要厂家市场占有率
2013年1-11月中国手机产量地域分布
2013-2017年UHD电视出货量
55-inch UHD TV price vs. FHD TV price
全球前15大LCD-TV厂家2013年出货量
2009-2016年全球显示驱动IC市场规模
2009-2014年全球显示驱动IC市场规模类型分布
2012-2013全球主要驱动IC厂家营业利润率
2010-2016年全球触控屏市场规模(金额)
2010-2016年全球触控屏市场规模(出货量)
2010-2015年全球触控屏市场出货量下游分布
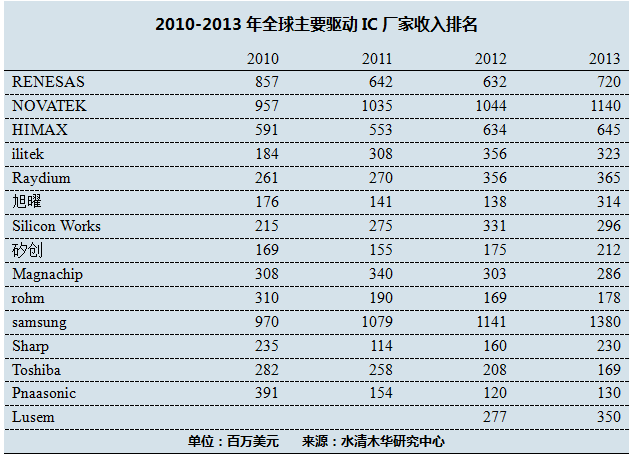
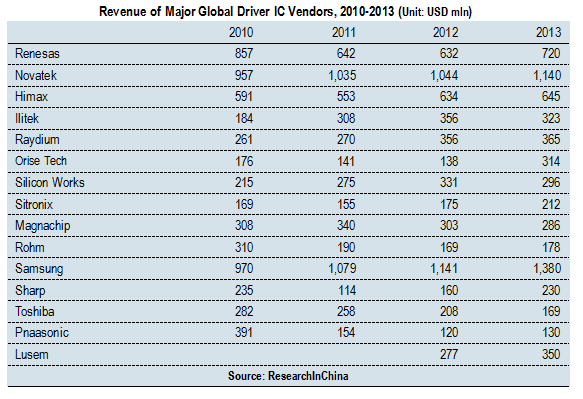
2010-2013年全球主要OUT-CELL触摸屏厂家收入
2012-2013年全球主要OUT-CELL触摸屏厂家营业利润率
2010-2013主要触控屏厂家出货量
三星2012-2013年手机触控屏供应商市场占有率
三星2012-2013年TabletPC触控屏供应商市场占有率
2012年诺基亚触控屏主要供应厂家所占比例
2012年LG触控屏主要供应厂家所占比例
2012年HTC触控屏主要供应厂家所占比例
2011-2016年触控IC市场规模
2012-2014年触控IC市场下游分布
触控IC产业链
2012-2013年触控IC设计公司收入(只计算触控IC业务收入)
2012年2季度-2013年4季度Renesas销售额与毛利率
瑞萨组织结构
2011-2014财年3季度瑞萨收入部门分布
Novatek Organization Chart
2006-2014年联咏收入与运营利润率
2012年4月-2014年2月联咏月度收入与增幅
2011年1季度-2013年4季度联咏季度收入产品分布
奇景关系企业图
2006-2014年奇景收入与运营利润率
2006-2013年奇景收入产品分布
2002-2013年奇景出货量
2007-2013年奇景毛利率
2007-2013年奇景OPEX
2011年3季度-2013年4季度奇景季度收入产品分布
2011年1季度-2013年4季度奇景季度运营花费
2011年3季度-2013年4季度奇景季度毛利率
2007-2013年奇景大客户比例
奇景供应链
2007-2014年奕力收入与运营利润率
2012年2月-2014年2月奕力月度收入与增幅
2007-2012年奕力出货量
2008-2013年奕力出货量下游应用分布
2007-2014年瑞鼎收入与运营利润率
2012年2月-2013年2月瑞鼎月度收入与增幅
2011、2012年瑞鼎产量、销量、产值
2007-2014年旭曜收入与运营利润率
2010年1季度-2013年4季度旭曜收入
2010年1季度-2013年4季度旭曜EBT
2012年2月-2014年2月旭曜月度收入与增幅
2008-2011年旭曜产量
2008-2013年旭曜销量
2009年1季度-2013年4季度旭 曜收入产品分布
2012年2季度旭 曜收入客户分布
2013年4季度旭 曜收入客户分布
2009年1季度-2013年2季度旭曜季度出货量
2006-2014年矽创收入与运营利润率
2012年2月-2014年2月矽创月度收入与增幅
2011年1季度-2012年4季度收入产品分布
2011年2月-2014年2月天钰科技月度收入与增幅
2009-2014年Silicon Works收入与营业利润率
2009-2013年Silicon Works收入产品分布
Lusem组织结构
2004-2013年Magnachip收入与毛利率
2004-2013年Magnachip收入业务分布
2009-2013年Magnachip收入地域分布
MAGNACHIP 各晶圆厂一览
2007-2014年Melfas收入与运营利润率
2007-2014年Melfas收入产品分布
2011年1季度-2013年4季度Melfas季度收入与运营利润率
2013年敦泰收入客户分布
GT813原理图
2004-2014年义隆电子收入与运营利润率
2012年2月-2014年2月义隆电子月度收入与增幅
2011年1季度-2013年4季度Elan收入产品分布
2010-2011年义隆电子收入客户分布
2006-2014财年 Synaptics收入与运营利润率
2004-2014财年 Synaptics收入下游应用分布
FY2010-2014财年SYNAPTICS收入地域分布
2007-2013年Cypress收入与运营利润率
2009-2013年 Cypress收入业务分布
2009-2013年Cypress收入地域分布
2006-2013年ATMEL收入与营业利润率
2008-2013年ATMEL收入业务分布
2012-2013年Atmel营业利润分布
2008-2013年ATMEL收入地域分布
ATMEL TOUCH PANEL CONTROL IC ROADMAP
2008-2014年禾瑞亚收入与营业利润率
2012年2月-2014年2月禾瑞亚月度收入
2003-2014年ChipMOS收入与毛利率
2011-2012年ChipMOS收入客户分布
2006-2012年ChipMOS收入地域分布
2012年上半年Chipmos收入业务分布
2013年Chipmos收入业务分布
2012年上半年Chipmos收入产品分布
2013年Chipmos收入产品分布
2009-2013年ChipMos LCDD业务收入与产能
2014-2016年ChipMos Technology Roadmap
2012年全球图形驱动IC Gold Bump厂家市场占有率
2006-2014年Chipbond收入与运营利润率
颀邦COG\COF 产能地域分布
颀邦TAB 产能分布
2012年2月-2014年2月颀邦月度收入
2005-2014年VIS收入与营业利润率
2011年1季度-2013年4季度VIS收入与毛利率
2011年1季度-2013年4季度VIS收入节点(Node)分布
2011年1季度-2013年4季度VIS收入下游应用分布
2011年1季度-2013年4季度VIS收入产品分布
2011年1季度-2013年4季度VIS出货量与产能利用率
Driver IC Manufacturing Process
Technology Distribution of Mobile Phone Touch Screen, 2011-2016E
Technology Distribution of Medium-sized Touch Screen, 2011-2015E
Shipment of Laptop Computer Touch Screen by Technology, 2012-2016E
Shipment of AIO PC Touch Screen by Technology, 2012-2016E
Silver Nanofibers Wires Supply Chain
Global Touch Screen Market Size (Value), 2010-2016E
Global Touch Screen Market Size (Shipment), 2010-2016E
Shipment of Global Touch Screen by Application, 2010-2015E
Laptop Computer Shipments, 2008-2015E
Shipment of Major Global Laptop Computer ODM Companies, 2010-2013
Global Tablet PC Shipment, 2011-2016E
Market Share of Main Tablet PC Brands, 2013
Output of Global Tablet PC Vendors, 2012-2013
Shipment of Global Mobile Phone, Q1 2011-Q4 2013
Shipment of Global Mobile Phone, 2007-2014
Global 3G/4G Mobile Phone Shipment by Region, 2011-2014
Worldwide Smartphone Sales to End Users by Vendor in 2013
Worldwide Smartphone Sales to End Users by Operating System in 2013
Worldwide Mobile Phone Sales to End Users by Vendor in 2013
Shipment and Market Share of Smartphone by Operating System, Q2 2013
Shipment and Market Share of Major Android Phone Vendors, Q2 2013
Shipment and Market Share of Major Windows Phone Smartphone Vendors, Q2 2013
Shipment of Smartphone from Major Chinese Vendors, 2011-2013
Monthly Output of Mobile Phone in China, Jan-Dec 2013
Monthly Export Value of Mobile Phone in China, Jan-Dec 2013
Monthly Revenue and Profit of China’s Mobile Phone Industry, Feb-Dec 2013
Market Share of Major Vendors in China’ Mobile Phone Market, 2013
Output Distribution of Chinese Mobile Phone by Region, Jan-Nov 2013
Shipments of UHD TV, 2013-2017E
55-inch UHD TV Price vs. FHD TV Price
Shipment of the World's Top 15 LCD-TV Companies
Global Display Driver IC Market Size, 2009-2016E
Market Size of Global Display Driver IC by Type, 2009-2014
Operating Margin of Major Global Driver IC Vendors
Global Touch Screen Market Size (Value), 2010-2016E
Global Touch Screen Market Size (Shipment), 2010-2016E
Shipment of Global Touch Screen by Application, 2010-2015E
Revenue of Major Global OUT-CELL Touch Screen Vendors, 2010-2013
Operating Margins of Major Global OUT-CELL Touch Screen Vendors, 2012-2013
Shipments of Major Touch Screen Vendors, 2010-2013
Market Share of Mobile Phone Touch Screen Suppliers for Samsung, 2012-2013
Market Share of Tablet PC Touch Screen Suppliers for Samsung, 2012-2013
Supply Structure of Major Touch Screen Suppliers for Nokia, 2012
Supply Structure of Major Touch Screen Suppliers for LG, 2012
Supply Structure of Major Touch Screen Suppliers for HTC, 2012
Touch Screen IC Market Size, 2011-2016E
Downstream Distribution of Touch Screen Market, 2012-2014
Touch Screen IC Industrial Chain
Revenue of Touch Screen IC Design Houses (only Revenue from Touch Screen IC Business), 2012-2013
Revenue and Gross Margin of Renesas, Q2 2012-Q4 2013
Organizational Structure of Renesas
Revenue Breakdown of Renesas by Division, FY Q3 2011-FY2014
Organization Chart of Novatek
Revenue and Operating Margin of Novatek, 2006-2014
Monthly Revenue and YoY Growth of Novatek, Apr 2012-Feb 2014
Quarterly Revenue of Novatek by Product, Q1 2011-Q4 2013
Affiliated Enterprises of Himax
Revenue and Operating Margin of Himax, 2006-2014
Revenue of Himax by Product, 2006-2013
Shipments of Himax, 2002-2013
Gross Margin of Himax, 2007-2013
OPEX of Himax, 2007-2013
Quarterly Revenue of Himax by Product, Q3 2011-Q4 2013
Quarterly Operating Expenses of Himax, Q1 2011-Q4 2013
Quarterly Gross Margin of Himax, Q3 2011-Q4 2013
Proportion of Big Customers of Himax, 2007-2013
Supply Chain of Himax
Revenue and Operating Margin of Ilitek, 2007-2014
Monthly Revenue and YoY Growth of Ilitek, Feb 2012-Feb 2014
Shipment of Ilitek, 2007-2012
Shipments of Ilitek by Application, 2008-2013
Revenue and Operating Margin of Raydium, 2007-2014
Monthly Revenue and YoY Growth of Raydium, Feb 2012-Feb, 2013
Output, Sales Volume and Output Value of Raydium, 2011-2012
Revenue and Operating Margin of Orise, 2007-2014
Revenue of Orise, Q1 2010-Q4 2013
EBT of Orise, Q1 2010-Q4 2013
Monthly Revenue and YoY Growth of Orise, Feb 2012-Feb 2014
Output of Orise, 2008-2011
Sales Volume of Orise, 2008-2013
Revenue of Orise by Product, Q1 2009-Q4 2013
Revenue of Orise by Customer, Q2 2012
Revenue of Orise by Customer, Q4 2013
Quarterly Shipment of Orise, Q1 2009-Q2 2013
Revenue and Operating Margin of Sitronix, 2006-2014
Monthly Revenue and YoY Growth of Sitronix, Feb 2012-Feb 2014
Revenue of Sitronix by Product, Q1 2011-Q4 2012
Monthly Revenue and YoY Growth of Fitipower, Feb 2011-Feb 2014
Revenue and Operating Margin of Silicon Works, 2009-2014
Revenue of Silicon Works by Product, 2009-2013
Organizational Structure of Lusem
Revenue and Gross Margin of Magnachip, 2004-2013
Revenue of Magnachip by Business, 2004-2013
Revenue of Magnachip by Region, 2009-2013
Wafer Fabs of MAGNACHIP
Revenue and Operating Margin of Melfas, 2007-2014
Revenue of Melfas by Product, 2007-2014
Revenue and Operating Margin of Melfas, Q1 2011-Q4 2013
Revenue of FocalTech by Customer, 2013
Schematic of GT813
Revenue and Operating Margin of Elan, 2004-2014
Monthly Revenue and YoY Growth of Elan, Feb 2012-Feb 2014
Revenue of Elan by Product, Q1 2011-Q4 2013
Revenue of Elan by Customer, 2010-2011
Revenue and Operating Margin of Synaptics, FY2006-FY2014
Revenue of Synaptics by Application, FY2004-FY2014
Revenue of Synaptics by Region, FY2010-FY2014
Revenue and Operating Margin of Cypress, 2007-2013
Revenue of Cypress by Business, 2009-2013
Revenue of Cypress by Region, 2009-2013
Revenue and Operating Margin of Atmel, 2006-2013
Revenue of Atmel by Business, 2008-2013
Operating Income Breakdown of Atmel, 2012-2013
Revenue of Atmel by Region, 2008-2013
Touch Panel Control IC Roadmap of Atmel
Revenue and Operating Margin of EETI, 2008-2014
Monthly Revenue of EETI, Feb 2012-Feb 2014
Revenue and Gross Margin of ChipMOS, 2003-2014
Revenue of ChipMOS by Customer, 2011-2012
Revenue of ChipMOS by Region, 2006-2012
Revenue of ChipMos by Business, H1 2012
Revenue of Chipmos by Business, 2013
Revenue of Chipmos by Product, H1 2012
Revenue of Chipmos by Product, 2013
Revenue and Capacity of ChipMos LCDD Business, 2009-2013
ChipMos Technology Roadmap, 2014-2016E
Market Share of Global Graphics-driven IC Gold Bump Companies, 2012
Revenue and Operating Margin of Chipbond, 2006-2014
Geographical Distribution of Chipbond COG\COF Capacity
Distribution of Chipbond TAB Capacity
Monthly Revenue of Chipbond, Feb 2012-Feb 2014
Revenue and Operating Margin of VIS, 2005-2014
Revenue and Gross Margin of VIS, Q1 2011-Q4 2013
Revenue of VIS by Node, Q1 2011-Q4 2013
Revenue of VIS by Application, Q1 2011-Q4 2013
Revenue of VIS by Product, Q1 2011-Q4 2013
Shipments and Capacity Utilization of VIS, Q1 2011-Q4 2013
如果这份报告不能满足您的要求,我们还可以为您定制报告,请 留言说明您的详细需求。
|