|
|
|
报告导航:研究报告—
制造业—汽车
|
|
2013-2014年全球及中国轮胎行业研究报告 |
 |
字数:2.7万 |
页数:170 |
图表数:265 |
|
中文电子版:9000元 |
中文纸版:4500元 |
中文(电子+纸)版:9500元 |
|
英文电子版:2600美元 |
英文纸版:2800美元 |
英文(电子+纸)版:2900美元 |
|
编号:ZYW170
|
发布日期:2014-04 |
附件:下载 |
 |
|
|
《2013-2014年全球及中国轮胎行业研究报告》主要包含以下内容:
1、全球汽车产业与市场分析
2、中国汽车产业与市场分析
3、美国、印度、中国轮胎产业与市场分析
4、全球27家主要轮胎厂家研究
2013与2014年都是轮胎行业的丰收年,一方面上游原材料价格持续走低,另一方面欧美市场稳健复苏,下游需求日益增加。上游原材料以天然橡胶为例,价格持续下滑,从2011年4季度国际市场的每吨4616美元下滑到2013年4季度的2574美元。在2013年10月天然橡胶中国市场价格为21500人民币每吨,2014年3月大跌到14380人民币每吨,暴跌33%。预计2014年下半年天然橡胶仍然维持地位,价格还可能小幅下跌。
2013年欧美经济复苏稳健,轮胎需求旺盛。2013年全球PLT(Passenger and Light Truck) 用OE车胎增长3%,RT(Replacement)用车胎增长3%,CV(Commercial Vehicle)用OE车胎增长6%,RT车胎增长5%。欧洲PLT用OE车胎增长1%,RT用车胎持平,CV用OE车胎增长4%,RT车胎增长8%。北美PLT用OE车胎增长5%,RT用车胎增长5%,CV用OE车胎下滑7%,RT车胎下滑2%。亚洲PLT用OE车胎增长5%,RT用车胎增长6%,CV用OE车胎增长12%,RT车胎增长5%。南美市场强力反弹,CV用OE车胎增长达30%,RT车胎增长10%。Africa-India-Middle East市场,PLT用OE车胎下滑6%,RT用车胎增长4%。CV用OE车胎下滑13%,RT车胎增长8%。
据中国橡胶工业协会轮胎分会对46家企业统计,企业利润达100.7亿元,增长12.3%,创历史新高。中国轮胎有大约1/3出口,其中美国是最大市场,2013年美国进口中国轮胎为5120万条,增幅达57.5%,创7年来最大增幅。2012年进口量为3250万条,增幅为25%,2011年进口量为2600万条。2013年中,美国整体的乘用车轮胎进口量也创下历史新高,同比提升13.6%至1.437亿条。这一增长主要来自三个地区的进口业务——中国大陆(同比激增55.8%)、印尼(同比增长16.7%)与台湾(同比攀升22.7%)。
轮胎厂家效益好,投资热情大增。从2014年招投标情况看,新上项目和产能依然火热,预计将再增全钢胎产能1500万条、半钢胎1亿条左右。这将使中国全钢胎总产能在2014年底达到1.65亿条、半钢胎产能达到6亿 条左右,轮胎行业结构性过剩将更加明显,竞争将更加激烈。
因为雾霾严重,从2013年下半年至今一直有省或市自行宣布实施国四排放标准,这意味着国三排放标准的重卡不得销售,而国四排放标准的重卡价格增加数万且柴油供应不畅,很多消费者提前购买了国三排放标准的汽车。提前透支、备货、消费一直存在,这也是造成2013年全年和2014年前两月销量同比大涨的一部分原因。尽管3、4月份是传统旺季,但固定资产投资目前并没有特别明显的增长趋势,加上之前的“透支”因素,2014年下半年重卡市场可能表现很差,全钢子午胎可能面临严重的供过于求。
Global and China Tire Industry Report, 2013-2014 highlights:
1. Global automobile industry and market analysis;
2. China automobile industry and market analysis;
3. American, Indian and Chinese Tire industry and market analysis;
4. Leading 27 tire vendors worldwide
2013 and 2014 marked bumper years for the tire industry. On the one hand, the raw material prices in the upstream remained falling; on the other hand, both the European and American markets resuscitated in a moderate manner, leading to an increasing demand from downstream. Take natural rubber, as a kind of raw material in the upstream, for example, the prices continued slipping, down from USD4,616/ton in 2011Q4 to USD2,574/ton in 2013Q4 in the international market. As the same case in Chinese market, the natural rubber price slumped from RMB21, 500/ton in Oct.2013 to RMB14, 380/ton by Mar.2013, a sharp drop of 33%. It is estimated that the price of natural rubber will maintain at a low level or even will see a slight decline in the second half of 2014.
In 2013, the tire demand appeared to be robust due to the steady recovery of European and American Economy. In 2013, on the global basis, the OE tire and RT (Replacement) tire demand for PLT (Passenger and Light Truck) use both grew by 3%, for CV (Commercial Vehicle) use increased by 6% and 5%, separately.
In Europe, the OE tire for PLT use rose by 1% and RT tire demand kept flat, the figure for CV use witnessed growth of 4% and 8%, respectively.
In North America, the OE tire and RT tire demand for PLT use both jumped by 5%, while for CV use fell by 7% and 2%, separately.
In Asia, the OE tire and RT tire demand for PLT use shot up by 5% and 6%, and for CV use went up by 12% and 5%, respectively.
In South America, the tire demand for CV use presented strong rebound, OE and RT shot up by 30% and 10%, respectively.
As for Africa-India-Middle East market, the OE tire demand for PLT use dropped by 6% , while RT went up by 4%; the OE tire for CV use glided by 13%, while RT climbed by 8%.
According to the statistics conducted by China Rubber Industry Association Tire Branch, the profit of 46 industrial players surveyed rose by 12.3% to a record high of RMB10.07 billion. China exports a matter of one third of its tire products, and mostly to the US. In 2013, the US imported 51.2 million tires from China, up 57.5%, the record growth in the past 7 years. In 2012, the import volume, for the US, grew by 25% to 32.5 million units; in 2011, the figure posted 26 million. During 2013, the import volume of tires for passenger cars, for America, beat a new peak, up by 13.6% year-on-year to 143.7 million. The growth mainly attributed to the import business from following three regions: Chinese mainland (a sharp year-on-year rise of 55.8%), Indonesia (a year-on-year growth of 16.7%) and Taiwan (a year-on-year jump of 22.7%).
Because of substantial benefits of tire vendors, their enthusiasm for investment in the tire business was boosted greatly. When it comes to bidding dynamics in 2014, new projects and new capacities showed no less fever, with the estimated growth in all-steel tire capacity of 15 million units and in semi-steel tire capacity approximating 100 million units. As a result, China is expected to realize full-steel tire capacity 165 million units and semi-steel tire capacity roughly 600 million units by 2014 yearend when will witness further surplus of industrial structure and fiercer industrial competition.
In addition, due to pervasive haze, there have been provinces and municipalities since 2013H2 voicing their willingness to carry out national Ⅳ emission standard. It means that heavy-load trucks in line with national Ⅲ emission standard are not allowed to be sold. In comparison, heavy-load trucks in line with national Ⅳ emission standard are tens of thousands of higher in price than the equivalents in line with national Ⅲ emission standard. Coupled with unsmooth supply of diesel, many consumers in advance bought vehicles in line with national Ⅲ emission standard. Overdraft, stocking up and consumption in advance are, as ever, commonplace, which in part contributed to a steep year-on-year rise in sales volume between the full 2013 year and the first two months of 2014. Furthermore, the investment in fixed assets in March and April failed to witness sharp upward mobility, albeit the two marked peak season. With the addition of previous “overdraft”, the heavy-duty truck market in 2014H2 is likely to demonstrate poor performance, and the all-steel radial tire market is expected to embrace oversupply.
第一章、全球汽车产业
第二章、全球汽车市场
第三章、中国汽车市场
3.1、中国汽车市场概述
3.2、中国汽车产业分析
第四章、全球轮胎市场
4.1、全球轮胎市场规模
4.2、全球轮胎市场地域分布
4.3、全球轮胎产业排名
4.4、美国轮胎市场
4.4.1、美国轮胎市场规模
4.4.2、美国轮胎分销商排名
4.4.3、美国轮胎市场主要厂家市场占有率
4.4.4、美国OTR市场主要厂家市场占有率
4.5、印度轮胎市场
4.5.1、印度汽车市场
4.5.2、印度轮胎市场与产业
4.5.3、印度汽车轮胎厂家市场占有率
4.6、中国轮胎市场与产业
4.6.1、中国轮胎市场规模
4.6.2、中国轮胎产业规模
4.6.3、中国轮胎产业现状
4.6.4、中国轮胎出口
4.6.5、中国全钢子午胎产业
4.6.6、中国轮胎市场主要厂家市场占有率
4.6.7、中国轮胎十大厂家收入、产量、利润
4.6.8、中国汽车轮胎产业海外投资分析
第五章、全球主要轮胎厂家研究
5.1、米其林
5.2、普利司通
5.3、固特异
5.4、大陆
5.5、住友橡胶
5.6、倍耐力
5.7、横滨
5.8、韩泰
5.9、固铂
5.10、锦湖
5.11、东洋橡胶
5.12、APOLLO TYRES
5.13、MRF
5.14、NOKIAN
5.15、正新
5.16、中策
5.17、三角
5.18、玲珑
5.19、风神
5.20、双钱
5.21、贵州轮胎
5.22、青岛双星
5.24、兴源集团
5.25、赛轮股份
5.26、佳通
5.27、盛泰集团
1.Global Automobile Industry
2. Global Automobile Market
3. China Automobile Market
3.1. Overview of China Automobile Market
3.2. Analysis on China Automobile Industry
4. Global Tire Market
4.1. Market Scale
4.2. Market Structure by Region
4.3. Ranking of Global Tire Vendors
4.4. US Tire Market
4.4.1. Market Scale
4.4.2 Ranking of Tire Dealers
4.4.3. Market Occupancy of Main Tire Vendors
4.4.4. Market Occupancy of Main OTR Vendors
4.5. Tire Market in India
4.5.1. Automobile Market
4.5.2. Tire Market and Industry
4.5.3. Market Occupancy of Auto Tire Vendors
4.6 China Tire Market and Industry
4.6.1 Market Scale
4.6.2. Industry Scale
4.6.3. Status Quo
4.6.4. Tire Export
4.6.5. All-Steel Radial Tire Industry
4.6.6. Market Occupancy of Main Tire Vendors
4.6.7. Revenue, Output and Profit of Top 10 Tire Vendors
4.6.8. Analysis on Overseas Investment of China Auto Tire Industry
5. Leading Tire Vendors Worldwide
5.1. Michelin
5.2. Bridgestone
5.3. Goodyear
5.4. Continental
5.5. Sumitomo Rubber Group
5.6. Pirelli
5.7. Yokohama Rubber
5.8. Hankook
5.9. Cooper
5.10. Kumho Tire
5.11. Toyo Tire &Rubber
5.12. Apollo Tyres
5.13. MRF
5.14. Nokian
5.15. Cheng Shin Tire
5.16. Hangzhou Zhongce Rubber
5.17. Triangle Tire
5.18. Linglong Tire
5.19. Aeolus Tire
5.20. Double Coin
5.21. Guizhou Tire
5.22. Qingdao Double Star
5.24. Xingyuan
5.25. Sailun Group
5.26. Giti Tire
5.27. Shengtai
2010-2013年全球主要汽车品牌销量
2011-2014 年全球轻型车产量
2011-2014 年全球重型车产量
2001-2013年中国汽车产量
2008-2013年中国各类型汽车年产量同比增幅
2013年中国主要汽车厂家销量
2013年自主品牌汽车厂家销量
2006-2015年全球轮胎市场规模
2008-2010年全球轮胎市场按类型分布
2011-2012年全球汽车轮胎出货量
2012年全球PLT轮胎产量地域分布
2012年全球PLT轮胎需求量地域分布
2011- 2012年PLT用RT轮胎出货量地域分布
2011- 2012年CV 用RT轮胎出货量地域分布
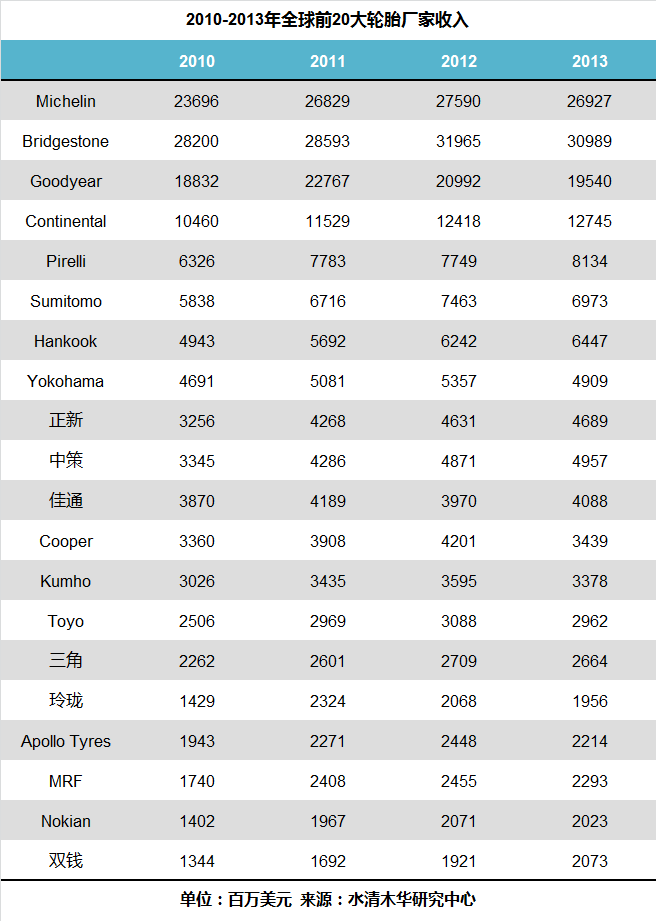
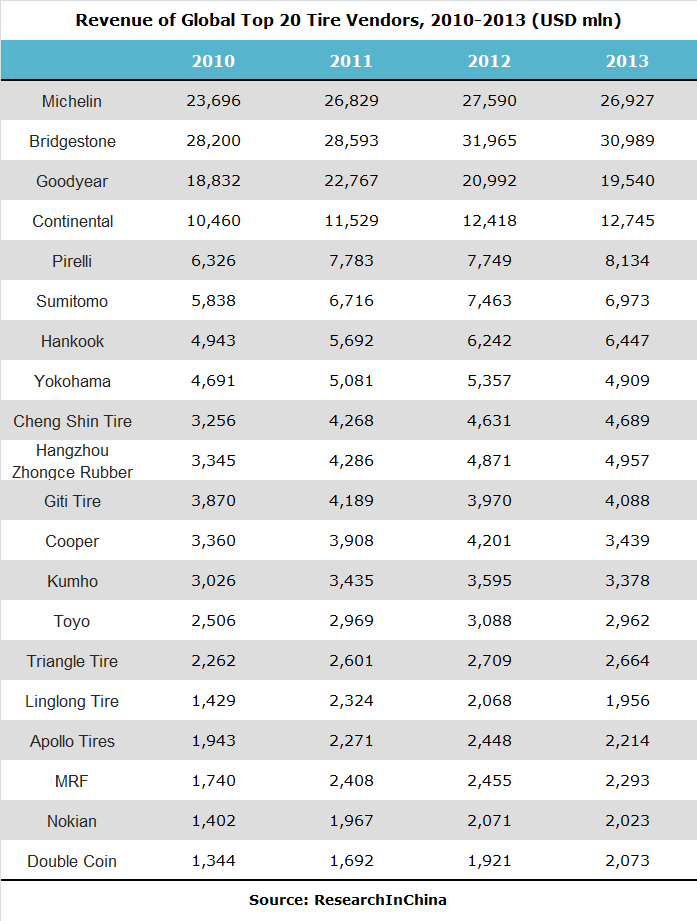
2010-2013年全球前20大轮胎厂家收入
2011-2013年全球前20大轮胎厂家营业利润率
2011年美国轮胎销售量渠道分布
2004-2013年美国乘用车OE与Replacement轮胎出货量
2004-2013年美国轻卡(Light-Truck)OE与Replacement轮胎出货量
2004-2013年美国中卡(Medium-Truck)OE与Replacement轮胎出货量
2010-2011年美国OTR Bias轮胎主要厂家市场占有率
2010-2011年美国OTR Radial轮胎主要厂家市场占有率
2012年印度乘用车轮胎主要厂家市场占有率
2012年印度卡车 轮胎主要厂家市场占有率
2012年印度轻型商用车主要轮胎主要厂家市场占有率
2005-2014年中国汽车轮胎市场规模
2005-2014年中国汽车轮胎OE与替换市场规模
2003-2012年中国汽车轮胎产量
2003-2012年中国汽车轮胎子午胎所占比例
2005-2012年中国子午胎产量
2013年中国轮胎产量地域分布
2005-2012年中国汽车轮胎出口量
2005-2012年中国汽车轮胎出口额
2005-2012年中国全钢子午胎产量
2010 中国OE轿车轮胎市场主要厂家市场占有率
2011中国OE轿车轮胎市场主要厂家市场占有率
2012中国OE轿车轮胎市场主要厂家市场占有率
2013中国轿车轮胎OE市场主要厂家市场占有率
2013年中国交叉型乘用车轮胎主要厂家市场占有率
2013年中国载重车轮胎主要厂家市场占有率
2013年度中国橡胶工业百强企业排名
2008-2010年中国十大轮胎厂家产量
2008-2010年中国十大轮胎厂家利润
2004-2013年Michelin收入与营业利润率
2012-2013米其林营业利润桥梁图
2008-2012年米其林收入地域分布
2012年米其林轮胎出货量尺寸分布
2013年米其林轮胎出货量尺寸分布
2012年米其林运营开支分析
2011-2017年米其林资本支出与折旧
2012年1季度-2013年4季度米其林季度Volumes与Price-mix
2009-2013年米其林收入部门分布
2009-2013年米其林各部门营业利润率
米其林轮胎中国车型应用
2007-2014年普利司通收入与营业利润率统计
2004-2013年普利司通收入地域分布
2013年普利斯通营业利润桥梁图
2014年普利斯通营业利润桥梁图
2011普利司通全球工厂分布
2013年4月普利司通全球工厂分布
普利司通中国分布
2004-2013年固特异收入与营业利润率统计
2007-2013年Goodyear销量
2013年固特异收入业务分布
2008-2013年Goodyear收入地域分布
2008-2013年Goodyear各地区营业利润率
2006-2013年固特异轮胎销量地域分布
2016-2013年Goodyear销量下游分布
2006-2013年固特异各地区替换Replacement轮胎销售比例
固特异中国车胎应用
2008-2013年德国大陆集团收入地域分布和业务分布
2011-2013年大陆集团轮胎业务Key Figures
大陆集团轮胎品牌一览
2012-2013年大陆集团轮胎业务收入地域分布
2012年大陆集团PLT轮胎产能地域分布(不包括欧洲)
2013年大陆集团PLT轮胎产能地域分布(不包括欧洲)
2012年大陆集团欧洲PLT轮胎产能地域分布
2013年大陆集团欧洲PLT轮胎产能地域分布
2012年大陆集团CV轮胎产能地域分布
2013年大陆集团CV轮胎产能地域分布
2008-2013年大陆集团PLT轮胎销量
2008-2013年大陆集团CV轮胎销量
2004-2013年住友橡胶收入与营业利润率
2007-2013年住友橡胶收入地域分布
2009-2014年住友橡胶日本外销量地域分布
2006-2014年住友橡胶轮胎产量与产能利用率
2006-2014年住友橡胶产量与产能利用率
2007-2013年住友橡胶收入产品分布
2007-2013年住友橡胶营业利润按产品分布
住友橡胶轮胎中国应用
2006-2013年倍耐力轮胎收入与营业利润率
2012-2013倍耐力轮胎EBIT Bridge
2006-2013年倍耐力轮胎收入业务分布
2012年倍耐力轮胎原材料成本
2013年倍耐力轮胎收入产品分布
2012年倍耐力轮胎收入地域分布
2012年倍耐力员工数量地域分布
2012年倍耐力轮胎收入产品分布
2013年倍耐力轮胎收入产品分布
2012年倍耐力轮胎收入地域分布
2013年倍耐力轮胎收入地域分布
2012年倍耐力员工数量地域分布
2013年倍耐力员工数量地域分布
倍耐力全球分布
2006-2014年横滨橡胶销售额与营业利润率
2006-2013年横滨橡胶轮胎收入地域分布
2009-2014年横滨橡胶全球工厂产能
2006-2014年横滨橡胶销售额与营业利润率
2006-2013年横滨橡胶轮胎收入地域分布
2009-2014年横滨橡胶全球工厂产能
2003-2013年韩泰轮胎收入与营业利润率
2010年2季度-2013年4季度韩泰轮胎销售额与营业利润率
2012年4季度-2013年4季度韩泰韩国与中国季度销售额
2012年4季度-2013年4季度韩泰欧洲与北美季度销售额
2005-2014年韩泰轮胎产量地域分布
2011年4季度-2013年4季度天然橡胶与合成橡胶价格
韩泰轮胎OE配套车型
2004-2013年固铂收入与营业利润率
2006-2013年固铂收入地域分布
2012年COOPER销售额产品分布
2005-2013年锦湖轮胎收入与营业利润率
锦湖轮胎产能分布
2009-2013年锦湖轮胎出货量与ASP
2012年1季度-2013年4季度锦湖轮胎各国工厂季度产能利用率
2012-2013年锦湖轮胎产量地域分布
2004-2013年东洋橡胶收入与营业利润率
2007-2013年东洋橡胶收入地域分布
2008-2013年东洋橡胶产量
2007-2014财年Apollo Tyres收入与净利润率
2012财年Apollo Tyres销售额产品分布
2007-2011财年Apollo Tyres产量与EBITDA率
2012财年Apollo Tyres销售额与产能地域分布
Apollo Tyres收入地域分布
Apollo Tyres营业利润地域分布
2005-2013财年MRF收入与利润
MRF工厂分布
2004-2013年Nokian收入与营业利润率
2012年 Nokian销售额地域分布
2013年Nokian销售额地域分布
2012 Nokian原材料消耗
2012-2013 Nokian成本
2003-2012年Nokian俄罗斯与CIS地区收入
2003-2013年正新收入与营业利润率
2011-2013年正新收入地域分布
正新工厂全球分布
正新各工厂简介
2013 正新各工厂收入
2013 正新OE&RE客户收入占比
正新轮胎中国应用车型
2007-2012年杭州中策橡胶收入与营业利润率
2007-2011年杭州中策橡胶收入与产量
中策组织结构
2007-2012年三角集团收入与营业利润率
2007-2012年三角集团收入与产量
2007-2011年玲珑轮胎集团收入与营业利润率
2007-2011年玲珑轮胎集团收入与产量
2006-2013年风神股份收入与营业利润率
风神轮胎组织结构
风神股份股东结构
2005-2013年双钱集团收入与营业利润率
上海轮胎集团组织结构
2006-2013年贵州轮胎收入与营业利润率
2004-2013年青岛双星收入与营业利润率
2007-2013年兴源集团收入与营业利润率
2009-2013年赛轮股份营业利润率
2012-2013年赛轮股份成本结构
2009-2014年赛轮股份收入产品分布
2009-2014年赛轮股份毛利产品分布
2006-2013年佳通轮胎股份有限公司收入与营业利润
Automobile Sales Volume Worldwide by Brand, 2010-2013
Global Light Vehicle Output, 2011-2014
Global Heavy Vehicle Output, 2011-2014
Automobile Output in China, 2001-2013
Year-on-Year Growth in Annual Auto Output in China by Type, 2008-2013
Sales Volume of Major Automakers in China, 2013
Sales Volume of Local Automakers in China, 2013
Global Tire Market Scale, 2006-2015
Global Tire Market Structure by Type, 2008-2010
Global Auto Tire Shipment, 2011-2012
PLT Tire Output Worldwide by Region, 2012
PLT Tire Demand Worldwide by Region, 2012
PLT-use RT Tire Shipment by Region, 2011-2012
CV-use RT Tire Shipment by Region, 2011-2012
Revenue of Top 20 Tire Companies Worldwide, 2010-2013
Operating Margin of Top 20 Tire Companies Worldwide, 2011-2013
US Tire Sales Volume by Channel, 2011
Shipment of OE and Replacement Tire for PLT in America, 2004-2013
Shipment of OE and Replacement Tire for Light-Truck in America, 2004-2013
Shipment of OE and Replacement Tire for Medium-Truck in America, 2004-2013
Market Share of Major OTR Bias Tire Vendors in America, 2010-2011
Market Share of Major OTR Radial Tire Vendors in America, 2010-2011
Tire Market Downstream Distribution in India, 2010-2013
Major Tire Projects Completed/Scheduled for Completion in India, 2010-2013
Market Share of Major Passenger Car Tire Vendors in India, 2012
Market Share of Major Light-Duty Commercial Vehicle Tire Companies in India, 2012
Market Share of Major Truck Tire Companies in India, 2012
China Automobile Tire Market Size, 2005-2014
Automobile OE and Replacement Tire Market Size of China, 2005-2014
China Automobile Tire Output, 2003-2012
Radial Tire Proportion in Auto Tire of China, 2003-2012
Radial Tire Output in China, 2005-2012
China Automobile Tire Output by Region, 2013
Export Volume of Auto Tire in China, 2005-2012
Export Value of Auto Tire in China, 2005-2012
All-Steel Radial Tire Output in China, 2005-2012
Market Share of Leading Sedan OE Tire Companies in China, 2010
Market Share of Leading Sedan OE Tire Companies in China, 2011
Market Share of Leading Sedan OE Tire Companies in China, 2012
Market Share of Leading Sedan OE Tire Companies in China,, 2013
Market Share of Leading Cross Passenger Car Tire Companies in China, 2013
Market Share of Leading Heavy-Duty Vehicle Tire Companies in China, 2013
Ranking of Top 10 Chinese Tire Companies by Sales and Total Profit, 2007
Output of Top 10 Chinese Tire Companies, 2008-2010
Profit of Top 10 Chinese Tire Companies, 2008-2010
Revenue and Operating Margin of Michelin, 2004-2013
Operating Profit of Michelin, 2012-2013
YoY change in Unit Gross Margin Components of Michelin, 2013
Revenue of Michelin by Region, 2008-2012
Tire Shipment of Michelin by Size, 2012
Tire Shipment of Michelin by Size, 2013
Operating Expenses of Michelin, 2012
Michelin Tonnes per Employee, 2006-2013
Michelin Capital Expenditure and Depreciation, 2011-2017
Quarterly Volumes and Price-mix of Michelin, 2012Q1-2013Q4
Revenue of Michelin by Division, 2009-2013
Operating Margin of Michelin by Division, 2009-2013
Application of Michelin Tire in Auto Models made in China
Revenue and Operating Margin of Bridgestone, 2007-2014
Revenue of Bridgestone by Region, 2004-2013
Operating Profit of Bridgestone, 2013
Operating Profit of Bridgestone, 2014
Global Distribution of Plants under Bridgestone, 2011
Global Distribution of Plants under Bridgestone, Apr.2013
Distribution of Bridgestone in China
Revenue and Operating Margin of Goodyear, 2004-2013
Sales Volume of Goodyear, 2007-2013
Revenue of Goodyear by Business, 2013
Revenue of Goodyear by Region, 2008-2013
Operating Margin of Goodyear by Region, 2008-2013
Replacement Tire Sales Proportion of Goodyear by Region, 2006-2013
Tire Sales Volume of Goodyear by Region, 2006-2013
Application of Goodyear Tire in China
Revenue and Business of Continental by Region, 2008-2013
Key Figures of Continental from Tire Business, 2011-2013
Tyre Brands of Continental
Revenue of Continental from Tire Business by Region, 2012-2013
PLT Tire Capacity of Continental by Region (Excluding Europe), 2012
PLT Tire Capacity of Continental by Region (Excluding Europe), 2013
PLT Tire Capacity of Continental Europe by Region, 2012
PLT Tire Capacity of Continental Europe by Region, 2013
CV Tire Capacity of Continental by Region, 2012
CV Tyre Capacity of Continental by Region, 2013
PLT Tire Sales Volume of Continental, 2008-2013
CV Tire Sales Volume of Continental, 2008-2013
Revenue and Operating Margin of Sumitomo Rubber Group, 2007-2014
Revenue of Sumitomo Rubber Group by Region, 2007-2013
Revenue of Sumitomo Rubber Group by Product, 2007-2013
Operating Profit of Sumitomo Rubber Group by Product, 2007-2013
Sales Volume of Sumitomo Rubber Group by Region beyond Japan, 2009-2014
Tire Output and Capacity Utilization of Sumitomo Rubber Group, 2006-2014
Output and Capacity Utilization of Sumitomo Rubber Group, 2006-2014
Tire Application of Sumitomo Rubber Group
Revenue of Sumitomo Rubber Group in China
Revenue and Operating Margin of Pirelli, 2006-2013
EBIT Bridge of Pirelli Tire, 2012-2013
Revenue of Pirelli Tire by Business, 2006-2013
Raw Material Cost of Pirelli Tire, 2012
Raw Material Cost of Pirelli Tire, 2013
Revenue of Pirelli Tyre by Product, 2013
Revenue of Pirelli Tyre by Region, 2012
Revenue of Pirelli Tyre by Region, 2013
Workforce of Pirelli by Region, 2012
Workforce of Pirelli by Region, 2013
Distribution of Pirelli Worldwide
Sales Value and Operating Profit of Yokohama Rubber, 2006-2014
Revenue of Yokohama Rubber by Region, 2006-2013
Global Capacity of Yokohama Rubber, 2009-2014
Revenue and Operating Margin of Hankook, 2003-2013
Sales and Operating Margin of Hankook, 2010Q2-2013Q4
Quarterly Sales Value of Hankook in South Korea and China, 2012Q4-2013Q4
Quarterly Sales Value of Hankook in Europe and North America, 2012Q4-2013Q4
Output of Hankook by Region, 2005-2014
Prices of Natural Rubber and Synthetic Rubber, 2011Q4-2013Q4
Application of Hankook for OE Auto Models
Revenue and Operating Margin of COOPER, 2004-2013
Revenue of COOPER by Region, 2006-2013
Sales Value of COOPER by Product, 2012
Revenue and Operating Margin of Kumho Tire, 2005-2013
Capacity Distribution of Kumho Tire
Shipment and ASP of Kumho Tire, 2009-2013
Quarterly Capacity Utilization of Kumho Tire Worldwide, 2012Q1-2013Q4
Output of Kumho Tire by Region, 2012-2013
Revenue and Operating Margin of Toyo Tire &Rubber, 2004-2013
Revenue of Toyo Tire &Rubber by Region, 2007-2013
Output of Toyo Tire &Rubber, 2008-2013
Changes of Toyo Tire &Rubber in Capital Investment and in Depreciation, 2010-2014
Revenue and Net Margin of Apollo Tires, FY2007-FY2014
Sales Value of Apollo Tires by Product, FY2012
Output and EBITDA Rate of Apollo Tires, FY2007-FY2011
Sales Value and Capacity of Apollo Tires by Region, FY2012
Revenue of Apollo Tyres by Region
Operating Profit of Apollo Tyres by Region
Revenue and Profit of MRF, FY2005-FY2013
Distribution of MRF Plants
Revenue and Operating Margin of Nokian, 2004-2013
Sales Value of Nokian by Destination, 2012
Sales Value of Nokian by Destination, 2013
Sales Value of Nokian by Region, 2012
Raw Material Consumption of Nokian, 2012
Cost of Nokian, 2012-2013
Revenue of Nokian in Russia and CIS, 2003-2012
Revenue and Operating Margin of Cheng Shin Tire, 2003-2013
Revenue of Cheng Shin Tire by Region, 2011-2013
Global Distribution of Plants under Cheng Shin Tire
Brief of Cheng Shin Tire’s Plants
Revenue of Cheng Shin Tire by Product, 2012-2013
Revenue of Cheng Shin Tire by Subsidiary, 2013
Revenue of Cheng Shin Tire by OE & RE Customer, 2013
Application of Cheng Shin Tire in China by Model
Revenue and Operating Margin of Hangzhou Zhongce Rubber from Rubber Business, 2007-2012
Revenue and Output of Hangzhou Zhongce Rubber from Rubber Business, 2007-2012
Organization Structure of Hangzhou Zhongce Rubber
Revenue and Operating Margin of Triangle Tire, 2007-2012
Revenue and Output of Triangle Tire, 2007-2012
Revenue and Operating Margin of Linglong Tire, 2007-2011
Revenue and Output of Linglong Tire, 2007-2011
Revenue and Operating Margin of Aeolus Tire, 2006-2013
Organization Structure of Aeolus Tire
Shareholders of Aeolus Tire
Revenue and Operating Margin of Double Coin, 2005-2013
Organization Structure of Shanghai Tire Group
Revenue and Operating Margin of Guizhou Tire, 2006-2013
Revenue and Operating Margin of Qingdao Double Star, 2004-2013
Revenue and Operating Margin of Xingyuan, 2007-2013
Operating Margin of Sailun Group, 2009-2013
Cost Structure of Sailun Group, 2012-2013
Revenue of Sailun Group by Product, 2009-2014
Gross Margin of Sailun Group by Product, 2009-2014
Revenue and Operating Income of Giti Tire, 2006-2013
如果这份报告不能满足您的要求,我们还可以为您定制报告,请 留言说明您的详细需求。
|