|
|
|
报告导航:研究报告—
制造业—化工
|
|
2013-2016年全球及中国天然橡胶产业研究报告 |
 |
字数:1.8万 |
页数:69 |
图表数:72 |
|
中文电子版:6500元 |
中文纸版:3250元 |
中文(电子+纸)版:7000元 |
|
英文电子版:1600美元 |
英文纸版:1700美元 |
英文(电子+纸)版:1900美元 |
|
编号:CYH025
|
发布日期:2014-04 |
附件:下载 |
 |
|
|
自2011年以来,全球天然橡胶市场一直处于供过于求的状态,2011年供给过剩22万吨,2013年增加至41万吨,预计2014年在54万吨左右。受此影响,全球天胶价格一路走低,2013年,中国期胶价格较2011年下跌41.2%左右,预计2014年市场价格将继续弱势运行。
目前,全球天然橡胶消费市场主要集中在中国、欧洲、印度和美国等国家/地区,2013年这4大国家/地区共消费全球59.6%的天然橡胶。其中,中国消费量最大,为415.6万吨,占全球的34.9%。
然而,受天然橡胶种植地域、气候等条件限制,全球天然橡胶生产主要集中在泰国、印尼、越南等东南亚和非洲国家,相对而言,中国产量较低,2013年为85.6万吨,只占全球的7.3%。
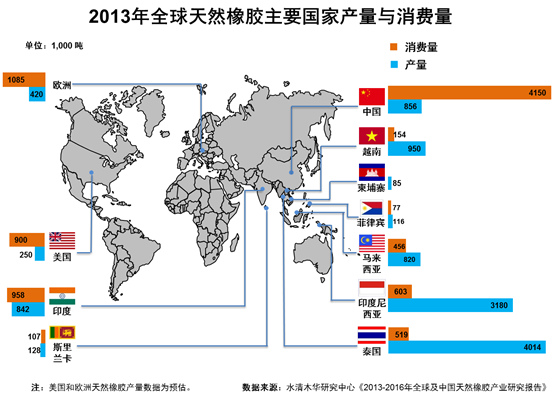
由于市场供需严重失衡,中国天然橡胶主要依赖进口,2013年共进口天然橡胶247.23万吨,同比增长13.6%。其中,来自泰国、印尼、马来西亚三国的天然橡胶占到同期中国总进口量的87.9%。
近年来,中国也在不断扩大橡胶种植面积。2005-2008年曾种植大批胶树,2014年之后其将陆续进入开割期,届时中国天然橡胶产量将得到大幅提升,预计到2016年将有望突破100万吨。
水清木华研究中心《2013-2016年全球及中国天然橡胶产业研究报告》着重研究了以下内容:
 全球天然橡胶市场供需、地区分布、市场价格等; 全球天然橡胶市场供需、地区分布、市场价格等;
中国天然橡胶市场供需、进出口、竞争格局等;
全球及中国天然橡胶割胶面积、种植面积等;
轮胎、胶带胶管等中国天然橡胶下游应用发展情况等;
全球4家天然橡胶企业经营情况及在华发展等;
中国5家天然橡胶重点企业经营情况及发展战略等。
中化国际、海南橡胶、广垦橡胶、云垦集团等是中国天然橡胶主要生产商,在中国实施天然橡胶企业“走出去”发展战略推动下,各大企业加速扩展海外业务。
中化国际是中国最大橡胶综合经营服务商。近几年,公司通过收购整合国内外天然胶加工厂以及种植园,不断扩大天然橡胶业务规模。截止2013年底,公司已拥有中国、非洲、东南亚等地区18万公顷天然橡胶可种植土地,具备68万吨/年橡胶加工能力。
海南橡胶是中国天然橡胶主要生产企业之一。截止2013年底,公司已在海南和云南掌控21家橡胶加工厂,合计天然橡胶加工能力达43万吨/年。此外,继2012年公司并购橡胶贸易巨头新加坡R1公司后,2013年7月,公司又在非洲塞拉利昂成立合资公司——拟种植10万公顷天然橡胶,并规划建设天然橡胶加工厂等。
广垦橡胶自2004年开始拓展海外业务,至2014年1月底,集团海外项目共有19个,总投资规模80亿元,橡胶种植面积300万亩。若各项目如期达产,届时公司天然橡胶年产能可达100万吨以上 。
Since 2011, global natural rubber market has remained oversupplied with surplus amounting to 220,000 tons in 2011, 410,000 tons in 2013 and expected to soar to about 540,000 tons in 2014. Affected by this, global natural rubber prices have been falling. In 2013, natural rubber futures prices in China plummeted by 41.2% over 2011, and is expected to continue to decline.
Currently, global natural rubber consumption markets are mainly concentrated in China, Europe, India and the United States, with the four countries and regions making up 59.6% of global natural rubber consumption in 2013. Among them, China was the largest consumer, reaching up to 4.156 million tons, or 34.9% of the world's total.
However, limited by planting region, climate and so on, global natural rubber production is primarily concentrated in Southeast Asia including Thailand, Indonesia and Vietnam and African countries. In relative terms, output of natural rubber in China is rather low, only 856,000 tons in 2013, or 7.3% of global total.
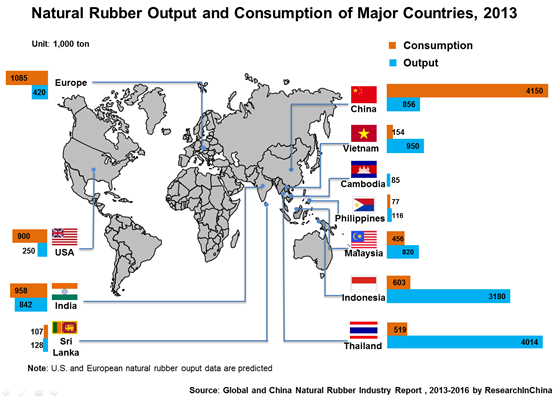
Due to grave imbalance between market supply and demand, China imports most of natural rubber from abroad, with import volume totaling 2.4723 million tons in 2013, an increase of 13.6% year on year. Among them, 87.9% came from Thailand, Indonesia and Malaysia over the same period.
In recent years, China has been expanding rubber planting area. Rubber trees which were planted in 2005-2008 will be tapped in succession from 2014, and then output of natural rubber in China will increase dramatically, with the output expected to exceed 1 million tons in 2016.
Global and China Natural Rubber Industry Report, 2013-2016 by ResearchInChina highlights:
Supply and Demand, Regional Distribution and Prices of Global Natural Rubber
Supply and Demand, Import and Export and Competition Pattern of Natural Rubber in China
Tapping Area and Planting Area of Natural Rubber in China and around the World
Application of Natural Rubber in China, such as Tire, Rubber Belt and Rubber Hose
Operation and Development in China of 4 Global Natural Rubber Companies
Operation and Development Strategy of 5 Key Chinese Natural Rubber Companies
Sinochem International, China Hainan Rubber Industry Group, Guangdong Guangken Rubber Group and Yunnan State Farms Group are the leading Chinese natural rubber producers. Propelled by “going out” strategy for Chinese natural rubber companies, they have accelerated the expansion of overseas business.
Sinochem International Corporation is the largest provider with comprehensive operation in the field of natural rubber. The company, through acquisition and integration of natural rubber processing factories and plantations at home and abroad, has continued to expand its natural rubber business. As of the end of 2013, the company had 180,000 hectares of land for natural rubber, with processing capacity of 680,000 tons/a of rubber.
China Hainan Rubber Industry Group Co., Ltd. is a key natural rubber producer in China. By the end of 2013, the company had controlled 21 rubber factories in Hainan and Yunnan with combined processing capacity of 430,000 tons/a of natural rubber. In addition, following its acquisition of Singaporean rubber trading giant R1, the company established a joint venture in July 2013 in Sierra Leone, with the aim of planting 100,000 hectares of natural rubber and intending to build a natural rubber processing plant.
Guangdong Guangken Rubber Group Co., Ltd. began to expand its overseas business from 2004 and by the end of January 2014 the Group had 19 overseas projects, with total investment of RMB 8 billion and 3 million mu (1 hectare equals to 15 mu) of rubber planting area. If all projects can reach designed capacity on schedule, the company will be able to produce over 1 million tons of natural rubber annually.
第一章天然橡胶基础概念
1.1 定义
1.2 分类
第二章全球天然橡胶市场发展概况
2.1 发展现状
2.2 市场供给
2.3 市场需求
2.4 价格分析
第三章中国天然橡胶市场发展概况
3.1 发展现状
3.2 市场供给
3.3 市场需求
3.4 进出口
3.4.1 进口
3.4.2 出口
第四章全球及中国天然橡胶相关产业发展
4.1 天然橡胶种植情况
4.2 天然橡胶应用情况
4.2.1 轮胎行业
4.2.2 其他橡胶制品业
4.3 合成橡胶
4.3.1 合成橡胶VS天然橡胶
4.3.2 合成橡胶供需现状
4.3.3 合成橡胶取代天然橡胶最新进展
第五章全球重点生产企业
5.1 泰国诗董橡胶股份有限公司
5.1.1 企业简介
5.1.2 经营情况
5.1.3 营收构成
5.1.4 产能和产销量
5.1.5 在华发展
5.1.6 发展战略
5.2 泰国橡胶集团有限公司(TRUBB)
5.2.1 企业简介
5.2.2 经营情况
5.2.3 营收构成
5.2.4 产能及销量
5.2.5 在华发展
5.2.6 发展战略
5.3 泰华树胶(大众)有限公司
5.3.1 企业简介
5.3.2 产能
5.3.3 在华发展
5.4 宏曼历有限公司
5.4.1 企业简介
5.4.2 产能
第六章中国重点企业
6.1 海南天然橡胶产业集团股份有限公司(601118)
6.1.1 企业简介
6.1.2 经营情况
6.1.3 营收构成
6.1.4 毛利率
6.1.5 在建工程
6.1.6 产销量
6.1.7 发展战略
6.2 中化国际(控股)股份有限公司(600500)
6.2.1 企业简介
6.2.2 经营情况
6.2.3 营收构成
6.2.4 毛利率
6.2.5 天然橡胶业务
6.3 云南农垦集团有限责任公司
6.3.1 企业简介
6.3.2 云南天然橡胶产业股份有限公司
6.3.3 西双版纳景阳橡胶公司
6.3.4 江城橡胶公司
6.3.5 其他公司
6.4 广东省广垦橡胶集团有限公司
6.4.1 企业简介
6.4.2 经营情况
6.4.3 产能与产销量
6.4.4 橡胶业务投资
6.5 云南高深橡胶有限公司
第七章结论与预测
7.1 市场竞争
7.2 市场预测
1. Basic Concept of Natural Rubber
1.1 Definition
1.2 Classification
2. Development of Global Natural Rubber Market
2.1 Status Quo
2.2 Supply
2.3 Demand
2.4 Prices
3. Development of China Natural Rubber Market
3.1 Status Quo
3.2 Supply
3.3 Demand
3.4 Import and Export
3.4.1 Import
3.4.2 Export
4. Global and China Natural Rubber-related Industries
4.1 Plantation
4.2 Application
4.2.1 Tyre Industry
4.2.2 Other Rubber Products Industries
4.3 Synthetic Rubber
4.3.1 Synthetic Rubber VS Natural Rubber
4.3.2 Supply and Demand of Synthetic Rubber
4.3.3 Latest Development in the Substitution of Synthetic Rubber for Natural Rubber
5. Key Global Players
5.1 Sri Trang Agro-Industry Plc.
5.1.1 Profile
5.1.2 Operation
5.1.3 Revenue Structure
5.1.4 Capacity, Output and Sales Volume
5.1.5 Development in China
5.1.6 Development Strategy
5.2 Thai Rubber Latex Corporation (Thailand) Public Co., Ltd. (TRUBB)
5.2.1 Profile
5.2.2 Operation
5.2.3 Revenue Structure
5.2.4 Capacity and Sales Volume
5.2.5 Development in China
5.2.6 Development Strategy
5.3 Thai Hua Rubber Public Co., Ltd.
5.3.1 Profile
5.3.2 Capacity
5.3.3 Development in China
5.4 Von Bundit Co., Ltd.
5.4.1 Profile
5.4.2 Capacity
6 Major Chinese Companies
6.1 China Hainan Rubber Industry Group Co., Ltd. (601118)
6.1.1 Profile
6.1.2 Operation
6.1.3 Revenue Structure
6.1.4 Gross Margin
6.1.5 Projects under Construction
6.1.6 Output and Sales Volume
6.1.7 Development Strategy
6.2 Sinochem International Corporation (600500)
6.2.1 Profile
6.2.2 Operation
6.2.3 Revenue Structure
6.2.4 Gross Margin
6.2.5 Natural Rubber Business
6.3 Yunnan State Farms Group Co., Ltd.
6.3.1 Profile
6.3.2 Yunnan Natural Rubber Industry Co., Ltd.
6.3.3 Xishuangbanna Jingyang Rubber Co., Ltd.
6.3.4 Jiangcheng Rubber Company
6.3.5 Others
6.4 Guangdong Guangken Rubber Group Co., Ltd.
6.4.1 Profile
6.4.2 Operation
6.4.3 Capacity, Output and Sales Volume
6.4.4 Investment in Rubber Business
6.5 Yunnan Gaoshen Rubber Co., Ltd.
7. Conclusion and Forecast
7.1 Market Competition
7.2 Market Forecast
表:天然橡胶的特性
表:天然橡胶的分类
图:2008-2013年全球天然橡胶产量及同比增长
图:2013年全球(分国家)天然橡胶产量
图:2008-2013全球天然橡胶消费量及同比增长
图:2013年全球天然橡胶(分国家)消费量构成
表:2009-2013年世界主要国家天然橡胶政策
图:2011-2014年中国天然橡胶期货价格
图:2008-2013年中国天然橡胶产量及同比增长
图:2008-2013年中国天然橡胶消费量及同比增长
表:2006-2014年中国天然橡胶进口关税政策
图:2004-2013年中国天然橡胶进口量及同比增长
表:2007-2013年中国天然橡胶(分国家)进口量
图:2012-2013年中国天然橡胶进口量(分产品)构成
图:2003-2013年中国天然橡胶出口量
图:2013年全球九大天然橡胶主产国天然橡胶总种植面积
表:2003-2013年全球九大天然橡胶主产国天然橡胶开割面积
表:2003-2013年全球天然橡胶主产国新种与翻种面积
图:全球天然橡胶主产国停割期
图:全球天然橡胶(分应用领域)消费量
图:轮胎企业(分原材料)成本构成
图:2008-2013年中国橡胶轮胎产量及同比增长
图:2008-2013年中国汽车产销量
表:2009-2013年中国汽车行业政策
图:2008-2013年中国胶管相关制造企业营业收入及同比增长
图:2008-2013年中国胶管制造企业毛利率
表:常用橡胶产品性能
表:2003-2013年中国合成橡胶产量与消费量
图:2013年诗董集团天然橡胶产业链
表:1987-2013年诗董集团重要发展事件
图:2008-2013年诗董集团营业收入与净利润
图:2013年诗董集团(分产品)主营业务收入构成
图:2013年诗董集团天然橡胶(分国家)主营业务收入构成
图:2013年诗董集团工厂和种植厂分布
图:2010-2013年诗董集团(分产品)天然橡胶销量
图:2011-2013年诗董集团天然橡胶在中国营业收入
图:2014年诗董集团战略计划
图:2008-2013年泰橡公司营业收入与净利润
表:2013年泰橡公司(分业务)子公司
图:2011-2013泰橡公司(分业务)收入构成
图:2013年泰橡公司(分业务)产能
表:2012-2013年泰橡公司(分业务)产品销量
图:2012-2013年泰橡公司在中国营业收入
表:泰华公司工厂与产能
表:2014年泰华公司(分产品)天然橡胶产能
图:2014年宏曼历附属子公司分布
表:2014年宏曼历天然橡胶(分产品)产能
图:2008-2013年海南橡胶营业收入与净利润
表:2010-2013年海南橡胶(分产品)营业收入构成
图:2009-2013年海南橡胶(分地区)主营业务收入构成
图:2009-2013年海南橡胶(分产品)毛利率
表:2013年海南橡胶在建项目
图:2007-2013年海南橡胶天胶产量
图:2008-2013年海南橡胶销量及同比增长
图:2008-2013年中化国际营业收入与净利润
图:2013年中化国际(分业务)主营业务收入构成
图:2012-2013年中化国际(分地区)主营业务收入构成
图:2009-2013年中化国际(分业务)毛利率
图:2009-2013年中化国际天然橡胶业务营业收入及同比增长
图:2010-2013年中化国际天然橡胶产能
图:2011-2013年云南农垦景阳橡胶公司天然橡胶产量
图:2011-2013年云垦江城橡胶公司天然橡胶产量
表:广垦集团海外子公司
图:2010-2013年广东广垦橡胶企业营业收入及同比增长
表:2010-2013年广垦集团橡胶业务(分产品)产能及产量
表:2010-2013年广垦橡胶公司(分产品/分地区)销量
表:2013年广垦集团橡胶主要在建项目
图:2013年全球及中国主要橡胶生产企业营业收入
表:2013年全球及中国主要天然橡胶生产企业天然橡胶产能
表:2013年中国重点天然橡胶生产企业天然橡胶产能、产销量及经营情况
表:2013-2016年全球天然橡胶产量与消费量及同比增长
表:2013-2016年中国天然橡胶产量与消费量及同比增长
Properties of Natural Rubber
Classification of Natural Rubber
Global Output and YoY Growth Rate of Natural Rubber, 2008-2013
Global Output of Natural Rubber by Country, 2013
Global Consumption and YoY Growth Rate of Natural Rubber, 2008-2013
Global Consumption Breakdown of Natural Rubber by Country, 2013
Major Countries’ Policies on Natural Rubber, 2009-2013
Natural Rubber Futures Prices in China, 2011-2014
Output and YoY Growth Rate of Natural Rubber in China, 2008-2013
Consumption and YoY Growth Rate of Natural Rubber in China, 2008-2013
Import Tariff Policies on Natural Rubber in China, 2006-2014
Import Volume and YoY Growth Rate of Natural Rubber in China, 2004-2013
Import Volume of Natural Rubber in China by Country, 2007-2013
Import Volume Breakdown of Natural Rubber in China by Product, 2012-2013
Export Volume of Natural Rubber in China, 2003-2013
Total Planting Area of the World’s Nine Largest Natural Rubber Producing Countries, 2013
Tapping Area of Natural Rubber of the World’s Nine Largest Natural Rubber Producing Countries, 2003-2013
New Planting & Replanting Area of the World’s Major Natural Rubber Producing Countries, 2003-2013
Stoppage Periods of the World’s Major Natural Rubber Producing Countries
Global Natural Rubber Consumption by Application
Cost Structure of Tyre Enterprises by Raw Materials
Output and YoY Growth Rate of Rubber Tyre in China, 2008-2013
Automobile Output and YoY Growth Rate in China, 2008-2013
Chinese Policies on Automobile Industry, 2009-2013
Revenue and YoY Growth Rate of Rubber Hose-related Manufacturers in China, 2008-2013
Gross Margins of Rubber Hose Manufacturers in China, 2008-2013
Performance of Popular Rubber Products
Output and Consumption of Synthetic Rubber in China, 2003-2013
Natural Rubber Industry Chain of Sri Trang, 2013
Milestones in the Development of Sri Trang, 1987-2013
Revenue and Net Income of Sri Trang, 2008-2013
Operating Revenue Structure of Sri Trang by Product, 2013
Operating Revenue Structure of Natural Rubber Business of Sri Trang by Country, 2013
Distribution of Factories and Plantations of Sri Trang, 2013
Natural Rubber Sales Volume of Sri Trang by Product, 2010-2013
Revenue of Sri Trang from China, 2011-2013
Strategic Planning of Sri Trang, 2014
Revenue and Net Income of TRUBB, 2008-2013
Subsidiaries of TRUBB by Business, 2013
Revenue Structure of TRUBB by Business, 2011-2013
Capacity of TRUBB by Business, 2013
Sales Volume of TRUBB by Business, 2012-2013
Revenue of TRUBB from China, 2012-2013
Factories and Capacity of Thai Hua Rubber Public Company Ltd.
Natural Rubber Capacity of Thai Hua Rubber Public Company Ltd. by Product, 2014
Distribution of Von Bundit’s Affiliated Companies, 2014
Natural Rubber Capacity of Von Bundit by Product, 2014
Revenue and Net Income of Hainan Rubber Group, 2008-2013
Revenue Structure of Hainan Rubber Group by Product, 2010-2013
Operating Revenue of Hainan Rubber Group by Region, 2009-2013
Gross Margin of Hainan Rubber Group by Product, 2009-2013
Projects under Construction of Hainan Rubber Group, 2013
Natural Rubber Output of Hainan Rubber Group, 2007-2013
Sales Volume and YoY Growth Rate of Hainan Rubber Group, 2008-2013
Revenue and Net Income of Sinochem International, 2008-2013
Operating Revenue Structure of Sinochem International by Business, 2013
Operating Revenue Structure of Sinochem International by Region, 2012-2013
Gross Margin of Sinochem International by Business, 2009-2013
Revenue and YoY Growth Rate of Natural Rubber Business of Sinochem International, 2009-2013
Natural Rubber Capacity of Sinochem International, 2010-2013
Natural Rubber Output of Jingyang Rubber Company of Yunnan State Farms Group, 2011-2013
Natural Rubber Output of Jiangcheng Rubber Company of Yunnan State Farms Group, 2011-2013
Overseas Subsidiaries of Guangdong Guangken Rubber Group
Revenue and YoY Growth Rate of Rubber Companies of Guangdong Guangken Rubber Group, 2010-2013
Rubber Capacity and Output of Guangdong Guangken Rubber Group by Product, 2010-2013
Sales Volume of Rubber Companies of Guangdong Guangken Rubber Group by Product/Region, 2010-2013
Major Projects under Construction of Guangdong Guangken Rubber Group, 2013
Revenue of Key Global and Chinese Rubber Producers, 2013
Natural Rubber Capacity of Key Global and Chinese Natural Rubber Producers, 2013
Natural Rubber Capacity, Output, Sales Volume and Operation of Key Chinese Natural Rubber Producers, 2013
Global Output, Consumption and YoY Growth Rate of Natural Rubber, 2013-2016E
Output, Consumption and YoY Growth Rate of Natural Rubber in China, 2013-2016E
如果这份报告不能满足您的要求,我们还可以为您定制报告,请 留言说明您的详细需求。
|