|
|
|
报告导航:研究报告—
生命科学—制药医疗
|
|
2013-2016年中国便携式医疗设备行业研究报告 |
 |
字数:2.4万 |
页数:77 |
图表数:79 |
|
中文电子版:7500元 |
中文纸版:3750元 |
中文(电子+纸)版:8000元 |
|
英文电子版:1800美元 |
英文纸版:1900美元 |
英文(电子+纸)版:2100美元 |
|
编号:ZLC-002
|
发布日期:2014-04 |
附件:下载 |
 |
|
|
在各项利好政策、人们生活水平提高以及医疗保健意识提升等因素推动下,中国便携式医疗设备行业近年来发展较快。2008-2013年中国便携式医疗设备市场规模年复合增长率达28.3%,其中2013年其市场规模约为442.1亿元。
考虑到目前中国便携式医疗设备普及率仍然很低(如家用血糖仪市场普及率不足10%,而欧美发达国家已达90%。)以及老龄化不断加剧等因素,预计2013-2016年中国便携式医疗设备市场规模有望继续保持25%以上速度增长。
中国便携式医疗设备主要分为家用便携式医疗设备和医用便携式医疗设备,2013年两者的市场份额占比在2:1左右。便携式血糖仪、电子血压计和电子助听器是中国家用便携式医疗设备市场三大主要产品,2013年其合占中国家用便携式医疗设备市场93.6%的份额。
目前,中国便携式医疗设备行业仍主要被外资企业占据,以家用电子血压计和便携式血糖仪市场为例。2013年,日本欧姆龙占据中国电子血压计市场60%以上的份额,而紧随其后的本土企业--九安医疗市场占比仅为15%左右;美国强生和瑞士罗氏分别占中国便携式血糖仪市场35%、20%的份额,而排名第三、四的本土企业--怡成生物和三诺生物合占该市场的比重仅为25%。
中国医用便携式医疗设备包括便携式多参数监护仪、便携式超声诊断仪、便携式心电图机、介入式医疗设备、便携式母婴监护仪等。其中便携式多参数监护仪和便携式超声诊断仪所占市场份额相对更高,2013年这两者分别占中国医用便携式医疗设备市场的32.5%和25.0%。
《2013-2016年中国便携式医疗设备行业研究报告》主要包括以下几个方面:
 中国便携式医疗设备行业发展现状、相关政策、市场规模、竞争格局以及发展趋势等; 中国便携式医疗设备行业发展现状、相关政策、市场规模、竞争格局以及发展趋势等;
中国家用、医用便携式医疗设备细分产品的发展现状、竞争格局等;
全球4家、中国8家便携式医疗设备重点企业的运营状况、在华发展以及前景预测等。
With the synergy of favorable policies, improvement in living standards and healthcare awareness raising, China’s portable medical device industry has shown rapid development in recent years, with market size growing at a CAGR of 28.3% in 2008-2013 to approximately RMB44.21 billion in 2013.
Allowing for the low penetration of portable medical devices (for example, market penetration of household glucometer is under 10% as opposed to the level of 90% in Europe, the United States and other developed countries), increasingly aging population, etc., China’s portable medical device market size is expected to remain above 25% growth rate in 2013-2016.
In China, portable medical devices are mainly used for home and clinical purposes, with market share of roughly 2:1 in 2013. Portable glucometer, electronic sphygmomanometer and electronic hearing aid as three hit products of China’s home-use portable medical device market accounted for a combined 93.6% in 2013.
Thus far, foreign-funded enterprises seize lion's share of China’s portable medical device market. Take household electronic sphygmomanometer and portable glucometer markets in 2013 for example, Japan-based OMRON accounted for more than 60% of China’s electronic sphygmomanometer market, followed by Andon Health, a domestic player whose market share was merely around 15%; America-based Johnson & Johnson and Switzerland-based Roche took 35% and 20% share of the Chinese portable glucometer market, separately, while the third and fourth-ranked domestic counterparts – Yicheng Bioelectronics and Sinocare only saw a combined share of 25%.
In China, clinical-use portable medical devices refer to portable multi-parameter monitor, portable diasonograph, portable electrocardiograph, interventional medical devices, portable fetal monitor, etc., of which, portable multi-parameter monitor and portable diasonograph occupy higher market share, respectively 32.5% and 25.0% of clinical-use portable medical device market in 2013.
The report highlights the followings:
Status quo, related polices, market share, competition pattern, trends, etc. of portable medical device industry in China;
Status quo, competition pattern, etc. of Chinese home-use and clinical-use portable medical device product segments;
Operation, development in China and forecast of 4 international and 8 domestic portable medical device enterprises;
第一章 便携式医疗设备概述
第二章 中国便携式医疗设备市场概况
2.1 发展现状
2.2 相关政策
2.3 市场规模
2.4 发展趋势
2.4.1 本土企业市场份额提升
2.4.2 可穿戴医疗设备兴起
2.4.3医疗服务更为便捷,服务范围不断扩大
2.4.4 市场前景广阔
第三章 中国家用便携式医疗设备
3.1 产品结构
3.2 电子血压计
3.3 便携式血糖仪
3.4 数字助听器
第四章 中国医用便携式医疗设备
4.1 产品结构
4.2 便携式多参数监护仪
4.3 便携式超声诊断仪
4.4 介入式医疗设备
4.4.1 胰岛素泵
4.4.2 植入式心脏起搏器
4.4.3 胶囊式内窥镜
4.5 便携式心电图机
4.6 智能输液泵
第五章 国外重点企业
5.1 强生(Johnson & Johnson)
5.1.1 公司介绍
5.1.2 经营情况
5.1.3 便携式医疗设备
5.1.4 在华发展
5.2 欧姆龙 (OMRON)
5.2.1 公司介绍
5.2.2 经营情况
5.2.3 便携式医疗设备
5.2.4 在华发展
5.3 爱安德 (A&D)
5.3.1 公司介绍
5.3.2 经营情况
5.3.3 便携式医疗设备
5.3.4 在华发展
5.4 罗氏(Roche)
5.4.1 公司介绍
5.4.2 经营情况
5.4.3 便携式医疗设备
5.4.4 在华发展
第六章 中国重点企业
6.1 鱼跃医疗
6.1.1 公司介绍
6.1.2 经营情况
6.1.3 营收构成
6.1.4 毛利率
6.1.5 研发与投资
6.1.6 预测与展望
6.2 九安医疗
6.2.1公司介绍
6.2.2 经营情况
6.2.3 营收构成
6.2.4 毛利率
6.2.5 预测与展望
6.3 三诺生物
6.3.1 公司介绍
6.3.2 经营情况
6.3.3 营收构成
6.3.4 毛利率
6.3.5 研发与投资
6.3.6 预测与展望
6.4 蒙发利
6.4.1 公司介绍
6.4.2 经营情况
6.4.3 营收构成
6.4.4 毛利率
6.4.5 研发与投资
6.4.6 便携式医疗设备
6.4.7 预测与展望
6.5 宝莱特
6.5.1 公司介绍
6.5.2 经营情况
6.5.3 营收构成
6.5.4 毛利率
6.5.5 研发与投资
6.5.6 预测与展望
6.6 迈瑞医疗
6.6.1 公司介绍
6.6.2 经营情况
6.6.3 营收构成
6.6.4 毛利率
6.6.5 研发与投资
6.6.6 便携式医疗设备
6.6.7 预测与展望
6.7 理邦仪器
6.7.1 公司介绍
6.7.2 经营情况
6.7.3 营收构成
6.7.4 毛利率
6.7.5 研发
6.7.6 预测与展望
6.8 怡成生物
6.8.1 企业介绍
第七章 总结与预测
7.1 中国便携式医疗设备行业市场规模预测
7.2 主要企业经营对比
7.2.1 营业收入
7.2.2 净利润率
7.2.3 毛利率
7.2.4 研发投入
1. Overview of Portable Medical Device
2. China Portable Medical Device Market
2.1 Status Quo
2.2 Related Policies
2.3 Market Size
2.4 Trends
2.4.1 Increasing Market Share of Domestic Enterprises
2.4.2 Emergence of Wearable Medical Devices
2.4.3 More Convenient and Extending Medical Service
2.4.4 Promising Market
3. Home-Use Portable Medical Devices in China
3.1 Product Structure
3.2 Electronic Sphygmomanometer
3.3 Portable Glucometer
3.4 Digital Hearing Aid
4. Clinical-Use Portable Medical Devices in China
4.1 Product Structure
4.2 Portable Multi-Parameter Monitor
4.3 Portable Diasonograph
4.4 Interventional Medical Devices
4.4.1 Insulin Pump
4.4.2 Implantable Cardiac Pacemaker
4.4.3 Capsule Endoscopy
4.5 Portable Electrocardiograph
4.6 Intelligent Infusion Pump
5. Leading Overseas Enterprises
5.1 Johnson & Johnson
5.1.1 Profile
5.1.2 Operation
5.1.3 Portable Medical Device
5.1.4 Development in China
5.2 OMRON
5.2.1 Profile
5.2.2 Operation
5.2.3 Portable Medical Device
5.2.4 Development in China
5.3 A&D
5.3.1 Profile
5.3.2 Operation
5.3.3 Portable Medical Device
5.3.4 Development in China
5.4 Roche
5.4.1 Profile
5.4.2 Operation
5.4.3 Portable Medical Device
5.4.4 Development in China
6. Leading Chinese Enterprises
6.1 Yu Yue Medical
6.1.1 Profile
6.1.2 Operation
6.1.3 Revenue Structure
6.1.4 Gross Margin
6.1.5 R&D and Investment
6.1.6 Prediction & Expectation
6.2 Andon Health
6.2.1 Profile
6.2.2 Operation
6.2.3 Revenue Structure
6.2.4 Gross Margin
6.2.5 Prediction & Expectation
6.3 Sinocare
6.3.1 Profile
6.3.2 Operation
6.3.3 Revenue Structure
6.3.4 Gross Margin
6.3.5 R&D and Investment
6.3.6 Prediction & Expectation
6.4 Xiamen Comfort Science&Technology Group
6.4.1 Profile
6.4.2 Operation
6.4.3 Revenue Structure
6.4.4 Gross Margin
6.4.5 R&D and Investment
6.4.6 Portable Medical Device
6.4.7 Prediction & Expectation
6.5 Guangdong Biolight Meditech
6.5.1 Profile
6.5.2 Operation
6.5.3 Revenue Structure
6.5.4 Gross Margin
6.5.5 R&D and Investment
6.5.6 Prediction & Expectation
6.6 Mindray Medical International Limited
6.6.1 Profile
6.6.2 Operation
6.6.3 Revenue Structure
6.6.4 Gross Margin
6.6.5 R&D and Investment
6.6.6 Portable Medical Device
6.6.7 Prediction & Expectation
6.7 Edan Instruments
6.7.1 Profile
6.7.2 Operation
6.7.3 Revenue Structure
6.7.4 Gross Margin
6.7.5 R&D
6.7.6 Prediction & Expectation
6.8 Yicheng Bioelectronics
6.8.1 Profile
7. Conclusion & Outlook
7.1 Forecasting for China Portable Medical Device Market Size
7.2 Operating Contrast
7.2.1 Revenue
7.2.2 Net Margin
7.2.3 Gross Margin
7.2.4 R&D Input
表:便携式医疗设备分类
图:2004-2013年中国65岁及以上老年人数及占总人口比例
图:2008-2013年中国便携式医疗设备市场规模
图:2013年中国家用便携式医疗设备产品结构
表:不同血压计优缺点比较
图:2013年中国电子血压计市场竞争格局
表:血糖测试仪技术发展的五个阶段
图:2013年中国便携式血糖仪市场竞争格局
图:2013年中国各种医用便携式医疗设备所占份额
图:便携式多参数监护仪
图:2012-2017年全球胰岛素泵市场规模
图:2006-2013年中国心脏起搏器植入量
图:2009-2013年强生营业收入和净利润
图:2009-2013年强生毛利率
表:强生在华子公司
图:2009-2012年欧姆龙净销售额和净利润
图:2009-2012年欧姆龙在华净销售额及占同期公司总销售额比重
表:2009-2012年欧姆在华各部门净销售额
图:2009-2013年爱安德销售额和净利润
图:2009-2013年罗氏销售额和净利润
表:罗氏在华发展历程
图:2009-2013年鱼跃医疗营业收入和净利润
图:2009-2013年鱼跃医疗营收构成(按产品)
图:2009-2013年鱼跃医疗营收构成(按地区)
图:2009-2013年鱼跃医疗毛利率
图:2009-2013年鱼跃医疗毛利率(按产品)
图:2009-2013年鱼跃医疗毛利率(按地区)
图:2010-2013年鱼跃医疗研发投入及所占营收比例
图:2012-2016E鱼跃医疗营业收入和净利润预测
图:2009-2013年九安医疗营业收入和净利润
图:2009-2013年九安医疗营业收入构成(按产品)
图:2009-2013年九安医疗营业收入构成(按地区)
图:2009-2013年九安医疗毛利率
图:2009-2013年九安医疗毛利率(按产品)
图:2009-2013年九安医疗毛利率(按地区)
图:2012-2016E九安医疗营业收入和净利润预测
图:2009-2013年三诺生物营业收入和净利润
图:2009-2013年三诺生物营业收入构成(按地区)
图:2009-2013年三诺生物营业收入构成(按产品)
图:2009-2013年三诺生物毛利率
图:2009-2013年三诺生物毛利率(按地区)
图:2009-2013年三诺生物毛利率(按产品)
图:2010-2013年三诺生物研发投入及所占营收比例
图:2012-2016E三诺生物营业收入和净利润预测
图:2009-2013年蒙发利营业收入和净利润
图:2009-2013年蒙发利营业收入构成(按地区)
图:2009-2013年蒙发利营业收入构成(按产品)
图:2009-2013年蒙发利毛利率
图:2009-2013年蒙发利毛利率(按地区)
图:2010-2013年蒙发利研发投入及所占营收比例
图:2012-2016E蒙发利营业收入和净利润预测
图:2009-2013年宝莱特营业收入和净利润
图:2009-2013年宝莱特营业收入构成(按产品)
图:2009-2013年宝莱特营业收入构成(按地区)
图:2009-2013年宝莱特毛利率
图:2009-2013年宝莱特毛利率(按产品)
图:2009-2013年宝莱特毛利率(按地区)
图:2010-2013年宝莱特研发投入及所占营收比例
图:2012-2016E宝莱特公司营业收入和净利润预测
图:2009-2013年迈瑞医疗营业收入和净利润
图:2009-2013年迈瑞医疗营业收入构成(按产品)
图:2009-2013年迈瑞医疗营业收入构成(按地区)
图:2009-2013年迈瑞医疗毛利率
图:2009-2013迈瑞医疗研发投入及所占营收比例
图:2012-2016E迈瑞医疗营业收入和净利润预测
图:2009-2013年理邦仪器营业收入和净利润
图:2009-2013年理邦仪器营业收入构成(按产品)
图:2009-2013年理邦仪器营业收入构成(按地区)
图:2009-2013年理邦仪器毛利率
图:2009-2013年理邦仪器毛利率(按产品)
图:2011-2013年理邦仪器研发投入及所占营收比例
图:2012-2016E理邦仪器营业收入和净利润预测
图:2012-2016E中国便携式医疗设备行业市场规模预测
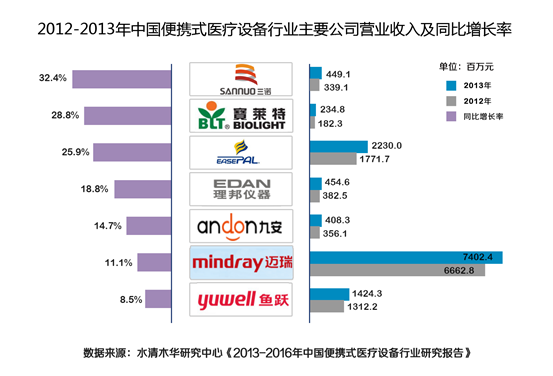
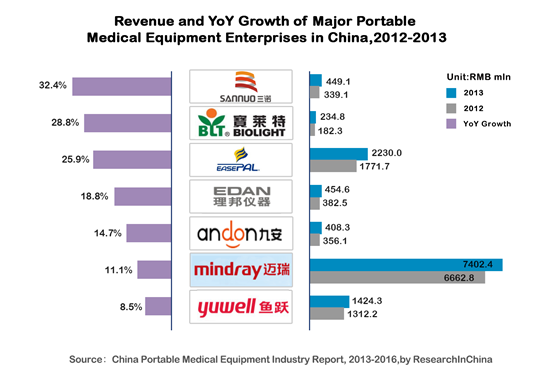
表:2009-2013年中国便携式医疗设备行业主要公司营业收入
图:2010-2013年中国便携式医疗设备行业主要公司营业收入同比增速
图:2009-2013年中国便携式医疗设备行业主要公司净利润率
图:2009-2013年中国便携式医疗设备行业主要公司毛利率
表:2010-2013年中国便携式医疗设备行业主要公司研发投入
图:2010-2013年中国便携式医疗设备行业主要公司研发投入占营收比
Classification of Portable Medical Devices
Population Ages 65 and Above % of Total in China, 2004-2013
China Portable Medical Device Market Size, 2008-2013
China Home-use Portable Medical Device Product Structure, 2013
Advantages and Disadvantages of Different Sphygmomanometers
Competition Pattern of China Electronic Sphygmomanometer Market, 2013
Five Stages of Technology Development for Blood Glucose Meter
Competition Pattern of China Portable Glucometer Market, 2013
China Clinical-Use Portable Medical Device Market Share by Variety, 2013
Portable Multi-parameter Monitor
Global Insulin Pump Market Size, 2012-2017E
Implantation Amount of Cardiac Pacemakers in China, 2006-2013
Revenue and Net Income of Johnson & Johnson, 2009-2013
Gross Margin of Johnson & Johnson, 2009-2013
Subsidiaries in China
Net Sales and Net Income of OMRON, 2009-2012
OMRON’s Net Sales in China and % of Total Sales, 2009-2012
OMRON’s Net Sales in China by Department, 2009-2012
Sales and Net Income of A&D, 2009-2013
Sales and Net Income of Roche, 2009-2013
Development History of Roche in China
Revenue and Net Income of Yu Yue Medical, 2009-2013
Revenue Structure of Yu Yue Medical by Product, 2009-2013
Revenue Structure of Yu Yue Medicalby Region, 2009-2013
Gross Margin of Yu Yue Medical, 2009-2013
Gross Margin of Yu Yue Medical by Product, 2009-2013
Gross Margin of Yu Yue Medical by Region, 2009-2013
R&D Input and % of Total Revenue of Yu Yue Medical, 2010-2013
Revenue and Net Income of Yu Yue Medical, 2012-2016E
Revenue and Net Income of Andon Health, 2009-2013
Revenue Structure of Andon Health by Product, 2009-2013
Revenue Structure of Andon Health by Region, 2009-2013
Gross Margin of Andon Health, 2009-2013
Gross Margin of Andon Health by Product, 2009-2013
Gross Margin of Andon Health by Region, 2009-2013
Revenue and Net Income of Andon Health, 2012-2016E
Revenue and Net Income of Sinocare, 2009-2013
Revenue Structure of Sinocare by Region, 2009-2013
Revenue Structure of Sinocare by Product, 2009-2013
Gross Margin of Sinocare, 2009-2013
Gross Margin of Sinocare by Region, 2009-2013
Gross Margin of Sinocare by Product, 2009-2013
R&D Input and % of Total Revenue of Sinocare, 2010-2013
Revenue and Net Income of Sinocare, 2012-2016E
Revenue and Net Income of Xiamen Comfort Science&Technology Group, 2009-2013
Revenue Structure of Xiamen Comfort Science&Technology Group by Region, 2009-2013
Revenue Structure of Xiamen Comfort Science&Technology Group by Product, 2009-2013
Gross Margin of Xiamen Comfort Science&Technology Group, 2009-2013
Gross Margin of Xiamen Comfort Science&Technology Group by Region, 2009-2013
R&D Input and % of Total Revenue of Xiamen Comfort Science&Technology Group, 2010-2013
Revenue and Net Income of Xiamen Comfort Science&Technology Group, 2012-2016E
Revenue and Net Income of Guangdong Biolight Meditech, 2009-2013
Revenue Structure of Guangdong Biolight Meditech by Product, 2009-2013
Revenue Structure of Guangdong Biolight Meditech by Region, 2009-2013
Gross Margin of Guangdong Biolight Meditech, 2009-2013
Gross Margin of Guangdong Biolight Meditech by Product, 2009-2013
Gross Margin of Guangdong Biolight Meditech by Region, 2009-2013
R&D Input and % of Total Revenue of Guangdong Biolight Meditech, 2010-2013
Revenue and Net Income of Guangdong Biolight Meditech, 2012-2016E
Revenue and Net Income of Mindray Medical International Limited, 2009-2013
Revenue Structure of Mindray Medical International Limited by Product, 2009-2013
Revenue Structure of Mindray Medical International Limited by Region, 2009-2013
Gross Margin of Mindray Medical International Limited, 2009-2013
R&D Input and % of Total Revenue of Mindray Medical International Limited, 2009-2013
Revenue and Net Income of Mindray Medical International Limited, 2012-2016E
Revenue and Net Income of Edan Instruments, 2009-2013
Revenue Structure of Edan Instruments by Product, 2009-2013
Revenue Structure of Edan Instruments by Region, 2009-2013
Gross Margin of Edan Instruments, 2009-2013
Gross Margin of Edan Instruments by Product, 2009-2013
R&D Input and % of Total Revenue of Edan Instruments, 2011-2013
Revenue and Net Income of Edan Instruments, 2012-2016E
China Portable Medical Device Market Size, 2012-2016E
Revenue of China’s Leading Portable Medical Device Enterprises, 2009-2013
YoY Revenue Growth of China’s Leading Portable Medical Device Enterprises, 2010-2013
Net Profit Margin of China’s Leading Portable Medical Device Enterprises, 2009-2013
Gross Margin of China’s Leading Portable Medical Device Enterprises, 2009-2013
R&D Input of China’s Leading Portable Medical Device Enterprises, 2010-2013
R&D Input and % of Total Revenue of China’s Leading Portable Medical Device Enterprises, 2010-2013
如果这份报告不能满足您的要求,我们还可以为您定制报告,请 留言说明您的详细需求。
|