|
|
|
报告导航:研究报告—
制造业—化工
|
|
2013-2016年全球及中国粘胶纤维行业研究报告 |
 |
字数:4.0万 |
页数:126 |
图表数:126 |
|
中文电子版:8500元 |
中文纸版:4250元 |
中文(电子+纸)版:9000元 |
|
英文电子版:2450美元 |
英文纸版:2650美元 |
英文(电子+纸)版:2750美元 |
|
编号:ALZ-003
|
发布日期:2014-04 |
附件:下载 |
 |
|
|
近些年,美日欧等发达国家因劳动成本、环保等原因纷纷退出粘胶纤维行业。而包括中国在内的亚太发展地区粘纤行业却进入了发展加速期,产能及产量有较大增长。2013年,全球粘胶纤维产量超过490万吨,同比提高13%以上,其中中国产量占比超过65%。
奥地利兰精公司和印度博拉集团是全球粘胶纤维龙头企业,2013年其产能均达80万吨/年以上。除这两家外,全球粘胶纤维产能较大的厂商主要为中国企业。
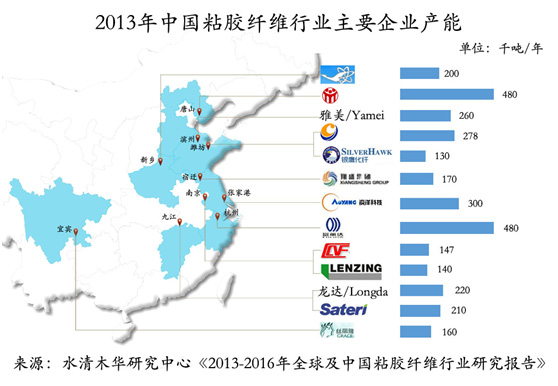
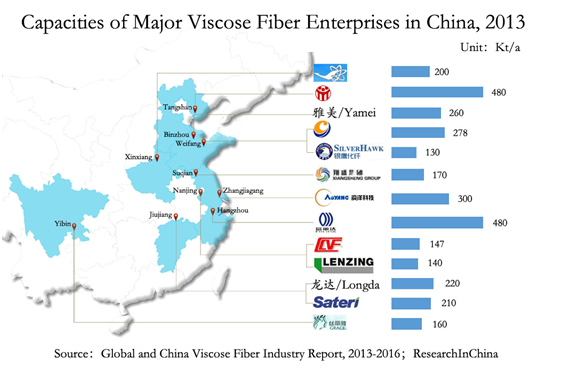
粘胶纤维包括粘胶长丝和粘胶短纤,中国的粘胶纤维产品主要为粘胶短纤,其产能/产量占比达90%左右。2013年,中国粘胶短纤产能约为345万吨,产能前五的企业分别为富丽达、三友化工、澳洋科技、恒天海龙、山东雅美,这5大厂商的粘胶短纤产能之和占该细分市场总产能的51.8%,行业集中度较高。
 2011-2013年,由于纺织行业内外需市场较差等原因,中国粘胶纤维价格总体呈下滑趋势,市场相对低迷。不过,基于行业前景看好以及公司自身发展需要等原因,三友化工、赛得利、新乡化纤等企业仍有产能扩大规划,产品主要往差别化、高端化方向发展。 2011-2013年,由于纺织行业内外需市场较差等原因,中国粘胶纤维价格总体呈下滑趋势,市场相对低迷。不过,基于行业前景看好以及公司自身发展需要等原因,三友化工、赛得利、新乡化纤等企业仍有产能扩大规划,产品主要往差别化、高端化方向发展。
三友化工是中国粘胶短纤行业差别化率最高的企业之一,产品差别化率达80%以上。随着16万吨/年差别化粘胶短纤项目的投产及部分生产线提产改造的完成,截至2013年底,三友化工粘胶短纤整体产能达48万吨/年,成为中国最大的粘胶短纤生产企业之一。此外,2014年,公司还计划通过技术改革释放5万吨产能增量。
赛得利粘胶纤维产能不是很大,截止2013年底,公司拥有21万吨/年的粘胶纤维产能;但它是中国最大的溶解木浆(粘胶纤维主要原料)供应商,占中国溶解木浆市场份额40%左右,成本优势明显。不过,赛得利也在加快下游粘胶纤维产能扩张,2014年赛得利福建工厂将新增15万吨/年差别化粘胶纤维产能(其中,2014年1月、3月已分别投产5万吨/年产能,剩下5万吨/年产能将于第三季度投产)。
新乡化纤是中国最大的粘胶长丝生产企业之一,2013年其粘胶长丝产能达6万吨/年。目前,新乡化纤子公司--新疆白鹭的“年产10万吨新型纤维素项目一期工程”已经建成,预计2014年上半年全面投产。
《2013-2016年全球及中国粘胶纤维行业研究报告》主要包括以下几个方面:
 全球粘胶纤维市场供给、区域结构、竞争格局、发展趋势等; 全球粘胶纤维市场供给、区域结构、竞争格局、发展趋势等;
中国粘胶纤维市场供给、产能状况、竞争格局、政策、进出口数据、价格分析等;
中国竹浆纤维细分市场现状及竞争格局等;
全球及中国18家粘胶纤维生产企业的运营状况、营收构成、毛利率、主要客户、粘胶纤维业务分析及发展情况等。
In recent years, the United States, Europe and Japan have successively withdrawn from the viscose fiber industry due to labor costs, environmental protection and other factors, while the Asia-Pacific Development Zone, including China, has entered a period of accelerated development of viscose fiber, with capacity and production increasing considerably. In 2013, the global viscose fiber output exceeded 4.9 million tons, up more than 13 % year on year, wherein, China contributed over 65%.
The Austria-based Lenzing Group and the India-based Aditya Birla Group as two viscose fiber giants worldwide gained capacity of above 800,000 tons/a each in 2013. But beyond that, Chinese counterparts also obtained greater capacity.
Viscose fiber includes viscose filament yarn (VFY) and viscose staple fiber (VSF), especially VSF capacity / output accounts for about 90% in China. In 2013, China’s VSF capacity approximated 3.45 million tons, 51.8% of which came from the top five enterprises, namely Fulida Group, Sanyou Chemical, Aoyang Technology, CHTC HELON and Shandong Yamei, showing a high industry concentration.
In 2011-2013, the sluggish textile industry pulled down China’s overall prices of viscose fiber, resulting in a market downturn. However, based on promising prospects and corporate development needs, Sanyou Chemical, Sateri and Xinxiang Chemical Fiber are still planning to expand capacity with a focus on differentiated high-end products.
Being one of the Chinese VSF companies holding the highest product differentiation rate, Sanyou Chemical can reach above 80%. Following the operation of the 160,000 tons/a differentiated VSF project and the transformation of some production lines, the company, with overall VSF capacity of 480,000 tons/a as of end-2013, has became one of the largest VSF manufacturers in China. Furthermore, the company also plans to release incremental capacity of 50,000 tons through technological reform in 2014.
Sateri had only reached 210,000 tons/a viscose fiber by the end of 2013; but as China's largest dissolving wood pulp (DWP, the main raw material for viscose fiber) supplier, it enjoys around 40% market share with obvious cost advantages. Meanwhile, Sateri is accelerating the downstream viscose fiber capacity expansion, and its Fujian plant will obtain additional differentiated viscose fiber capacity of 150,000 tons/a in 2014 (wherein, 50,000 tons/a was realized in January and March 2014 each, and the remaining 50,000 tons/a will be put into operation in the third quarter).
As one of the largest VFY producers in China, Xinxiang Chemical Fiber saw VFY capacity of 60,000 tons/a in 2013. Currently, its subsidiary ------ Xinjiang Bailu has completed the “100,000 tons/a New-type Cellulose Project Phase I” and can accomplish full production in the first half of 2014.
The report mainly includes the following aspects:
Supply, regional structure, competition pattern and trends of the global viscose fiber market;
Supply, capacity, competition pattern, policies, import, export and prices of Chinese viscose fiber market;
Status quo and competition pattern of Chinese bamboo fiber market segments;
Operation, revenue structure, gross margin, major clients, viscose fiber business and development of 18 domestic and foreign viscose fiber production enterprises.
第一章 粘胶纤维概述
1.1 定义及特性
1.2 分类及用途
1.3 产业链
第二章 全球粘胶纤维行业分析
2.1 发展历史
2.2 纤维总体发展情况
2.3 产量分析
2.4 竞争格局
第三章 中国粘胶纤维行业运营情况
3.1 发展历史
3.2 行业运营情况
3.3 政策
第四章 中国粘胶纤维市场分析
4.1 纤维总体发展情况
4.2 产能分析
4.3 产量分析
4.4 进出口分析
4.5 价格分析
第五章 中国竹浆纤维市场概况
5.1 竹浆纤维介绍
5.2 竹浆纤维优势
5.3 市场概况
第六章 国外重点企业分析
6.1 奥地利兰精(LENZING)
6.1.1 公司介绍
6.1.2 经营情况
6.1.3 纤维部门经营情况
6.1.4 粘胶纤维业务
6.1.5 在华业务
6.1.6 发展情况
6.2 印度博拉集团(ADITYA BIRLA GROUP)
6.2.1 公司介绍
6.2.2 Grasim经营情况
6.2.3 Grasim粘胶短纤业务
6.2.4 在华业务
6.3 新加坡赛得利(SATERI)
6.3.1 公司介绍
6.3.2 经营情况
6.3.3 营收构成
6.3.4 毛利率
6.3.5 粘胶短纤业务
6.3.6 在华业务
第七章 中国重点企业分析
7.1 恒天海龙
7.1.1 公司介绍
7.1.2 经营情况
7.1.3 营收构成
7.1.4 毛利率
7.1.5 客户
7.1.6 粘胶纤维业务
7.1.7 预测与展望
7.2 澳洋科技
7.2.1 公司介绍
7.2.2 经营情况
7.2.3 营收构成
7.2.4 毛利率
7.2.5 客户
7.2.6 粘胶纤维业务
7.2.7 预测与展望
7.3 新乡化纤
7.3.1 公司简介
7.3.2 经营情况
7.3.3 营收构成
7.3.4 毛利率
7.3.5 客户
7.3.6 粘胶纤维业务
7.3.7 预测与展望
7.4 南京化纤
7.4.1 公司介绍
7.4.2 经营情况
7.4.3 营收构成
7.4.4 毛利率
7.4.5 客户
7.4.6 粘胶纤维业务
7.4.7 预测与展望
7.5 吉林化纤
7.5.1 公司简介
7.5.2 经营情况
7.5.3 营收构成
7.5.4 毛利率
7.5.5 客户
7.5.6 粘胶纤维业务
7.5.7 预测与展望
7.6 恒天天鹅
7.6.1 公司介绍
7.6.2 经营情况
7.6.3 营收构成
7.6.4 毛利率
7.6.5 客户
7.6.6 粘胶纤维业务
7.6.7 预测与展望
7.7 三友化工
7.7.1 公司介绍
7.7.2 经营情况
7.7.3 营收构成
7.7.4 毛利率
7.7.5 客户
7.7.6 粘胶纤维业务
7.7.7 预测与展望
7.8 湖北金环
7.8.1 公司介绍
7.8.2 经营情况
7.8.3 营收构成
7.8.4 毛利率
7.8.5 客户
7.8.6 预测与展望
7.9 富丽达股份
7.9.1 公司介绍
7.9.2 经营情况
7.9.3 粘胶纤维业务
7.10 丝丽雅集团
7.10.1 公司介绍
7.10.2 经营情况
7.10.3 粘胶纤维业务
7.11 其他企业
7.11.1 山东雅美
7.11.2 江苏翔盛
7.11.3 龙达化纤
7.11.4 山东银鹰化纤
7.11.5 舒美特
第八章 总结与预测
8.1 技术
8.2 进出口
8.3 价格
8.4 产能/产量
8.5 企业
1 Overview of Viscose Fiber
1.1 Definition and Characteristics
1.2 Classification and Application
1.3 Industry Chain
2 Global Viscose Fiber Industry
2.1 Development History
2.2 Overall Development
2.3 Output
2.4 Competition Pattern
3 China Viscose Fiber Industry
3.1 Development History
3.2 Operation
3.3 Policy
4 China Viscose Fiber Market
4.1 Overall Development
4.2 Capacity
4.3 Output
4.4 Import and Export
4.5 Price
5 China Bamboo Fiber Market
5.1 Introduction to Bamboo Fiber
5.2 Advantages of Bamboo Fiber
5.3 Market Overview
6 Key Foreign Enterprises
6.1 LENZING
6.1.1 Profile
6.1.2 Operation
6.1.3 Operation of Fiber Sector
6.1.4 Viscose Fiber Business
6.1.5 Business in China
6.1.6 Development
6.2 ADITYA BIRLA GROUP
6.2.1 Profile
6.2.2 Operation of Grasim
6.2.3 VSF Business of Grasim
6.2.4 Business in China
6.3 SATERI
6.3.1 Profile
6.3.2 Operation
6.3.3 Revenue Structure
6.3.4 Gross Margin
6.3.5 VSF Business
6.3.6 Business in China
7 Key Chinese Enterprises
7.1 CHTC HELON
7.1.1 Profile
7.1.2 Operation
7.1.3 Revenue Structure
7.1.4 Gross Margin
7.1.5 Clients
7.1.6 Viscose Fiber Business
7.1.7 Forecast & Outlook
7.2 Aoyang Technology
7.2.1 Profile
7.2.2 Operation
7.2.3 Revenue Structure
7.2.4 Gross Margin
7.2.5 Clients
7.2.6 Viscose Fiber Business
7.2.7 Forecast & Outlook
7.3 Xinxiang Chemical Fiber
7.3.1 Profile
7.3.2 Operation
7.3.3 Revenue Structure
7.3.4 Gross Margin
7.3.5 Clients
7.3.6 Viscose Fiber Business
7.3.7 Forecast & Outlook
7.4 Nanjing Chemical Fiber
7.4.1 Profile
7.4.2 Operation
7.4.3 Revenue Structure
7.4.4 Gross Margin
7.4.5 Clients
7.4.6 Viscose Fiber Business
7.4.7 Forecast & Outlook
7.5 Jilin Chemical Fibre
7.5.1 Profile
7.5.2 Operation
7.5.3 Revenue Structure
7.5.4 Gross Margin
7.5.5 Clients
7.5.6 Viscose Fiber Business
7.5.7 Forecast & Outlook
7.6 Swan Fiber
7.6.1 Profile
7.6.2 Operation
7.6.3 Revenue Structure
7.6.4 Gross Margin
7.6.5 Clients
7.6.6 Viscose Fiber Business
7.6.7 Forecast & Outlook
7.7 Sanyou Chemical
7.7.1 Profile
7.7.2 Operation
7.7.3 Revenue Structure
7.7.4 Gross Margin
7.7.5 Clients
7.7.6 Viscose Fiber Business
7.7.7 Forecast & Outlook
7.8 Hubei Golden Ring
7.8.1 Profile
7.8.2 Operation
7.8.3 Revenue Structure
7.8.4 Gross Margin
7.8.5 Clients
7.8.6 Forecast & Outlook
7.9 Fulida
7.9.1 Profile
7.9.2 Operation
7.9.3 Viscose Fiber Business
7.10 Grace
7.10.1 Profile
7.10.2 Operation
7.10.3 Viscose Fiber Business
7.11 Others
7.11.1 Shandong Yamei
7.11.2 Jiangsu Xiangsheng
7.11.3 Longda Chemical Fiber
7.11.4 Shandong Silver Hawk Chemical Fibre
7.11.5 Somettex
8 Summary and Forecast
8.1 Technology
8.2 Import and Export
8.3 Price
8.4 Capacity / Output
8.5 Enterprise
图:粘胶纤维产业链
图:2008-2013年全球纤维总产量及增长率
表:2011-2013年全球主要纤维品种产量及其占比
图:2006-2013年全球粘胶纤维产量及增长率
图:2013年全球粘胶纤维产量地区分布
表:2013年全球前十大粘胶纤维生产商及其产能
图:2006-2013年中国纤维素纤维原料及纤维制造业主营业务收入及同比增长率
图:2006-2013年中国纤维素纤维原料及纤维制造业利润总额及同比增长率
表:符合《粘胶纤维行业准入条件》企业名单(第一批)
表:2012-2013年中国主要纤维品种产量及其占比
图:2006-2013年中国化学纤维制造业主营业务收入及同比增长率
表:2013年中国粘胶纤维主要生产厂家及产能
图:2013年中国粘胶短纤主要生产企业及其产能占比
图:2013年中国粘胶长丝主要生产企业及其产能占比
图:2006-2013年中国粘胶纤维产量及同比增长
图:2011-2013年中国粘胶纤维(分产品)产量占比
表:2010年中国粘胶纤维产量地区分布
图:2008-2013年中国粘胶短纤进出口量
图:2008-2013年中国粘胶短纤进出口平均价格
图:2013年中国粘胶短纤出口目的地分布(按出口量)
图:2013年中国粘胶短纤进口来源分布(按进口量)
图:2013年中国主要粘胶短纤出口城市的出口量占比
图:2013年中国主要粘胶短纤进口城市的进口量占比
图:2008年5月-2014年4月中国粘胶短纤和粘胶长丝市场价格
图:竹浆纤维工艺路线图
表:竹浆纤维和普通粘胶纤维性能比较
图:2008-2013年兰精公司销售收入及EBITDA
图:2008-2013年兰精公司(分部门)销售收入占比
图:2008-2013年兰精公司纤维部门销售收入及EBIT
图:2011-2013年兰精公司纤维部门(分产品)销售收入占比
图:2008-2013年兰精公司纤维部门(分地区)销售收入占比
表:2013年兰精公司粘胶纤维相关子公司及其产能
图:2008-2013年兰精公司纤维总产量及增长率
图:2009-2013年兰精公司纤维部门纤维业务销售收入占比(分产品)
图:2008-2013年兰精(南京)纤维营业收入及净利润
图:FY2008-FY2013 Grasim净收入及净利润
图:FY2011-FY2013 Grasim公司(分产品)净收入占比
表:2013年Grasim主营产品生产工厂及其产能
图:FY2008-FY2013 Grasim粘胶短纤产量、销量及产销率
图:FY2009-FY2013 Grasim粘胶短纤业务净收入及增长率
图:赛得利产品链及产品用途
图:2008-2013年赛得利营业收入和净利润
表:2010-2013年赛得利(分产品)营业收入
图:2010-2013年赛得利(分产品)营业收入占比
表:2010-2013年赛得利(分地区)营业收入
图:2010-2013年赛得利(分地区)营业收入占比
图:2010-2013年赛得利主营产品毛利率
图:2010-2013年赛得利粘胶短纤产量、销量及产销率
图:2010-2013年赛得利粘胶短纤及溶解木浆的平均售价
表:2013年恒天海龙主营产品产能
图:2008-2013年恒天海龙营业收入和净利润
表:2008-2013年恒天海龙(分产品)营业收入
图:2008-2013年恒天海龙(分产品)营业收入占比
表:2008-2013年恒天海龙(分地区)营业收入
图:2008-2013年恒天海龙(分地区)营业收入占比
图:2008-2013年恒天海龙粘胶纤维产品毛利率
图:2008-2013年恒天海龙前五名客户贡献收入及占比
表:2013年恒天海龙前五名客户名称、收入贡献及占比
表:2013年恒天海龙子公司情况
图:2012-2016E年恒天海龙营业收入及净利润预测
图:2008-2013年澳洋科技营业收入和净利润
表:2008-2013年澳洋科技粘胶短纤业务收入及增长率
图:2008-2013年澳洋科技(分产品)营业收入占比
图:2009-2013年澳洋科技(分地区)营业收入
图:2009-2013年澳洋科技(分地区)营业收入占比
图:2008-2013年澳洋科技粘胶短纤毛利率
图:2008-2013年澳洋科技前五名客户贡献收入及占比
表:2013年澳洋科技前五名客户收入贡献及占比
图:2008-2013年玛纳斯澳洋营业收入及净利润
图:2008-2013年阜宁澳洋营业收入及净利润
图:2009-2013新澳特纤营业收入及净利润
图:2012-2016E年澳洋科技营业收入及净利润预测
表:2012-2014E年新乡化纤主营产品生产情况
图:2008-2013年新乡化纤营业收入和净利润
图:2008-2013年新乡化纤(分产品)主营业收入
图:2008-2013年新乡化纤(分产品)主营业收入占比
表:2008-2013年新乡化纤(分地区)主营业收入
图:2008-2013年新乡化纤(分地区)主营业收入占比
图:2008-2013年新乡化纤主营产品毛利率
图:2008-2013年新乡化纤前五名客户贡献收入及占比
表:2013年新乡化纤前五名客户名称、收入贡献及占比
图:2008-2013年新乡化纤粘胶短纤、粘胶长丝产品产量
表:截止2013年新乡化纤在建项目情况
图:2012-2016E年新乡化纤营业收入和净利润预测
图:2008-2013年南京化纤营业收入和净利润
表:2008-2013年南京化纤(分产品)主营业收入
图:2008-2013年南京化纤(分产品)主营业收入占比
表:2008-2013年南京化纤(分地区)主营业收入
图:2008-2013年南京化纤粘胶纤维产品毛利率
图:2008-2013年南京化纤前五名客户贡献收入及占比
表:2013南京化纤前五名客户名称、收入贡献及占比
图:2009-2013年南京化纤粘胶纤维产量
图:2009-2013年南京化纤粘胶纤维销量
表:2013年南京化纤粘胶纤维业务相关子公司及其营业收入和净利润
图:2012-2016E年南京化纤营业收入和净利润预测
图:2008-2013年吉林化纤营业收入和净利润
表:2010-2013年吉林化纤(分产品)主营业收入
图:2010-2013年吉林化纤(分产品)主营业收入占比
表:2008-2013年吉林化纤(分地区)营业收入
图:2008-2013年吉林化纤(分地区)营业收入占比
表:2010-2013年吉林化纤主营产品毛利率
图:2009-2013年吉林化纤前五名客户贡献收入及占比
图:2013年吉林化纤前五名客户名称、收入贡献及占比
表:2013年吉林化纤主营产品产能
表:2013年南京化纤粘胶纤维业务相关子公司及其经营情况
图:2012-2016E年吉林化纤营业收入及净利润预测
图:2008-2013年恒天天鹅营业收入和净利润
表:2008-2013年恒天天鹅(分产品)营业收入
图:2010-2013年恒天天鹅(分产品)营业收入占比
表:2010-2013年恒天天鹅(分地区)营业收入
图:2010-2013年恒天天鹅(分地区)营业收入占比
图:2008-2013年恒天天鹅主营产品毛利率
图:2008-2013年恒天天鹅前五名客户贡献收入及占比
图:2013年恒天天鹅前五名客户名称、收入贡献及占比
表:2013年恒天天鹅主营产品产能
图:2008-2013年恒天天鹅粘胶长丝营业收入
图:2008-2013恒天天鹅粘胶长丝业务收入结构(分地区)
图:2012-2016E年恒天天鹅营业收入及净利润预测
图:2008-2013年三友化工营业收入和净利润
表:2010-2013年三友化工(分产品)主营业收入
图:2010-2013年三友化工(分产品)营业收入占比
表:2010-2013年三友化工(分地区)营业收入
图:2010-2013年三友化工(分地区)营业收入占比
图:2010-2013年三友化工主营产品毛利率
图:2008-2013年三友化工前五名客户贡献收入及占比
表:2013年三友化工前五名客户名称、收入贡献及占比
图:2013年兴达纤维子公司情况
图:2008-2013年兴达化纤营业收入和净利润
图:2012-2016E年三友化工营业收入及净利润预测
表:2013年湖北金环主营产品产能
图:2008-2013年湖北金环营业收入及净利润
表:2008-2013年湖北金环(分产品)营业收入
图:2008-2013年湖北金环(分产品)营业收入占比
图:2008-2013年湖北金环粘胶纤维相关业务毛利率
图:2008-2013湖北金环前五名客户贡献收入及占比
表:2013H1湖北金环前五名客户名称、收入贡献及占比
图:2012-2016E湖北金环营业收入及净利润预测
图:2009-2010年富丽达股份营业收入和净利润
图:2007-2009年丝丽雅股份主营业务收入和利润总额
表:2013年丝丽雅集团粘胶纤维产能
图:2011-2016E年中国粘胶纤维行业供需预测
图:1960-2020E全球不同纤维品种发展情况预测
表:2011-2013年中国主要粘胶纤维企业营业收入及增长率
Viscose Fiber industry Chain
Global Fiber Output and Growth Rate, 2008-2013
Global Fiber Output Structure by Main Varieties, 2011-2013
Global Viscose Fiber Output and Growth Rate, 2006-2013
Global Viscose Fiber Output by Region, 2013
Capacity of the World’s Top 10 Viscose Fiber Manufacturers, 2013
Operating Revenue and YoY Growth Rate of China Cellulose Fiber Materials and Fiber Manufacturing, 2006-2013
Total Profit and YoY Growth Rate of China Cellulose Fiber Materials and Fiber Manufacturing, 2006-2013
List of Enterprises Subject to Viscose Fiber Industry Access Conditions (First Batch)
China’s Fiber Output Structure by Main Varieties, 2012-2013
Operating Revenue and YoY Growth Rate of China Chemical Fiber Manufacturing, 2006-2013
Capacity of China’s Leading Viscose Fiber Manufacturers, 2013
Major Chinese VSF Manufacturers and Capacity Proportion, 2013
Major Chinese VFY Manufacturers and Capacity Proportion, 2013
China’s Viscose Fiber Output and YoY Growth Rate, 2006-2013
China’s Viscose Fiber Output by Product, 2011-2013
China’s Viscose Fiber Output by Region, 2010
China’s VSF Import and Export Volume, 2008-2013
China’s VSF Import and Export Prices, 2008-2013
China’s VSF Export Destinations by Export Volume, 2013
China’s VSF Import Sources by Import Volume, 2013
China’s VSF Export Volume by Major Export Cities, 2013
China’s VSF Import Volume by Major Import Cities, 2013
China’s VSF and VFY Market Prices, May 2008-Apr 2014
Bamboo Fiber Technology Roadmap
Performance Comparison between Bamboo Fiber and Ordinary Viscose Fiber
Lenzing’s Sales and EBITDA, 2008-2013
Lenzing’s Sales Structure by Division, 2008-2013
Sales and EBIT of Lenzing Fiber Division, 2008-2013
Sales Structure of Lenzing Fiber Division by Product, 2011-2013
Sales Structure of Lenzing Fiber Division by Region, 2008-2013
Capacity of Lenzing’s Viscose Fiber Subsidiaries, 2013
Lenzing’s Total Fiber Output and Growth Rate, 2008-2013
Sales Structure of Lenzing Fiber Division by Product, 2009-2013
Revenue and Net Income of Lenzing (Nanjing) Fibers, 2008-2013
Grasim’s Net Revenue and Net Income, FY2008-FY2013
Grasim’s Net Revenue Structure by Product, FY2011-FY2013
Capacity of Grasim’s Main Production Plants, 2013
Grasim’s VSF Output, Sales Volume and Sales-Output Ratio, FY2008-FY2013
Grasim’s VSF Net Revenue and Growth Rate, FY2009-FY2013
Sateri’s Product Chain and Usage
Sateri’s Revenue and Net Income, 2008-2013
Sateri’s Revenue by Product, 2010-2013
Sateri’s Revenue Structure by Product, 2010-2013
Sateri’s Revenue by Region, 2010-2013
Sateri’s Revenue Structure by Region, 2010-2013
Sateri’s Gross Margin of Main Products, 2010-2013
Sateri’s VSF Output, Sales Volume and Sales-Output Ratio, 2010-2013
Sateri’s Average Selling Prices for VSP and DWP, 2010-2013
Capacity of Main Products of CHTC HELON, 2013
Revenue and Net Income of CHTC HELON, 2008-2013
Revenue of CHTC HELON by Product, 2008-2013
Revenue Structure of CHTC HELON by Product, 2008-2013
Revenue of CHTC HELON by Region, 2008-2013
Revenue Structure of CHTC HELON by Region, 2008-2013
Gross Margin of Viscose Fiber Products of CHTC HELON, 2008-2013
Revenue of CHTC HELON from Top 5 Clients and % of Total Revenue, 2008-2013
Name List and Revenue Contribution of Top 5 Clients of CHTC HELON, 2013
Subsidiaries of CHTC HELON, 2013
Revenue and Net Income of CHTC HELON, 2012-2016E
Revenue and Net Income of Aoyang Technology, 2008-2013
VSF Revenue and Growth Rate of Aoyang Technology, 2008-2013
Revenue Structure of Aoyang Technology by Product, 2008-2013
Revenue of Aoyang Technology by Region, 2009-2013
Revenue Structure of Aoyang Technology by Region, 2009-2013
VSF Gross Margin of Aoyang Technology, 2008-2013
Revenue of Aoyang Technology from Top 5 Clients and % of Total Revenue, 2008-2013
Revenue of Aoyang Technology from Top 5 Clients and % of Total Revenue, 2013
Revenue and Net Income of Manasi Aoyang Technology, 2008-2013
Revenue and Net Income of Funing Aoyang Technology, 2008-2013
Revenue and Net Income of Xinao Special Fiber, 2009-2013
Revenue and Net Income of Aoyang Technology, 2012-2016E
Production of Main Products of Xinxiang Chemical Fiber, 2012-2014E
Revenue and Net Income of Xinxiang Chemical Fiber, 2008-2013
Operating Revenue of Xinxiang Chemical Fiber by Product, 2008-2013
Operating Revenue Structure of Xinxiang Chemical Fiber by Product, 2008-2013
Operating Revenue of Xinxiang Chemical Fiber by Region, 2008-2013
Operating Revenue Structure of Xinxiang Chemical Fiber by Region, 2008-2013
Gross Margin of Main Products of Xinxiang Chemical Fiber, 2008-2013
Revenue of Xinxiang Chemical Fiber from Top 5 Clients and % of Total Revenue, 2008-2013
Name List and Revenue Contribution of Top 5 Clients of Xinxiang Chemical Fiber, 2013
VSF and VFY Output of Xinxiang Chemical Fiber, 2008-2013
Xinxiang Chemical Fiber’s Projects under Construction, 2013
Revenue and Net Income of Xinxiang Chemical Fiber, 2012-2016E
Revenue and Net Income of Nanjing Chemical Fiber, 2008-2013
Operating Revenue of Nanjing Chemical Fiber by Product, 2008-2013
Operating Revenue Structure of Nanjing Chemical Fiber by Product, 2008-2013
Operating Revenue of Nanjing Chemical Fiber by Region, 2008-2013
Gross Margin of Viscose Fiber Products of Nanjing Chemical Fiber, 2008-2013
Revenue of Nanjing Chemical Fiber from Top 5 Clients and % of Total Revenue, 2008-2013
Name List and Revenue Contribution of Top 5 Clients of Nanjing Chemical Fiber, 2013
Viscose Fiber Output of Nanjing Chemical Fiber, 2009-2013
Viscose Fiber Sales Volume of Nanjing Chemical Fiber, 2009-2013
Revenue and Net Income of Viscose Fiber Subsidiaries of Nanjing Chemical Fiber, 2013
Revenue and Net Income of Nanjing Chemical Fiber, 2012-2016E
Revenue and Net Income of Jilin Chemical Fibre, 2008-2013
Operating Revenue of Jilin Chemical Fibre by Product, 2010-2013
Operating Revenue Structure of Jilin Chemical Fibre by Product, 2010-2013
Revenue of Jilin Chemical Fibre by Region, 2008-2013
Revenue Structure of Jilin Chemical Fibre by Region, 2008-2013
Gross Margin of Main Products of Jilin Chemical Fibre, 2010-2013
Revenue of Jilin Chemical Fibre from Top 5 Clients and % of Total Revenue, 2009-2013
Name List and Revenue Contribution of Top 5 Clients of Jilin Chemical Fibre, 2013
Capacity of Main Products of Jilin Chemical Fibre, 2013
Operation of Viscose Fiber Subsidiaries of Jilin Chemical Fibre, 2013
Revenue and Net Income of Jilin Chemical Fibre, 2012-2016E
Revenue and Net Income of Swan Fiber, 2008-2013
Revenue of Swan Fiber (by Product), 2008-2013
Revenue Structure of Swan Fiber by Product, 2010-2013
Revenue of Swan Fiber by Region, 2010-2013
Revenue Structure of Swan Fiber by Region, 2010-2013
Gross Margin of Main Products of Swan Fiber, 2008-2013
Revenue of Swan Fiber from Top 5 Clients and % of Total Revenue, 2008-2013
Name List and Revenue Contribution of Top 5 Clients of Swan Fiber, 2013
Capacity of Main Products of Swan Fiber, 2013
VFY Revenue of Swan Fiber, 2008-2013
VFY Revenue Structure of Swan Fiber by Region, 2008-2013
Revenue and Net Income of Swan Fiber, 2012-2016E
Revenue and Net Income of Sanyou Chemical, 2008-2013
Operating Revenue of Sanyou Chemical by Product, 2010-2013
Revenue Structure of Sanyou Chemical by Product, 2010-2013
Revenue of Sanyou Chemical by Region, 2010-2013
Revenue Structure of Sanyou Chemical by Region, 2010-2013
Gross Margin of Main Products of Sanyou Chemical, 2010-2013
Revenue of Sanyou Chemical from Top 5 Clients and % of Total Revenue, 2008-2013
Name List and Revenue Contribution of Top 5 Clients of Sanyou Chemical, 2013
The Subsidiary - XingDa Chemical Fiber, 2013
Revenue and Net Income of XingDa Chemical Fiber, 2008-2013
Revenue and Net Income of Sanyou Chemical, 2012-2016E
Capacity of Main Products of Hubei Golden Ring, 2013
Revenue and Net Income of Hubei Golden Ring, 2008-2013
Revenue of Hubei Golden Ring by Product, 2008-2013
Revenue Structure of Hubei Golden Ring by Product, 2008-2013
Gross Margin of Viscose Fiber Business of Hubei Golden Ring, 2008-2013
Revenue of Hubei Golden Ring from Top 5 Clients and % of Total Revenue, 2008-2013
Name List and Revenue Contribution of Top 5 Clients of Hubei Golden Ring, H1 2013
Revenue and Net Income of Hubei Golden Ring, 2012-2016E
Revenue and Net Income of Fulida, 2009-2010
Operating Revenue and Total Profit of Grace, 2007-2009
Viscose Fiber Capacity of Grace, 2013
Supply and Demand of China Viscose Fiber industry, 2011-2016E
Development of Various Fiber Types in the World, 1960-2020E
Revenue and Growth Rate of Major Viscose Fiber Enterprises in China, 2011-2013
如果这份报告不能满足您的要求,我们还可以为您定制报告,请 留言说明您的详细需求。
|