|
|
|
报告导航:研究报告—
农业与食品—食品饮料
|
|
2013-2016中国葡萄酒行业研究报告 |
 |
字数:3.0万 |
页数:75 |
图表数:67 |
|
中文电子版:7000元 |
中文纸版:3500元 |
中文(电子+纸)版:7500元 |
|
英文电子版:1800美元 |
英文纸版:1900美元 |
英文(电子+纸)版:2100美元 |
|
编号:QYJ001
|
发布日期:2014-05 |
附件:下载 |
 |
|
|
近年来,中国葡萄酒市场规模增长很快。 2001-2012年,中国葡萄酒产量一直呈上升趋势,年均增长率达到16.5%。不过,受2012年末中共十八大颁布的 “限制三公消费、八项禁令、军队禁酒令”等影响,中国葡萄酒市场增速放缓甚至下滑,2013年中国葡萄酒产量、消费量分别同比下降4.7%、13.7%。
中国葡萄酒市场消费区域发展差异较大。目前,东南沿海的上海、广东、福建、浙江等经济发达地区已经出现了10—30亿元级的省级规模市场、亿元级的市级规模市场以及千万元级的县级市场。但是在北方及广大中西部地区、除北京、成都等个别中心城市外,葡萄酒消费仍然处于市场培育期。
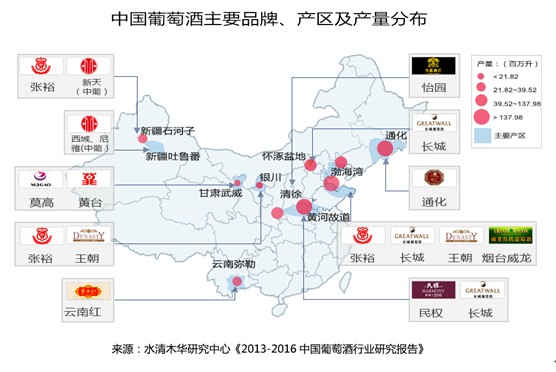
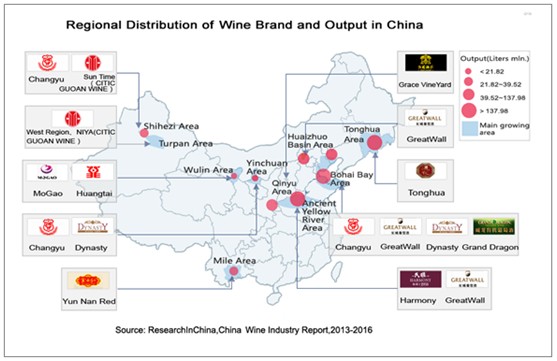
受气候和地理环境限制,中国葡萄酒生产的区域集中度较高。中国葡萄酒年产量超过1亿升的产地仅有三个省市。山东省(渤海湾地区)和吉林省(通化)葡萄酒产量最大,2013年两省产量共计7.12亿升,占全国总产量的64%。山东省主要的葡萄品种有霞多丽、赤霞珠、美乐、佳丽酿等。中国本土葡萄酒生产商张裕、长城、王朝都在该地区设有种植基地。
中国加入WTO后,葡萄酒关税由65%下降到14%,外国葡萄酒快速进入中国市场。2012年中国葡萄酒进口量达3.94亿升,是2008年的2.4倍。2013年,商务部开始对原产于欧盟的进口葡萄酒进行反倾销调查和反补贴调查,加之中国“限制三公消费”等影响,同期中国进口葡萄酒总量同比下滑4.5%。2013年,中国进口葡萄酒仍集中在瓶装酒上,占进口葡萄酒总量的74%,主要进口国为法国。
2013年之后,中国葡萄酒行业将进入结构性调整阶段(如葡萄酒经销商去库存化,葡萄酒生产商产品向中低端倾斜等),市场挤掉泡沫回归理性。预计2013-2016年中国葡萄酒消费量年均复合增长率可达9.7%。
《2013-2016中国葡萄酒行业研究报告》主要包括以下几个方面:
 中国葡萄酒行业生产规模、进出口、消费情况、市场价格、经营情况、竞争格局等; 中国葡萄酒行业生产规模、进出口、消费情况、市场价格、经营情况、竞争格局等;
中国葡萄酒行业政策、进出口政策、上下游行业对其影响等;
全球及中国葡萄酒行业发展预测分析,包括生产规模预测、消费趋势预测,中国葡萄酒与进口葡萄酒竞争趋势预测等;
中国10家葡萄酒企业的生产经营情况、投资并购、葡萄酒业务及发展前景等。
Recent years have seen substantial growth in Chinese grape wine market. From 2001 to 2012, the grape wine output in China had shown an upward trend with the CAGR of 16.5%. However, the 18th CPC National Congress called on the restriction of spending by central government bodies on official overseas visits, official vehicles, and official hospitality, “six bans”, and alcohol prohibition in the military, leading to the slowdown of growth or even decline in China wine market. In 2013, the output and consumption of grape wine in China went down by 4.7% year-on-year and 13.7% year-on-year, respectively.
By region, the consumption in China grape wine market varies a lot in terms of development. For now, China’s southeast coastal regions, including Shanghai, Guangdong, Fujian and Zhejiang where are economically developed, have achieved provincial-level market scale valuing RMB1-3 billion, city-level market scale valuing RMB100 million, and county-level market scale valuing RMB10 million. However, in the north and the vast central and western regions, the grape wine consumption is still at a stage of market incubation, with the exception of such cities as Beijing and Chengdu.
Due to the restriction of weather and geographical conditions, the grape wine production in China demonstrates higher regional concentration. In China, there are just three provinces and municipalities seeing the annual grape wine output of 100 million liters or more. Among these, the largest grape wine producers come to Shandong (the Bohai Bay area) and Jilin (Tonghua), with the combined output in 2013 amounting to 712 million liters or 64% of the national total. In Shandong, Chardonnay, Carbernet Sauvignon, Merlot, and Carignane are major grape wine varities. Also, planting bases of homegrown grape wine producers like CHANGYU, Great Wall and Dynasty are located in Shandong.
With China’s accession into the WTO, China’s import tariff on grape wine was reduced from 65% to 14%, bringing a large inrush of foreign grape wines into the Chinese market. In 2012, the grape wine import volume of China reported 394 million liters, equivalent to 2.4 folds of the figure in 2008. In 2013, the Ministry of Commerce launched anti-dumping and anti-subsidy investigations on made-in-EU wines. Together with the impact brought by the government call to restrict the spending by the central government bodies on official overseas visits, official vehicles, and official hospitality, China’s total import volume of wine witnessed a year-on-year decline of 4.5%. In 2013, China’s import volume of bottled grape wine accounted for 74% of the total, with France as the major import origin.
China grape wine industry is to enter into a stage for structural adjustment after 2013 (for instance, de-stocking targeting wine dealers, grape wine producers’ orientation to low-and medium-end market), in order to pop the market bubble for a comeback to the right track. It is estimated that the CAGR of grape wine consumption in China between 2013 and 2016 will post 9.7%.
The report highlights the followings:
production scale, import & export, consumption, market price and operation of China grape wine industry;
industrial polices, import & export policies, influences from industries upstream and downstream;
expectation on the development of global and China grape wine industry: production scale, consumption momentum, competition between homemade grape wines and imported wines;
Production, operation, investment and M&As, grape wine business and development outlook of 10 leading Chinese grape wine enterprises.
第一章 葡萄酒行业概述
1.1 定义
1.2 分类
第二章 中国葡萄酒行业现状
2.1 发展历程
2.2 市场规模
2.2.1消费量现状及预测
2.2.2产量现状及预测
2.3 市场环境
2.3.1 宏观经济环境
2.3.2 政策环境
2.3.3 社会环境
2.4 市场供给
2.4.1 生产情况
2.4.2 出口
2.4.3 进口
2.5 市场价格
2.5.1 国产葡萄酒出厂价
2.5.2 葡萄酒进口价格
2.5.3 葡萄酒终端价格
2.5.4 葡萄酒消费趋势
第三章 中国葡萄酒行业竞争格局
3.1 竞争现状
3.1.1 企业数量
3.1.2 营业收入
3.1.3 利润情况
3.1.4 不同规模企业竞争特点
3.1.5 主要企业营销水平
3.2 进口葡萄酒竞争
3.2.1 进口葡萄酒快速进入中国市场
3.2.2 进口葡萄酒企业发展模式对比
3.2.3 进口葡萄酒主要冲击高端及低端市场
3.2.4 长期来看国产葡萄酒仍占主要份额
3.3上下游企业议价能力
3.3.1 上游资源
3.3.2 葡萄酒经销商
3.4 竞争品分析
3.4.1市场份额
3.4.2白酒
3.4.3啤酒
第四章 主要企业
4.1 张裕
4.1.1 企业简介
4.1.2 经营情况
4.1.3 营收构成
4.1.4 毛利率
4.1.5 公司战略规划
4.2 中国食品
4.2.1 企业简介
4.2.2 经营情况
4.2.3 营收构成
4.2.4 毛利率
4.2.5 葡萄酒业务分析
4.2.6 预测与展望
4.3 中葡股份
4.3.1 企业简介
4.3.2 经营情况
4.3.3 营收构成
4.3.4 毛利率
4.3.5 公司战略发展
4.4 通天酒业
4.4.1 企业简介
4.4.2 经营情况
4.4.3 营业收入
4.4.4 毛利率
4.4.5 公司战略发展
4.5 皇台酒业
4.5.1 企业简介
4.5.2 经营情况
4.5.3 营收构成
4.5.4 毛利率
4.5.5 公司战略发展
4.6 莫高股份
4.6.1 企业简介
4.6.2 经营情况
4.6.3 营收构成
4.6.4 毛利率
4.6.5公司战略发展
4.7 通葡股份
4.7.1 企业简介
4.7.2 经营情况
4.7.3 营收构成
4.7.4 毛利率
4.7.5 公司战略发展
4.8 王朝酒业
4.8.1 企业简介
4.8.2 经营情况
4.8.3 毛利率
4.8.4 公司战略发展
4.8.5 预测与展望
第五章 总结与预测
5.1总体预测
5.2葡萄酒企业对比及预测
1. Overview of Grape Wine Industry
1.1 Definition
1.2 Classification
2. Status Quo of China Grape Wine Industry
2.1 Development History
2.2 Market Scale
2.2.1 Current Consumption and Forecasting
2.2.2 Current Output and Forecasting
2.3 Market Environment
2.3.1 Economic Environment
2.3.2 Political Environment
2.3.3 Social Environment
2.4 Market Supply
2.4.1 Production
2.4.2 Export
2.4.3 Import
2.5 Market Price
2.5.1 Ex-factory Price of China Native Wine
2.5.2 Import Price of Wine
2.5.3 Consumer-Price of Wine
2.5.4 Wine Consumption Trend
3. Competition Pattern of China Grape Wine Industry
3.1 Competition Status Quo
3.1.1 Number of Enterprises
3.1.2 Revenue
3.1.3 Profit
3.1.4 Market Share of Main Grape Wine Companies in China
3.1.5 Features of Competition among Enterprises by Scale
3.1.6 Marketing Level of Major Enterprises
3.2 Competition of Imported Wine
3.2.1 Imported Wine Gaining Access to the Chinese Market
3.2.2 Development Models of Imported Wine Enterprises
3.2.3 Imported Wine Striking Hard to High-and Low-End Markets
3.2.4 China Native Wine to Continue Holding a Lion’s Share in the Long Run
3.3 Bargaining Power of Enterprises Upstream and Downstream
3.3.1 Resources Upstream
3.3.2 Wine Distributor
3.4 Rival Commodities
3.4.1 Market Share
3.4.2 Liquor
3.4.3 Beer
4. Major Enterprises
4.1 Yantai Changyu Pioneer Wine
4.1.1 Profile
4.1.2 Operation
4.1.3 Revenue Structure
4.1.4 Gross Margin
4.1.6 Strategy Planning
4.2 China Foods
4.2.1 Profile
4.2.2 Operation
4.2.3 Revenue Structure
4.2.4 Gross Margin
4.2.5 Analysis on Wine Business
4.2.6 Prediction & Expectation
4.3 CITIC Guoan Wine Co.,Ltd
4.3.1 Profile
4.3.2 Operation
4.3.3 Revenue Structure
4.3.4 Gross Margin
4.3.5 Strategic Development
4.4 TONTINE WINES
4.4.1 Profile
4.4.2 Operation
4.4.3 Revenue
4.4.4 Gross Margin
4.4.5 Strategic Development
4.5 Gansu Huangtai Wine-Marketing Industry
4.5.1 Profile
4.5.2 Operation
4.5.3 Revenue Structure
4.5.4 Gross Margin
4.5.5 Strategic Development
4.6 Gansu Mogao Industrial Development
4.6.1 Profile
4.6.2 Operation
4.6.3 Revenue Structure
4.6.4 Gross Margin
4.6.5 Strategic Development
4.7 Tonghua Grape Wine
4.7.1 Profile
4.7.2 Operation
4.7.3 Revenue Structure
4.7.4 Gross Margin
4.7.5 Strategic Development
4.8 Yantai Grand Dragon
4.8.1 Profile
4.8.2 Operation
4.8.3 Revenue Structure
4.8.4 Gross Margin
4.8 Strategic Development
4.9 Dynasty
4.9.1 Profile
4.9.2 Operation
4.9.3 Gross Margin
4.9.4 Strategic Development
4.9.5 Prediction & Expectation
5. Conclusion & Prediction
5.1 Overall Prediction
5.2 Comparison and Prediction of Grape Wine Enterprises
表:葡萄酒类别及特点
表:中国葡萄酒行业发展阶段
图:2011-2016年中国葡萄酒消费量
图:2003-2013年中国GDP增长率
图:2003-2013城市居民恩格尔系数
图:2003-3013城镇居民家庭人均可支配收入
图:2001-2013年中国葡萄酒产量
图:2013年中国葡萄酒行业(按产量)区域集中度分析
图:2013年中国葡萄酒(按省份)产量结构
图:2008-2013年中国葡萄酒出口量
图:2008-2013年中国葡萄酒出口金额
图:2008-2013年中国葡萄酒进口量
图:2008-2013年中国葡萄酒进口金额
表:2013年中国8大散装酒进口国
表:2013年中国10大瓶装葡萄酒进口国
图:1999-2010年中国国产葡萄酒出厂价格
图:2010年全球葡萄酒出厂价(按国家或地区)
图:2010年全球葡萄酒零售均价(按国家或地区)
图:2008-2013年中国葡萄酒进口均价
图:2009-2013年中国瓶装及散装葡萄酒进口价格
图:2009-2013年中国瓶装及散装葡萄酒进口量
图:2010-2013年中国瓶装及散装葡萄酒进口量
表:葡萄酒行业终端价格及市场规模
图:2013年全球葡萄酒(国家或地区)人均消费量前10名
图:2009-2013年中国葡萄酒人均消费量
图:2006-2014年中国葡萄酒行业企业数量
图:2006-2013年中国葡萄酒营业收入
图:2008-2013年中国葡萄酒行业利润总额
图:2006-2013年中国葡萄酒行业利润率
表:中国不同类型葡萄酒企业及特点
表:中国主要葡萄酒企业成立时间及企业所有制
表:中国三大国产葡萄酒企业综合对比
表:酿酒葡萄的地理条件
图:中国酿酒葡萄产区分布
表:中国葡萄酒十大产区
表:中国主要葡萄酒公司的资源分布
图:中国酒类市场份额
图:2003-2014年中国白酒企业数
图:2003-2013年中国白酒企业总营业收入
图:2003-2013年中国白酒企业利润总额
图:2003-2013中国啤酒企业数量
图:2003-2013中国啤酒企业总营业收入
图:2003-2013中国啤酒企业利润总额
图:2008-2013年中国食品营业收入及净利润率
图:2008-2013年中国食品(分产品)营业收入
图:2008-2013年中国食品毛利率
图:2008-2013中国食品酒类营业收入
表:2013-2016年中国食品营业收入和净利润
图:2008-2013年中葡股份营业收入及净利润率
图:2009-2013年中葡股份(分产品)营业收入
表:2009-2013年中葡股份毛利率(分产品)
表:2013-2016年张裕营业收入和净利润
图:2008-2013年通天酒业营业收入及净利润
图:2008-2013年通天酒业(分产品)营业收入
图:2008-2013年通天酒业(分地区)营业收入
图:2008-2013年通天酒业毛利率
表:2013-2016年通天酒业营业收入和净利润
图:2008-2013年皇台酒业营业收入及净利润率
图:2008-2013年皇台酒业(分产品)营业收入
图:2008-2013年皇台酒业(分地区)营业收入
表:2008-2013年皇台酒业(分产品)毛利率
表:2013-2016年皇台酒业营业收入和净利润
图:2009-2013年莫高股份营业收入及净利润
图:2009-2013年莫高股份营业收入构成(分产品)
表:2009-2013年莫高股份毛利率(分产品)
表:2013-2016年莫高股份营业收入和净利润
图:中国葡萄酒产量及表观消费量预测
图:2013年中国主要葡萄酒企业营业收入和毛利润
图:2016年中国主要葡萄酒企业(预测)营业收入和净利润
Classification and Features of Grape Wines
Development Stage of China Grape Wine Industry
Grape Wine Consumption in China, 2011-2016E
Output of Wine in China, 2011-2016E
GDP Growth Rate in China, 2003-2013
Engel Coefficient of Urban Residents, 2003-2013
Per Capita Disposable Income of Urban Households, 2003-2013
Grape Wine Output in China, 2001-2013
Regional Concentration of China Grape Wine Industry by Output, 2013
Output Structure of China Grape Wine Industry by Province, 2013
Grape Wine Export Volume in China, 2008-2013
Grape Wine Export Value in China, 2008-2013
Grape Wine Import Volume in China, 2008-2013
Grape Wine Import Value in China, 2008-2013
Top 8 Bulk Wine Import Origins of China, 2013
Top 10 Bottled Wine Import Origins of China, 2013
Ex-Factory Prices of China Native Wines, 1999-2010
Grape Wine Ex-Factory Prices by Country or Region, 2010
Average Retail Price of Grape Wine by Country or Region, 2010
Average Imported Price of Grape Wine in China, 2008-2013
Imported Prices of Bottled and Bulk Grape Wines in China, 2009-2013
Import Volume of Bottled and Bulk Grape Wines in China, 2009-2013
Import Volume of Bottled and Bulk Grape Wines in China, 2010-2013
Terminal Price and Market Size of Grape Wine Industry
World Top 10 Grape Wine Consuming Countries or Regions (by Per Capita),2013
Per Capita Grape Wine Consumption in China, 2009-2013
Number of Enterprises in China Grape Wine Industry, 2006-2014
Revenue of China Grape Wine Industry, 2006-2013
Total Profit of China Grape Wine Industry, 2008-2013
Profit Margin of China Grape Wine Industry, 2006-2013
Market Share of Main Chinese Grape Wine Enterprises,2011-2013
Chinese Grape Wine Enterprises of All Types and Their Characteristics
Establishment Time and Corporate Ownership of Major Chinese Grape Wine Enterprises
Comprehensive Comparison of Three Leading WGrape ine Enterprises in China
Geographical Conditions for Wine Grape
Distribution of Wine Grape Production Regions in China
Top 10 Grape Wine Production Regions in China
Key Planting Areas of Major Chinese Grape Wine Companies
China Alcohol Market Share
Number of Liquor Enterprises in China, 2003-2014
Total Revenue of Chinese Liquor Enterprises, 2003-2013
Total Profit of Chinese Liquor Enterprises, 2003-2013
Number of Chinese Beer Enterprises, 2003-2013
Total Revenue of Chinese Beer Enterprises, 2003-2013
Total Profit of Chinese Beer Enterprises, 2003-2013
Revenue and Net Profit Margin of China Foods, 2008-2013
Revenue of China Foods by Product, 2008-2013
Gross Margin of China Foods, 2008-2013
Alcohol Revenue of China Foods by Variety, 2008-2013
Revenue and Net Income of China Foods, 2013-2016E
Revenue and Net Profit Margin of CITIC Guoan Wine, 2008-2013
Revenue of CITIC Guoan Wine by Product, 2009-2013
Gross Margin of CITIC Guoan Wine by Product, 2009-2013
Revenue and Net Income of Yantai Changyu Pioneer Wine, 2013-2016
Revenue and Net Income of Tontine Wines, 2008-2013
Revenue of Tontine Wines by Product, 2008-2013
Revenue of Tontine Wines by Region, 2008-2013
Gross Margin of Tontine Wines, 2008-2013
Revenue and Net Income of Tontine Wines, 2013-2016E
Revenue and Net Profit Margin of Gansu Huangtai Wine-Marketing Industry, 2008-2013
Revenue of Gansu Huangtai Wine-Marketing Industry by Product, 2008-2013
Revenue of Gansu Huangtai Wine-Marketing Industry by Region, 2008-2013
Gross Margin of Gansu Huangtai Wine-Marketing Industry by Product, 2008-2013
Revenue and Net Income of Gansu Huangtai Wine-Marketing Industry, 2013-2016E
Revenue and Net Income of Gansu Mogao Industrial Development, 2009-2013
Revenue Structure of Gansu Mogao Industrial Development by Product, 2009-2013
Gross Margin of Gansu Mogao Industrial Development by Product, 2009-2013
Revenue and Net Income of Gansu Mogao Industrial Development, 2013-2016E
Revenue and Net Income of Yantai Grand Dragon Wines, 2011-2013
Revenue of Yantai Grand Dragon Wines by Product, 2011-2013
Revenue of Yantai Grand Dragon Wines by Region, 2011-2013
Gross Margin of Yantai Grand Dragon Wines, 2011-2013
Revenue and Net Income of Yantai Grand Dragon Wines, 2013-2016E
Revenue and Net Income of Dynasty Wines, 2008-2012
Gross Margin of Dynasty, 2008-2012
Numbers of Exclusive Shop of Dynasty, 2012
Revenue and Net Income of Dynasty, 2011-2014E
Forecast of Wine Output and Apparent Consumption in China
Revenue and Gross Profit of Major Chinese Wine Enterprises, 2013
Revenue and Net Income of Major Chinese Wine Enterprises, 2016E
如果这份报告不能满足您的要求,我们还可以为您定制报告,请 留言说明您的详细需求。
|