|
|
|
报告导航:研究报告—
TMT产业—电子半导体
|
|
2013-2014年全球及中国射频行业研究报告 |
 |
字数:1.7万 |
页数:100 |
图表数:115 |
|
中文电子版:8000元 |
中文纸版:4000元 |
中文(电子+纸)版:8500元 |
|
英文电子版:2200美元 |
英文纸版:2400美元 |
英文(电子+纸)版:2500美元 |
|
编号:ZYW171
|
发布日期:2014-05 |
附件:下载 |
 |
|
|
本报告主要研究GaAS类型的射频元件,内容包括:
 GaAs简介 GaAs简介
GaAs产业分析
射频下游市场分析
手机射频系统趋势
19家射频厂家研究
高通的RF360设计正在让整个手机射频行业发生革命性的变化,GaAs独霸的手机PA领域正在面临来自CMOS PA 的凌厉进攻。原本GaAs厂家都认定CMOS PA只能用在低端手机上,但是高通的CMOS PA 颠覆这个规则,高通特别为CMOS PA 设计了采用包络追踪技术的Front-end Modules,这就是QFE1100,它能够提高CMOS PA 的热效率,降低30%的热量,降低CMOS PA 的功耗20%。
中兴的旗舰手机Grand S II LTE首次采用高通的CMOS PA,也就是QFE2320 和QFE2340。QFE2320和QFE2340的组合能够覆盖所有主要的蜂窝模式,包括LTE TDD/FDD、WCDMA/HSPA+、CDMA 1x、TD-SCDMA和GSM/EDGE,以及从700MHz到2700MHz的相关射频频段。高通已经基本垄断了智能手机的Modem或CPU,高通也似乎有意垄断PA领域,不过手机厂家为了保证与供应商具备平等的地位,仍然会保留GaAs PA供应商的一席之地。
不过手机射频行业的焦点已经从PA 开始向滤波器转移。4G时代,手机射频系统最有价值的零部件是滤波器而非PA,特别是BAW。4G与3G最大的不同就是必备BAW,地区型(Regional)LTE手机需要使用1.25美元的BAW,2.25美元的SAW,而PA只要1.75美元。而全球型(Global Roaming)LTE手机需要使用3美元的SAW,3.5美元的BAW。而PA只要2美元。
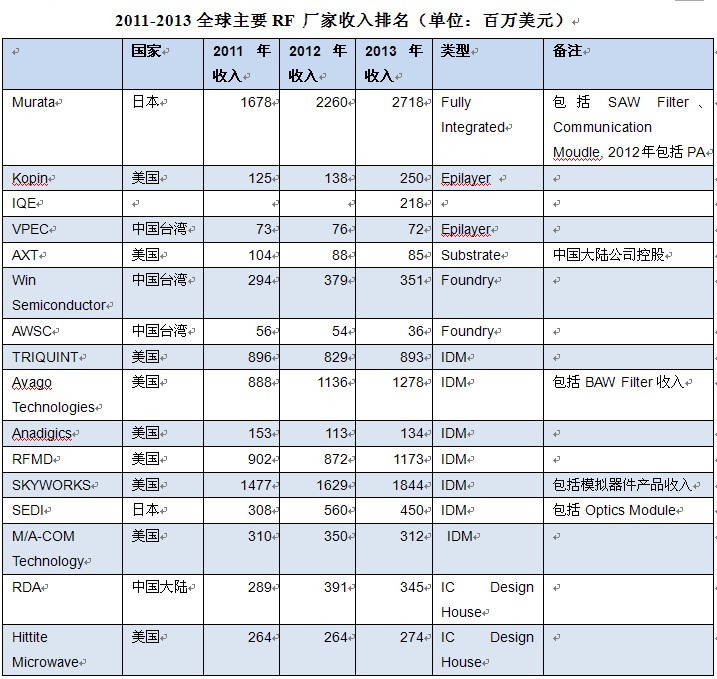
2014年射频行业内最大的事件莫过于RFMD 收购Triquint。Triquint公司2012、2013年连续亏损,2014年1季度收入同比下滑3.6%,营业利润率为负11.3%,比去年同期的负18.8%缩窄,但环比去年4季度的-3.2%又有所扩大。该公司亏损主要是2011年之前产能扩张太猛,有多达7个制造中心,而市场并未有该公司想象的那么好,于是在2012年开始亏损。Triquint对大客户依赖严重,57%的收入来自苹果,RFMD则是刚走出困境。RFMD早年过分依赖大客户NOKIA,后来被NOKIA拖累,2011年和2012年业绩不佳,但2013年已走出困境,营业收入同比大增。RFMD主要看中Triquint的BAW技术。
This report studies GaAs RF components, including:
Introduction to GaAs
Analysis on GaAs Industry
Analysis on RF downstream market
Trends of mobile RF systems
19 RF companies
Qualcomm's RF360 design is changing the entire mobile RF industry revolutionarily. GaAs PA is facing a fierce attack from CMOS PA. Qualcomm's CMOS PA subverts the opinion that CMOS PA can only be used on low-end phones. Specifically for CMOS PA, Qualcomm designs QFE1100, which is a front-end module involved with envelope tracking technology. QFE1100 can help CMOS PA improve thermal efficiency, reduce heat by 30% and cut down power consumption by 20%.
ZTE’s flagship mobile phone Grand S II LTE uses Qualcomm’s CMOS PA ------ QFE2320 and QFE2340 for the first time. The combination of QFE2320 and QFE2340 can cover all major cellular modes, including LTE TDD / FDD, WCDMA / HSPA +, CDMA 1x, TD-SCDMA and GSM / EDGE, with the RF band of 700MHz to 2700MHz. Qualcomm has basically monopolized smartphone Modem or CPU markets, and may dominate the PA field. However, mobile phone vendors will still cooperate with GaAs PA suppliers in order to ensure their equal status.
Nevertheless, the focus of mobile RF industry has been shifting from PA to filter. In the 4G era, the most valuable part of mobile RF system is filter, especially BAW, rather than PA. The biggest difference between 4G and 3G lies in BAW which is an essential part for 4G. A regional LTE phone needs a BAW valued USD1.25, a SAW worth USD2.25 and a PA which only costs USD1.75. As for a global roaming LTE phone, a SAW tagged with USD3, a BAW with USD3.5 and a PA with USD2 are required.
The biggest event in the RF industry in 2014 must be RFMD’s takeover on Triquint. Triquint suffered consecutive losses in 2012-2013; in Q1 2014, its revenue fell by 3.6% year on year, and its operating margin was negative 11.3% (negative 18.8% in the same period of previous year, negative 3.2 % in the fourth quarter of previous year). The company’s losses were mainly attributed to the aggressive capacity expansion (as much as seven manufacturing centers) before 2011 and excessive expectations. Additionally, Triquint showed serious dependence on large customers, particularly 57% of its revenue came from Apple. On the contrary, RFMD just went out of its predicament. RFMD placed undue reliance on its client NOKIA in its early years, but it witnessed poor performance in 2011-2012 under the impact of NOKIA. However, RFMD recovered in 2013 and its operating revenue increased substantially. RFMD took a fancy to Triquint’s BAW technology.
Ranking of Major Global RF Companies by Revenue, 2011-2013 (USD mln)
第一章、GAAS简介
1.1、GAAS简介
1.2、GAAS应用
1.3、GAAS、GAN、SIGE对比
1.4、GAAS制造工艺
1.4.1、BiHEMT
1.4.2、BiHEMT
第二章、GAAS产业
2.1、GAAS产业链
2.2、全球GAAS产能
2.3、GAAS供需分析
2.4、GAAS厂家排名
第三章、GAAS下游市场
3.1、网络设备市场
3.2、手机市场
3.3、全球手机市场规模
3.4、智能手机市场与产业
3.5、中国手机市场与产业概况
3.6、平板电脑市场
3.7、笔记本电脑市场
第四章、无线射频系统前端分析
4.1、ANALYSIS OF RF SYSTEM OF LATEST HANDSETS AND TABLETS
4.2、手机射频前段系统
4.3、手机滤波器
4.3.1、BAW与SAW
4.3.2、TDK-EPC
4.4、手机天线开关
4.5、手机
4.6、手机PA与手机品牌配套关系
4.7、QUALCOMM RF 360
4.8、GAAS PA、RF MEMS、CMOS PA之争
第五章、GAAS厂家研究
5.1、MURATA
5.2、KOPIN
5.3、住友电气半导体分部
5.4、FREIBERGER
5.5、AXT
5.6、IQE
5.7、稳懋
5.8、宏捷科技
5.9、全新光电
5.10、GCS
5.11、TRIQUINT
5.12、AVAGO
5.13、ANADIGICS
5.14、RFMD
5.15、锐迪科
5.16、SKYWORKS
5.17、SEDI
5.18、HITTITE MICROWAVE
5.19、M/A-COM TECHNOLOGY
1 Overview of GaAs
1.1 Introduction
1.2 Application
1.3 Comparison between GaAs, GAN and SIGE
1.4 GaAs Manufacturing Process
1.4.1 BiHEMT
1.4.2 BiHEMT
2 GaAs Industry
2.1 Industry Chain
2.2 Global Capacity
2.3 Supply and Demand
2.4 Ranking of Enterprises
3 GaAs Downstream Markets
3.1 Network Equipment
3.2 Mobile Phones
3.3 Global Mobile Phone Market Size
3.4 Smart Phone Market and Industry
3.5 Chinese Mobile Phone Market and Industry
3.6 Tablet PC
3.7 Laptop Computer
4 Wireless RF Front-end System
4.1 Analysis on RF System of Latest Mobile Phones and Tablet PCs
4.2 Mobile RF Front-end System
4.3 Mobile Filter
4.3.1 BAW and SAW
4.3.2 TDK-EPC
4.4 Mobile Phone Antenna Switch
4.5 Mobile Phone
4.6 Relationship between Mobile PA and Mobile Phone Brands
4.6 QUALCOMM RF 360
4.7 Comparison between GaAs PA, RF MEMS and CMOS PA
5 GaAs Enterprises
5.1 MURATA
5.2 KOPIN
5.3 Semiconductor Division of Sumitomo Electric
5.4 FREIBERGER
5.5 AXT
5.6 IQE
5.7 WIN Semiconductor
5.8 AWSC
5.9 VPEC
5.10 GCS
5.11 TRIQUINT
5.12 AVAGO
5.13 ANADIGICS
5.14 RFMD
5.15 RDA
5.16 SKYWORKS
5.17 SEDI
5.18 HITTITE MICROWAVE
5.19 M/A-COM TECHNOLOGY
GaAs产业链主要厂家
2008年-2013年全球主要GaAs IDM厂家产能
2008年-2013年全球主要GaAs Foundry厂家产能
2010-2015全球GaAs需求分析
全球GaAs厂家产能市场占有率
2010-2015全球无线家用网络设备出货量
2010-2015全球企业级网络设备出货量
2010-2014年全球Wi-Fi设备出货量
2010-2015年4G手机所占比例
2010-2015年平均每部手机PA使用量
2011年1季度-2013年4季度全球手机出货量
2007-2014年全球手机出货量
2011-2014年全球3G/4G手机出货量地域分布
Worldwide Smartphone Sales to End Users by Vendor in 2013 (Thousands of Units)
Worldwide Smartphone Sales to End Users by Operating System in 2013 (Thousands of Units)
Worldwide Mobile Phone Sales to End Users by Vendor in 2013 (Thousands of Units)
2013年2季度智能手机操作系统出货量和市场占有率
2013年2季度主要安卓手机厂商出货量和市场占有率
2013年2季度主要Windows Phone 智能手机厂商出货量和市场占有率
2011-2013中国主要厂家智能手机出货量
2013年2-12月中国手机月度产量
2013年1-12月中国手机月度出口额
2013年2-12月中国手机行业月度收入与利润
2011-2016年全球平板电脑出货量
2013年平板电脑主要品牌市场占有率
2012、2013年全球平板电脑制造厂家产量
2008-2015年笔记本电脑出货量
2010-2013年全球主要笔记本电脑ODM厂家出货量(万台)
Handset and Tablets –RF Architecture
SAMSUNG GALAXY S4 RF System
GOOGLE NEXUS 4 RF System
IPHONE 5 RF System
2010-2016年手机中滤波器与双工器市场规模
2011年BAW、SAW主要厂家市场占有率
2013-2016年Premium Filters市场规模
BAW与SAW波段分布
BAW与SAW对比
2008-2011年TDK-EPC收入与EBIT
2008-2011年TDK-EPC收入产品分布
2010-2016年手机天线开关出货量技术分布
2012年全球手机天线开关主要厂家市场占有率
2010-2012年全球主要手机PA厂家收入
2011年3G、4G手机PA主要厂家市场占有率
2012年3G、4G手机PA主要厂家市场占有率
2011年2G手机PA主要厂家市场占有率
2010-2012年诺基亚手机PA主要供应厂家比例
2010-2012年三星手机PA主要供应厂家比例
2010-2012年LG手机PA主要供应厂家比例
2011-2012年中国白牌(Grey Brand)手机PA市场主要厂家市场占有率
2011-2012年APPLE PA主要供应厂家比例
Rf360 Architecture
FY2009-FY2014 Murata Sales and Operation Margin
FY2009-FY2013 Murata Sales by region
2010财年3季度-2013财年3季度Murata收入、新订单与Backlog
2010年3季度-2013年3季度Murata运营利润、净利润
FY12Q1-FY13Q3 Murata Order by Product
FY12Q1-FY13Q3 Murata Sales by Product
FY12Q1-FY13Q3 Murata Sales by Application
2010-2011年全球GaAs Epilayer厂家市场占有率
Kopin全球分布
2006-2011年KOPIN收入与运营利润率
2008-2011年KOPIN收入业务分布
2008-2011年KOPIN收入客户分布
2004-2013年AXT收入与运营利润率
2006-2013年AXT收入产品分布
2006-2013年AXT收入地域分布
2005-2013年IQE收入与运营利润率
2008-2013年IQE收入业务分布
2008-2013年IQE收入地域分布
稳懋组织结构
稳懋各部门职掌
2006-2013年稳懋收入与运营利润率
2012年3月-2014年3月稳懋月度收入
2005-2013年稳懋Manufacturing Capacity
2009-2013年稳懋Production Yield
稳懋核心竞争力
宏捷科技组织结构
2006-2014年宏捷科技收入与毛利率
2012年3月-2014年3月宏捷科技月度收入
2005-2013年VPEC收入与运营利润率
2012年3月-2014年3月VPEC月度收入
2012年1季度-2013年4季度VPEC收入产品分布
2001-2013年TRIQUNIT收入与毛利率
2008-2013年TRIQUNIT收入与营业利润率
2005-2013年TRIQUINT收入业务分布
2005-2013年TRIQUINT手机业务收入制式分布
2011-2013年TRIQUINT Network事业部收入产品分布
智能手机RF架构趋势
FY2004-FY2014 AVAGO Revenue and Operation Margin
FY2007-FY2013 AVAGO Revenue by segment
2011-2013财年Avago收入地域分布
2003-2013年ANADIGICS收入与毛利率
2007-2013年ANADIGICS收入客户分布
2005-2012年ANADIGICS收入业务分布
2008-2013年ANADIGICS收入地域分布
2002-2014财年RFMD收入与运营利润率
2009-2014财年RFMD收入部门分布
2010-2013财年RFMD收入地域分布
2007-2013年RDA收入与运营利润率
2009年1季度-2012年1季度RDA收入
RDA Baseband Product Roadmap
RDA Product Roadmap
RDA Main Customer
2011年1季度-2013年1季度RDA毛利率
RDA产品中国市场占有率
RDA产品时间表
RDA收入产品分布
2007-2014财年SKYWORKS收入与毛利率
2007-2014财年SKYWORKS收入与营业利润率
2007-2013财年SKYWORKS各项支出
2005-2013财年SKYWORKS收入地域分布
2007-2013财年SKYWORKS收入客户分布
2007-2013年Hittite Microwave收入与运营利润
2007-2013年M/A-COM收入与运营利润
2010-2012年M/A-COM收入产品分布
Major GaAs Industry Chain Enterprises
Capacity of Major Global GaAs IDM Enterprises, 2008-2013
Capacity of Major Global GaAs Foundry Vendors, 2008-2013
Global GaAs Demand, 2010-2015E
Market Share of Global GaAs Enterprises by Capacity
Global Wireless Home Network Device Shipment, 2010-2015E
Global Wireless Corporate Network Device Shipment, 2010-2015E
Global Wi-Fi Device Shipment, 2010-2014
Proportion of 4G Mobile Phones, 2010-2015E
PA Usage per Mobile Phone, 2010-2015E
Global Mobile Phone Shipment, Q1 2011-Q4 2013
Global Mobile Phone Shipment, 2007-2014
Global 3G/4G Mobile Phone Shipment by Region, 2011-2014
Worldwide Smartphone Sales to End Users by Vendor in 2013 (Thousands of Units)
Worldwide Smartphone Sales to End Users by Operating System in 2013 (Thousands of Units)
Worldwide Mobile Phone Sales to End Users by Vendor in 2013 (Thousands of Units)
Shipment and Market Share of Smartphone Operating System, Q2 2013
Shipment and Market Share of Major Android Phone Vendors, Q2 2013
Shipment and Market Share of Major Windows Smartphone Vendors, Q2 2013
Smartphone Shipment of Major Vendors in China, 2011-2013
Monthly Mobile Phone Output in China, Feb-Dec, 2013
Monthly Mobile Phone Export value in China, 2013
Monthly Revenue and Profit of China's Mobile Phone Industry, Feb-Dec, 2013
Global Tablet PC Shipment, 2011-2016E
Market Share of Major Tablet PC Brands, 2013
Output of Global Tablet PC Manufacturing Enterprises, 2012-2013
Laptop computer Shipment, 2008-2015E
Shipment of Major Global Laptop ODM Vendors, 2010-2013
Handset and Tablets –RF Architecture
SAMSUNG GALAXY S4 RF System
GOOGLE NEXUS 4 RF System
IPHONE 5 RF System
Mobile Phone Filter and Duplexer Market Size, 2010-2016E
Market Share of Major BAW and SAW Enterprises, 2011
Premium Filter Market Size, 2013-2016E
Band Distribution of BAW and SAW
Contrast between BAW and SAW
TDK-EPC’s Revenue and EBIT, 2008-2011
TDK-EPC’s Revenue by Product, 2008-2011
Mobile Phone Antenna Switch Shipment by Technology, 2010-2016E
Market Share of Major Global Mobile Phone Antenna Switch Enterprises, 2012
Revenue of Major Global Mobile Phone PA Enterprises, 2010-2012
Market Share of Major 3G and 4G Mobile Phone PA Enterprises, 2011
Market Share of Major 3G and 4G Mobile Phone PA Enterprises, 2012
Market Share of Major 2G Mobile Phone PA Enterprises, 2011
Major Mobile Phone PA Supplier Structure of Nokia, 2010-2012
Major Mobile Phone PA Supplier Structure of Samsung, 2010-2012
Major Mobile Phone PA Supplier Structure of LG, 2010-2012
Share of Major Enterprises in Chinese Grey Brand Mobile Phone PA Market, 2011-2012
Major Mobile Phone PA Supplier Structure of APPLE, 2011-2012
RF360 Architecture
Murata’s Sales and Operation Margin, FY2009-FY2014
Murata’s Sales by region, FY2009-FY2013
Murata’s Revenue, New Orders and Backlog, Q3 FY2010- Q3 FY2013
Murata’s Operating Profit and Net Income, Q3 2010- Q3 2013
Murata’s Order by Product, FY12Q1-FY13Q3
Murata’s Sales by Product, FY12Q1-FY13Q3
Murata’s Sales by Application, FY12Q1-FY13Q3
Market Share of Global GaAs Epilayer Enterprises, 2010-2011
Kopin’s Global Distribution
KOPIN's Revenue and Operating Margin, 2006-2011
KOPIN's Revenue by Business, 2008-2011
KOPIN's Revenue by Client, 2008-2011
AXT's Revenue and Operating Margin, 2004-2013
AXT's Revenue by Product, 2006-2013
AXT's Revenue by Region, 2006-2013
IQE's Revenue and Operating Margin, 2005-2013
IQE's Revenue by Business, 2008-2013
IQE's Revenue by Region, 2008-2013
Organizational Structure of WIN Semiconductor
Divisions of WIN Semiconductor
Revenue and Operating Margin of WIN Semiconductor, 2006-2013
Monthly Revenue of WIN Semiconductor, Mar 2012- Mar 2014
Capacity of WIN Semiconductor, 2005-2013
Output of WIN Semiconductor Production Yield, 2009-2013
Core Competitiveness of WIN Semiconductor
AWSC’s Organizational Structure
AWSC’s Revenue and Gross Margin, 2006-2014
AWSC’s Monthly Revenue, Mar 2012- Mar 2014
VPEC’s Revenue and Operating Margin, 2005-2013
VPEC’s Monthly Revenue, Mar 2012- Mar 2014
VPEC’s Revenue by Product, Q1 2012-Q4 2013
TRIQUNIT’s Revenue and Gross Margin, 2001-2013
TRIQUNIT’s Revenue and Operating Margin, 2008-2013
TRIQUNIT’s Revenue by Business, 2005-2013
TRIQUNIT’s Mobile Phone Revenue by System, 2005-2013
Revenue of TRIQUNIT’s Network Division by Product, 2011-2013
Trends of Smartphone RF Architecture
AVAGO’s Revenue and Operation Margin, FY2004-FY2014
AVAGO’s Revenue by Segment, FY2007-FY2013
AVAGO’s Revenue by Region, FY2011-2013
Revenue and Gross Margin of ANADIGICS, 2003-2013
Revenue of ANADIGICS by Client, 2007-2013
Revenue of ANADIGICS by Business, 2005-2012
Revenue of ANADIGICS by Region, 2008-2013
RFMD's Revenue and Operating Margin, FY2002-2014
RFMD's Revenue by Division, FY2009-2014
RFMD's Revenue by Region, FY2010-2013
RDA's Revenue and Operating Margin, 2007-2013
RDA's Revenue, Q1 2009-Q1 2012
RDA's Baseband Product Roadmap
RDA's Product Roadmap
RDA's Main Customer
RDA's Gross Margin, Q1 2011-Q1 2013
RDA's Market Share in China
RDA's Product Schedule
RDA's Revenue by Product
Revenue and Gross Margin of SKYWORKS, FY2007-FY2014
Revenue and Operating Margin of SKYWORKS, FY2007-FY2014
Expenses of SKYWORKS, FY2007-FY2013
Revenue of SKYWORKS by Region, FY2005-FY2013
Revenue of SKYWORKS by Client, FY2007-FY2013
Revenue and Operating Profit of Hittite Microwave, 2007-2013
M / A-COM Revenue and Operating Profit, 2007-2013
M / A-COM Revenue by Product, 2010-2012
如果这份报告不能满足您的要求,我们还可以为您定制报告,请 留言说明您的详细需求。
|