|
|
|
报告导航:研究报告—
制造业—能源矿产
|
|
2013-2016年中国石油天然气钻采及输送用钢管市场研究报告 |
 |
字数:3.1万 |
页数:100 |
图表数:104 |
|
中文电子版:8000元 |
中文纸版:4000元 |
中文(电子+纸)版:8500元 |
|
英文电子版:2250美元 |
英文纸版:2400美元 |
英文(电子+纸)版:2550美元 |
|
编号:YDN003
|
发布日期:2014-05 |
附件:下载 |
 |
|
|
近年来,随着中国经济的持续稳定发展以及工业化进程的加快,中国石油和天然气消费需求保持较快增长。 2013年,中国石油和天然气消费量分别达4.98亿吨和1676亿立方米,同比分别增长4.5%和14.6%。
随着石油、天然气需求的持续增长,中国油气管网建设力度也持续加大。 2013 年,中国油气管网格局初步形成,总里程达 10.62 万公里。按照“十二五”规划,到2015 年,中国油气管道总长度将达到15 万公里左右。这将一定程度上带动包括中国油气输送钢管等在内的相关材料行业的发展。
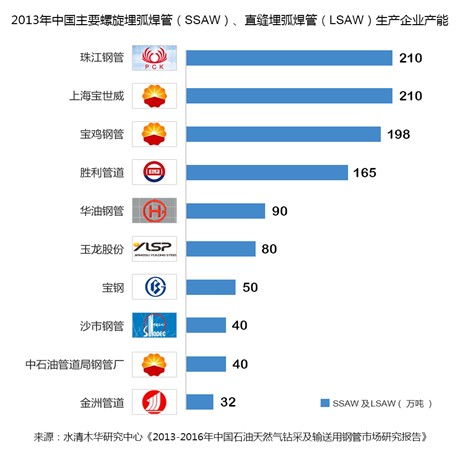
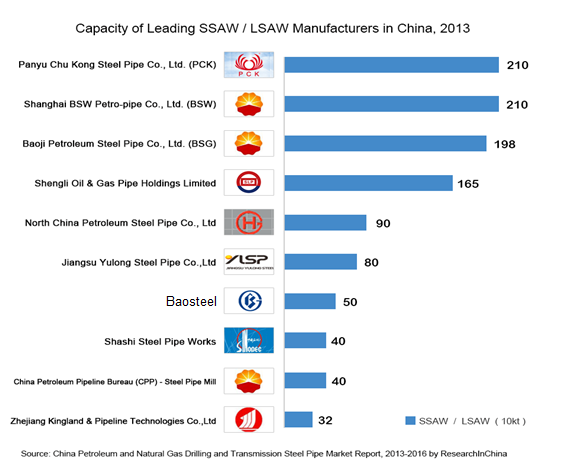
油气输送管网建设所需钢管包括焊管和无缝钢管,其中,螺旋埋弧焊管(SSAW)、直缝埋弧焊管(LSAW)是需求主体。截至2013年底,中国在建/拟建的油气输送主干线有6条;中石油、中海油天然气区域配套管网在建/拟建项目合计10条,均相继于2014-2016年竣工。而仅上述16条管网建设就需要SSAW、LSAW约1119万吨,其中SSAW、直缝埋弧焊LSAW分别占70%、30%。
中国主要的SSAW、LSAW生产厂家有胜利管道、珠江钢管、宝鸡钢管等。珠江钢管是中国最大的直缝焊管制造商。截至2013年底,珠江钢管四大生产基地共配备6条直缝焊管生产线,年产能达190万吨;另有两条螺旋焊管机和一条高频电阻焊管生产线,产能合计81万吨/年。
油井管主要应用于石油天然气的勘探和开采,包括油管、套管和钻杆。2013年,中国油井管产量约为580万吨,表观消费量达450万吨左右。
目前,中国油井管市场竞争格局相对比较稳定,宝钢、常宝股份、无锡西姆莱斯、安徽天大、华菱衡钢等主要生产商占据80%以上的市场份额。并且,为了顺应油井管市场出现的新变化(石油开采向深井超深井延伸、地质环境越来越复杂等),部分生产商正在调整其产品结构,如常宝股份。
截至2013年底,常宝股份总投资额1.59亿元的高端油井管加工线工程进度已超过80%。该项目是在原有设备基础上进行的产品升级,包括8.5万吨非 API 油管热处理生产线和4万吨成品管车丝线。
水清木华研究中心《2013-2016年中国石油天然气钻采及输送用钢管市场研究报告》着重研究了以下内容:
 全球及中国石油、天然气市场发展概况,包括供应分析和需求分析等; 全球及中国石油、天然气市场发展概况,包括供应分析和需求分析等;
中国无缝钢管行业发展概况,包括供应分析、进出口分析、需求分析和价格分析等;
中国焊接钢管行业发展概况,包括供应分析、进出口分析、需求分析和消费结构等;
中国石油天然气用管市场概况,包括市场规模和市场竞争格局等;
中国15家重点钢管生产企业(包括宝钢股份、华菱钢铁、常宝股份、金洲管道等)的经营情况及油气管业务分析等。
Along with the sustained and stable development of China's economy as well as the accelerated industrialization, China’s demand for oil and natural gas has kept rising rapidly in recent years. In 2013, China's oil and natural gas consumption reached 498 million tons and 167.6 billion cubic meters respectively, up 4.5% and 14.6 % year-on-year.
Amid the jumping demand for oil and natural gas, China has enhanced the construction of oil and gas pipeline networks. In 2013, Chinese oil and gas pipeline network pattern initially formed with the total mileage of 106,200 kilometers. In accordance with "Twelfth Five-Year Plan", the total length will be about 150,000 km by 2015, which will boost the development of oil and gas transmission steel pipes and other related materials to a certain extent.
Welded pipes and seamless steel pipes, especailly SSAW (Spirally Submerged Arc Welding) and LSAW (Longitudinally Submerged Arc Welding), are required in the construction of oil and gas transmission pipeline networks. As of the end of 2013, China had been building and proposed to set up six trunk oil and gas transmission pipelines; CNPC and CNOOC had been establishing and planned 10 gas pipelines which will be completed successively in 2014-2016. The above 16 pipelines need about 11.19 million tons of SSAW (70%) and LSAW (30 %).
In China, major SSAW and LSAW manufacturers consist of Shengli Oil & Gas Pipe, PCK, Baoji Petroleum Steel Pipe and so on. PCK is China's largest longitudinal welded pipe manufacturer. At the end of 2013, PCK’s four production bases were equipped with six longitudinal welded pipe production lines with the annual capacity of 1.9 million tons, two spiral welded pipe machine production lines and a high-frequency ERW (electirc resistance welding) pipe production line with the combined annual capacity of 810,000 tons.
Oil well pipes are mainly used in oil and gas exploration and exploitation, devived into tubings, casings and drill pipes. In 2013, China produced about 5.8 million tons of oil well pipes, and the apparent consumption approximated 4.5 million tons.
At present, the competition pattern in Chinese oil well pipe market remains stable in a relative sense, and main players like Baosteel, Changbao Steeltube, WUXI SEAMLESS OIL PIPE, Anhui Tianda and Hengyang Valin Steel Tube occupy more than 80% market share. Moreover, to adapt themselves to the new situation that oil exploration heads toward deep and ultra deep wells as well as geological environments become increasingly complex, some manufacturers represented by Changbao Steeltube are adjusting their product mix.
By the end of 2013, Changbao Steeltube had accomplished 80 % of its high-end oil well pipe processing line project invovled with the total investment of RMB159 million. The project is to upgrade products on the basis of the original equipment, including one 85,000-ton non-API tubing heat treatment production line and one 40,000-ton finished pipe thread line.
The report highlights the followings:
 Overview of global and Chinese petroleum and natural gas market, including supply and demand analysis; Overview of global and Chinese petroleum and natural gas market, including supply and demand analysis;
Overview of China seamless steel pipe industry, covering supply, import & export, demand and price analysis;
Overview of China welded steel pipe industry, covering supply, import, export, demand and consumption structure;
Overview of Chinese oil and gas-use pipe market, including market size and competition pattern;
Operation and oil & gas pipe business of 15 major Chinese steel pipe manufacturers such as Baosteel, Valin Steel, Changbao Steeltube, and Kingland Pipeline.
第一章 全球石油天然气市场概况
1.1 石油市场
1.1.1 石油供应分析
1.1.2 石油需求分析
1.2 天然气市场
1.2.1 天然气供应分析
1.2.2 天然气需求分析
第二章 中国石油天然气市场概况
2.1 石油市场
2.1.1 石油供应分析
2.1.2 石油需求分析
2.2 天然气市场
2.2.1 天然气供应分析
2.2.2 天然气需求分析
第三章 中国无缝钢管行业发展概况
3.1 无缝钢管定义
3.2 供应分析
3.3 进出口分析
3.3.1 出口分析
3.3.2 进口分析
3.4 需求分析
3.5 价格分析
第四章 中国焊接钢管行业发展概况
4.1 焊接钢管定义
4.2 供应分析
4.3 进出口分析
4.3.1 出口分析
4.3.2 进口分析
4.4 需求分析
第五章 中国石油天然气用管市场概况
5.1 输送用管
5.1.1 市场规模
5.1.2 市场竞争
5.2 油井管
5.2.1 市场规模
5.2.2 市场竞争
第六章 中国重点油气管生产企业
6.1 宝钢股份
6.1.1 公司简介
6.1.2 经营情况
6.1.3 收入构成
6.1.4 毛利率
6.1.5 钢管业务
6.1.6 预测与展望
6.2 华菱钢铁
6.2.1 公司简介
6.2.2 经营情况
6.2.3 收入构成
6.2.4 毛利率
6.2.5 钢管业务
6.2.6 预测与展望
6.3 常宝股份
6.3.1 公司简介
6.3.2 经营情况
6.3.3 收入构成
6.3.4 毛利率
6.3.5 钢管业务
6.3.6 预测与展望
6.4 金洲管道
6.4.1 公司简介
6.4.2 经营情况
6.4.3 收入构成
6.4.4 毛利率
6.4.5 钢管业务
6.4.6 预测与展望
6.5 玉龙股份
6.5.1 公司简介
6.5.2 经营情况
6.5.3 收入构成
6.5.4 毛利率
6.5.5 钢管业务
6.5.6 预测与展望
6.6 山东墨龙
6.6.1 公司简介
6.6.2 经营情况
6.6.3 收入构成
6.6.4 毛利率
6.6.5 钢管业务
6.6.6 预测与展望
6.7 天大石油管材
6.7.1 公司简介
6.7.2 经营情况
6.7.3 毛利率
6.7.4 钢管业务
6.7.5 预测与展望
6.8 天津钢管
6.8.1 公司简介
6.8.2 经营情况
6.8.3 收入构成
6.8.4 毛利率
6.8.5 钢管业务
6.8.6 预测及展望
6.9 胜利管道
6.9.1 公司简介
6.9.2 经营情况
6.9.3 收入构成
6.9.4 毛利率
6.9.5 钢管业务
6.9.6 预测及展望
6.10 珠江钢管
6.10.1 公司简介
6.10.2 经营情况
6.10.3 收入构成
6.10.4 毛利率
6.10.5 钢管业务
6.10.6 预测及展望
6.11 攀成钢
6.11.1 公司简介
6.11.2 经营情况
6.12 诚德钢管
6.12.1 公司简介
6.12.2 经营情况
6.12.3 扬州诚德
6.13 无锡西姆莱斯
6.13.1 公司简介
6.13.2 经营情况
6.13.3 毛利率
6.14 江苏振达
6.15 宝鸡钢管
6.15.1 公司简介
6.15.2 经营情况
第七章 总结与预测
7.1 总结
7.2 预测
1 Overview of Global Petroleum and Natural Gas Market
1.1 Petroleum Market
1.1.1 Supply
1.1.2 Demand
1.2 Natural Gas Market
1.2.1 Supply
1.2.2 Demand
2 Overview of Chinese Petroleum and Natural Gas Market
2.1 Petroleum Market
2.1.1 Supply
2.1.2 Demand
2.2 Natural Gas Market
2.2.1 Supply
2.2.2 Demand
3 Overview of China Seamless Steel Pipe Industry
3.1 Definition
3.2 Supply
3.3 Import and Export
3.3.1 Export
3.3.2 Import
3.4 Demand
3.5 Price
4 Overview of China Welded Steel Pipe Industry
4.1 Definition
4.2 Supply
4.3 Import and Export
4.3.1 Export
4.3.2 Import
4.4 Demand
5 Overview of Chinese Oil and Gas-use Pipe Market
5.1 Transmission Pipes
5.1.1 Market Scale
5.1.2 Market Competition
5.2 Oil Well Pipes
5.2.1 Market Scale
5.2.2 Market Competition
6 Major Chinese Oil and Gas Pipe Manufacturers
6.1 Baosteel
6.1.1 Profile
6.1.2 Operation
6.1.3 Revenue Structure
6.1.4 Gross Margin
6.1.5 Steel Pipe Business
6.1.6 Forecast and Outlook
6.2 Valin Steel
6.2.1 Profile
6.2.2 Operation
6.2.3 Revenue Structure
6.2.4 Gross Margin
6.2.5 Steel Pipe Business
6.2.6 Forecast and Outlook
6.3 Changbao Steeltube
6.3.1 Profile
6.3.2 Operation
6.3.3 Revenue Structure
6.3.4 Gross Margin
6.3.5 Steel Pipe Business
6.3.6 Forecast and Outlook
6.4 Kingland Pipeline
6.4.1 Profile
6.4.2 Operation
6.4.3 Revenue Structure
6.4.4 Gross Margin
6.4.5 Steel Pipe Business
6.4.6 Forecast and Outlook
6.5 Yulong Steel Pipe
6.5.1 Profile
6.5.2 Operation
6.5.3 Revenue Structure
6.5.4 Gross Margin
6.5.5 Steel Pipe Business
6.5.6 Forecast and Outlook
6.6 Shandong Molong
6.6.1 Profile
6.6.2 Operation
6.6.3 Revenue Structure
6.6.4 Gross Margin
6.6.5 Steel Pipe Business
6.6.6 Forecast and Outlook
6.7 Tianda Oil Pipe
6.7.1 Profile
6.7.2 Operation
6.7.3 Gross Margin
6.7.4 Steel Pipe Business
6.7.5 Forecast and Outlook
6.8 Tianjin Pipe
6.8.1 Profile
6.8.2 Operation
6.8.3 Revenue Structure
6.8.4 Gross Margin
6.8.5 Steel Pipe Business
6.8.6 Forecast and Outlook
6.9 Shengli Oil & Gas Pipe
6.9.1 Profile
6.9.2 Operation
6.9.3 Revenue Structure
6.9.4 Gross Margin
6.9.5 Steel Pipe Business
6.9.6 Forecast and Outlook
6.10 PCK
6.10.1 Profile
6.10.2 Operation
6.10.3 Revenue Structure
6.10.4 Gross Margin
6.10.5 Steel Pipe Business
6.10.6 Forecast and Outlook
6.11 Pangang Group Chengdu Steel & Vanadium
6.11.1 Profile
6.11.2 Operation
6.12 Chengde Steel Pipe
6.12.1 Profile
6.12.2 Operation
6.12.3 Yangzhou Chengde
6.13 Wuxi Seamless Oil Pipe
6.13.1 Profile
6.13.2 Operation
6.13.3 Gross Margin
6.14 Zhenda Steel
6.15 Baoji Petroleum Steel Pipe
6.15.1 Profile
6.15.2 Operation
7 Summary and Forecast
7.1 Summary
7.2 Forecast
图:2012年全球石油探明储量分布结构
图:2012年全球石油(分区域)储产比
图:2006-2013年全球石油产量
图:2006-2013年全球石油消费量
图:2011-2013年OPEC一揽子原油价格
图:2012年全球天然气探明储量分布结构
图:2012年全球天然气(分区域)储产比
图:2006-2013年全球天然气产量
图:2006-2013年全球天然气消费量
图:2006-2013年中国石油产量
图:2006-2013年中国石油消费量
图:2006-2013年中国原油进口量与出口量
图:2006-2013年中国天然气产量
图:2006-2013年中国天然气消费量
图:2006-2013年中国无缝钢管产量
图:2013年中国无缝钢管(分地区)产量分布
表:2012年中国各类型无缝钢管产线数目及产能分布
表:2012年中国8家国营大型无缝钢管生产企业(分品种)产量占比
表:2012年中国8家国营大型无缝钢管生产企业出口比重
图:2006-2013年中国无缝钢管出口量
图:2006-2013年中国无缝钢管出口额
图:2006-2013年中国无缝钢管进口量
图:2006-2013年中国无缝钢管进口额
图:2006-2013年中国无缝钢管表观消费量
图:2013年中国无缝钢管(分地区)销售结构
图:2013年中国重点企业无缝钢管销售结构
图:2006-2013年中国无缝钢管现货价格
图:2006-2013年中国焊管产量
图:2006-2013年中国焊管出口量
图:2006-2013年中国焊管出口额
图:2006-2013年中国焊管进口量
图:2006-2013年中国焊管进口额
图:2006-2013年中国焊管表观消费量
图:2013年中国焊管(分地区)销售结构
图:2013年中国重点企业焊管销售结构
图:2006-2015年中国油气输送管道长度
表:2012-2015年中国油气输送主干管网用钢管需求规模
表:2011-2015年中石油、中海油天然气区域配套管网用钢需求规模
表:2013年中国主要SSAW、LSAW生产企业产能
表:2011-2015年中石化、中海油部分已建、在建、拟建管道
图:2013年中国油气管道需求结构
图:2010-2015年全球油井管需求量
图:2006-2013年中石油、中石化勘探开采规模及增速
图:2009-2013年中国油井管需求量
图:2000-2015年中国油井管产量及表观消费量
图:2008-2013年宝钢股份营业收入及净利润
表:2011-2013年宝钢股份(分产品)营业收入及占比
图:2008-2013年宝钢股份(分地区)毛利率
表:2013年宝钢股份主要钢管子公司
图:2008-2013年宝钢股份钢管产品销量
图:2009-2013年宝钢股份钢管产品营业收入及毛利率
图:2010-2016年宝钢股份营业收入及净利润预测
图:2008-2013年华菱钢铁营业收入及净利润
图:2010-2013年华菱钢铁(分产品)营业收入结构
表:2011-2013年华菱钢铁毛利率
图:2008-2013年华菱钢铁钢管业务营业收入及毛利率
图:2012-2016年华菱钢铁营业收入与净利润预测
图:2008-2013年常宝股份营业收入及净利润
表:2011-2013年常宝股份(分产品)营业收入及占比
表:2011-2013年常宝股份(分地区)主营业务营业收入及占比
表:2011-2013年常宝股份(分产品)毛利率
表:2013年常宝股份主要生产线及产能
图:2010-2016年常宝股份营业收入及净利润预测
图:2008-2013年金洲管道营业收入及净利润
表:2011-2013年金洲管道(分产品)营业收入及占比
表:2011-2013年金洲管道(分地区)主营业务营业收入及占比
表:2008-2013年金洲管道(分产品)毛利率
表:2011-2013年金洲管道(分产品)产量
图:2010-2016年金洲管道营业收入及净利润预测
图:2008-2013年玉龙股份营业收入及净利润
表:2011-2013年玉龙股份(分产品)营业收入及占比
表:2011-2013年玉龙股份(分地区)主营业务营业收入及占比
表:2010-2013年玉龙股份(分产品)毛利率
表:2010-2016年玉龙股份营业收入及净利润预测
图:2008-2013年山东墨龙营业收入及净利润
表:2011-2013年山东墨龙(分产品)营业收入及占比
表:2011-2013年山东墨龙(分地区)主营业务营业收入及占比
表:2010-2013年山东墨龙(分产品)毛利率
表:2010-2016年山东墨龙营业收入及净利润预测
图:2008-2013年天大石油管材营业收入及净利润
图:2008-2013年天大石油管材毛利率
图:2010-2016年天大石油管材营业收入与净利润预测
表:天津钢管主要产品系列
图:2008-2013年天津钢管营业收入及净利润
表:2011-2013年天津钢管(分产品)营业收入及占比
表:2010-2013年天津钢管(分产品)毛利率
图:2010-2016年天津钢管营业收入与净利润预测
图:2008-2013年胜利管道营业收入及净利润
表:2012-2013年胜利管道(分产品)营业收入及占比
图:2008-2013年胜利管道销售毛利率
图:2010-2016年胜利管道营业收入及净利润预测
图:2008-2013年珠江钢管营业收入及净利润
表:2011-2013年珠江钢管(分地区)营业收入及占比
图:2008-2013年珠江钢管毛利率
图:2010-2016年珠江钢管营业收入及净利润预测
图:2009-2011年攀成钢主要财务指标
表:2007-2009年诚德钢管主营业务收入及利润总额
表:2007-2009年扬州诚德销售收入及税前利润
图:2008-2013年无锡西姆莱斯营业收入及净利润
图:2006-2013年无锡西姆莱斯毛利率
图:2008-2020年宝鸡钢管销售收入
图:2006-2016年中国无缝钢管表观消费量
图:2006-2016年中国焊管表观消费量
图:2009-2016年中国油井管需求量
Distribution of Global Proved Oil Reserves, 2012
Global Oil Reserves / Production Ratio (by Region), 2012
Global Oil Output, 2006-2013
Global Oil Consumption, 2006-2013
OPEC Reference Basket, 2011-2013
Distribution of Global Proved Gas Reserves, 2012
Global Natural Gas Reserves / Production Ratio (by Region), 2012
Global l Natural Gas Output, 2006-2013
Global l Natural Gas Consumption, 2006-2013
China's Oil Output, 2006-2013
China's Oil Consumption, 2006-2013
China's Crude Oil Import and Export Volume, 2006-2013
China's l Natural Gas Output, 2006-2013
China's l Natural Gas Consumption, 2006-2013
China's Seamless Steel Pipe Output, 2006-2013
China's Seamless Steel Pipe Output (by Region), 2013
Number of Various Seamless Steel Pipe Production Lines and Capacity Distribution in China, 2012
Output Share of 8 Large State-owned Seamless Steel Pipe Enterprises (by Variety) in China, 2012
Export Share of 8 Large State-owned Seamless Steel Pipe Enterprises in China, 2012
China's Seamless Steel Pipe Export Volume, 2006-2013
China's Seamless Steel Pipe Export Value, 2006-2013
China's Seamless Steel Pipe Import Volume, 2006-2013
China's Seamless Steel Pipe Import Value, 2006-2013
China's Seamless Steel Pipe Apparent Consumption, 2006-2013
China's Seamless Steel Pipe Sales Structure (by Region), 2013
Seamless Steel Pipe Sales Structure of Key Enterprises in China, 2013
China's Seamless Steel Pipe Spot Price, 2006-2013
China's Welded Pipe Output, 2006-2013
China's Welded Pipe Export Volume, 2006-2013
China's Welded Pipe Export Value, 2006-2013
China's Welded Pipe Import Volume, 2006-2013
China's Welded Pipe Import Value, 2006-2013
China's Welded Pipe Apparent Consumption, 2006-2013
China's Welded Pipe Sales Structure (by Region), 2013
Welded Pipe Sales Structure of Key Enterprises in China, 2013
China’s Length of Oil and Gas Transmission Pipeline, 2006-2015E
China’s Demand for Steel Pipes Used in Trunk Oil and Gas Transmission Pipeline Networks, 2012-2015E
Demand of Gas Fields of CNPC and CNOOC for Steel Used in Supporting Pipeline Networks, 2011-2015E
Capacity of Major SSAW and LSAW Producers in China, 2013
Some Completed, Ongoing and Planned Pipelines of Sinopec and CNOOC, 2011-2015E
Structure of China’s Demand for Oil and Gas Pipelines, 2013
Global Oil Well Pipe Demand, 2010-2015E
Exploration & Exploitation Scale and Growth Rate of CNPC and Sinopec, 2006-2013
China's Oil Well Pipe Demand, 2009-2013
China's Oil Well Pipe Output and Apparent Consumption, 2000-2015E
Baosteel's Revenue and Net Income, 2008-2013
Baosteel's Revenue Breakdown and Percentage (by Product), 2011-2013
Baosteel's Gross Margin (by Region), 2008-2013
Baosteel's Main Steel Pipe Subsidiaries, 2013
Baosteel's Steel Pipe Sales Volume, 2008-2013
Baosteel's Steel Pipe Revenue and Gross Margin, 2009-2013
Baosteel's Revenue and Net Income, 2010-2016E
Revenue and Net Income of Valin Steel, 2008-2013
Revenue Structure of Valin Steel (by Product), 2010-2013
Gross Margin of Valin Steel, 2011-2013
Steel Pipe Revenue and Gross Margin of Valin Steel, 2008-2013
Revenue and Net Income of Valin Steel, 2012-2016E
Revenue and Net Income of Changbao Steeltube, 2008-2013
Revenue Breakdown and Percentage of Changbao Steeltube (by Product), 2011-2013
Operating Revenue Breakdown and Percentage of Changbao Steeltube (by Region), 2011-2013
Gross Margin of Changbao Steeltube (by Product), 2010-2013
Main Production Lines and Capacity of Changbao Steeltube, 2013
Revenue and Net Income of Changbao Steeltube, 2010-2016E
Revenue and Net Income of Kingland Pipeline, 2008-2013
Revenue Breakdown and Percentage of Kingland Pipeline (by Product), 2011-2013
Operating Revenue Breakdown and Percentage of Kingland Pipeline (by Region), 2011-2013
Gross Margin of Kingland Pipeline (by Product), 2008-2013
Output of Kingland Pipeline (by Product), 2011-2013
Revenue and Net Income of Kingland Pipeline, 2010-2016E
Revenue and Net Income of Yulong Steel Pipe, 2008-2013
Revenue Breakdown and Percentage of Yulong Steel Pipe (by Product), 2011-2013
Operating Revenue Breakdown and Percentage of Yulong Steel Pipe (by Region), 2011-2013
Gross Margin of Yulong Steel Pipe (by Product), 2010-2013
Revenue and Net Income of Yulong Steel Pipe, 2010-2016E
Revenue and Net Income of Shandong Molong, 2008-2013
Revenue Breakdown and Percentage of Shandong Molong (by Product), 2011-2013
Operating Revenue Breakdown and Percentage of Shandong Molong (by Region), 2011-2013
Gross Margin of Shandong Molong (by Product), 2010-2013
Revenue and Net Income of Shandong Molong, 2010-2016E
Revenue and Net Income of Tianda Oil Pipe, 2008-2013
Gross Margin of Tianda Oil Pipe, 2008-2013
Revenue and Net Income of Tianda Oil Pipe, 2010-2016E
Main Product Series of Tianjin Pipe
Revenue and Net Income of Tianjin Pipe, 2008-2013
Revenue Breakdown and Percentage of Tianjin Pipe (by Product), 2011-2013
Gross Margin of Tianjin Pipe (by Product), 2010-2013
Revenue and Net Income of Tianjin Pipe, 2010-2016E
Revenue and Net Income of Shengli Oil & Gas Pipe, 2008-2013
Revenue Breakdown and Percentage of Shengli Oil & Gas Pipe (by Product), 2012-2013
Sales Gross Margin of Shengli Oil & Gas Pipe, 2008-2013
Revenue and Net Income of Shengli Oil & Gas Pipe, 2010-2016E
PCK's Revenue and Net Income, 2008-2013
PCK's Revenue Breakdown and Percentage (by Region), 2011-2013
PCK's Gross Margin, 2008-2013
PCK's Revenue and Net Income of, 2010-2016E
Key Financial Indicators of Pangang Group Chengdu Steel & Vanadium, 2009-2011
Operating Revenue and Total Profit of Chengde Steel Pipe, 2007-2009
Revenue and Pre-tax Profit of Yangzhou Chengde, 2007-2009
WUXI SEAMLESS OIL PIPE's Revenue and Net Income, 2008-2013
WUXI SEAMLESS OIL PIPE's Gross Margin, 2006-2013
Revenue of Baoji Petroleum Steel Pipe, 2008-2020E
China's Seamless Steel Pipe Apparent Consumption, 2006-2016E
China's Welded Pipe Apparent Consumption, 2006-2016E
China's Oil Well Pipe Demand, 2009-2016E
如果这份报告不能满足您的要求,我们还可以为您定制报告,请 留言说明您的详细需求。
|