|
|
|
报告导航:研究报告—
制造业—能源矿产
|
|
2013-2016年中国稀土行业研究报告 |
 |
字数:6.0万 |
页数:145 |
图表数:165 |
|
中文电子版:9000元 |
中文纸版:4500元 |
中文(电子+纸)版:9500元 |
|
英文电子版:2500美元 |
英文纸版:2700美元 |
英文(电子+纸)版:2800美元 |
|
编号:ZHP003
|
发布日期:2014-05 |
附件:下载 |
 |
|
|
稀土(又称稀土金属or稀土元素)是指化学元素周期表中的镧系元素(含15种元素)以及与之密切相关的钪和钇元素的合称。目前,全球大约有35个国家和地区发现稀土资源,总计1.4亿吨。其中,中国的稀土储量占据了39.3%。
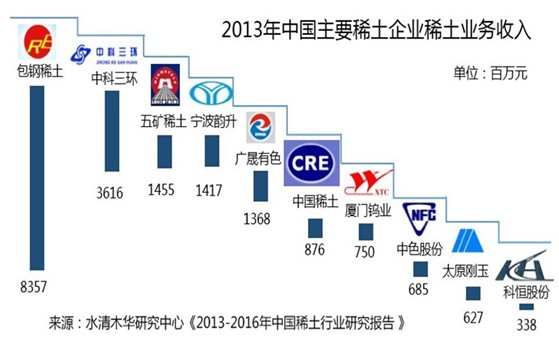
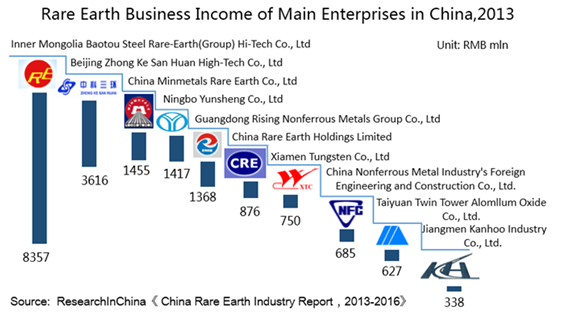
由于中国稀土资源丰富,且开采力度比较大,所以全球90%以上的稀土产量来自中国。然而,近年来,受政府对稀土资源开采量控制的影响,中国稀土产量不断下滑,2013年产量同比下降16.6%,至8.34万吨。
中国除了是稀土生产大国外,也是消费大国。2013年中国稀土消费量大约在7.9万吨左右。其中稀土在中国磁性材料领域中的消费比重最高,可达45%左右。
中国稀土及其产品除满足国内需求,还出口至美国、日本、韩国、香港等国家和地区。2013年,中国稀土产品出口量约2.25万吨,同比增长38%。但是,受国内外需求不振影响,稀土价格持续走低,从而导致2013年中国稀土产品出口额同比下降37%。
近年来,国内外经济疲软、稀土价格走低、中国限制稀土的开采量和出口额等因素都严重制约了行业的发展。为了应对市场变化带来的影响,业内大多数企业都开始完善稀土产业链。其中,五矿稀土着手扩产市场前景良好的磁性材料业务;太原刚玉开始向上游延伸,增加原材料供应;中色股份、广晟有色等企业则进一步加大稀土矿资源的开发和储备。
包钢稀土:2013年7月,完成1.5万吨永磁材料项目一期,未来将进一步扩充至3万吨产能。项目产品主要应用于计算机(VCM)、混合动力及普通汽车、风力发电机、核磁共振成像仪等。
太原刚玉:2013年6月,旗下全资子公司浙江英洛华磁业斥资9249.67万元增资赣州通诚稀土新材料公司(主营稀土钕铁硼废料加工)。增资完成后,浙江英洛华将持有通诚稀土49.95%的股权。
中色股份:2013年10月,旗下控股子公司中色南方稀土与广东省新丰县人民政府签署关于开采和经营新丰县稀土资源合作协议,在新丰县成立合资稀土矿业公司—中色南方稀土(新丰)矿业有限公司,专门从事稀土矿山开发和经营。
水清木华研究中心《2013-2016年中国稀土行业研究报告》着重研究了以下内容:
 全球稀土供给情况、消费情况、重点企业等; 全球稀土供给情况、消费情况、重点企业等;
中国稀土行业产业环境、政策环境、区域发展情况等;
中国稀土行业供需情况、出口情况、市场价格等;
中国稀土金属细分市场领域应用现状等;
中国13家重点稀土生产企业经营情况、发展动态等;
中国5家稀土新材料生产企业经营情况、发展动态等。
Rare earth, also known as rare earth metal or rare earth element, collectively refers to lanthanides (including fifteen elements) and closely-related scandium and yttrium. At present, rare earth resources have been discovered in about 35 countries and regions around the world, with total reserves of 140 million tons, of which 39.3% are owned by China.
As China is rich in rare earth resources and has made strenuous efforts in mining, over 90% of global rare earth output comes from China. However, affected by the government’s control on exploration of rare earths, the output of rare earth in China has been continuing to decline in recent years, to 83,400 tons in 2013, down 16.6% from a year ago.
China is not only a large producer of rare earth but a big consumer, with consumption in 2013 approximating 79,000 tons. Among all application fields, magnetic materials made the largest contribution, accounting for 45% or so.
Besides satisfying domestic demand, China’s rare earth and its products are also exported to the United States, Japan, South Korea and Hong Kong, with export volume of rare earth products reaching about 22,500 tons in 2013, surging by 38% from the previous year. However, hit by sluggish domestic and foreign demands, the price for rare earth has been falling, resulting in a year-on-year decline of 37% in export value of Chinese rare earth products in 2013.
In recent years, rare earth industry has been seriously jeopardized by weak international and domestic economies, falling rare earth price and China’s restriction on exploitation and export quota. In response to undesirable market changes, most of companies in the industry have started to improve the industrial chain of rare earth. Among them, China Minmetals Rare Earth Co., Ltd. set about expanding capacity of magnetic material which embraces good market prospects; Taiyuan Twin-Tower Aluminum Oxide Co., Ltd. started to expand to upstream so as to increase raw material supplies; China Nonferrous Metal Industry's Foreign Engineering and Construction Co., Ltd. and Rising Nonferrous Metals Share Co., Ltd. stepped up exploitation and reserves of rare-earth mines.
Inner Mongolia Baotou Steel Rare-earth (Group) Hi-tech Co., Ltd.: In July 2013, Phase-I 15,000 tons permanent magnet material project was completed and will be expanded to a capacity of 30,000 tons. The products are mainly used in VCM, hybrid and normal cars, wind generators and MRI imagers.
Taiyuan Twin-Tower Aluminum Oxide Co., Ltd.: In June 2013, Zhejiang Innuovo Magnetics Co., Ltd, the wholly-owned subsidiary of the company, invested RMB 92.4967 million to raise its stake in Ganzhou Tongcheng Rare Earth New Material Co., Ltd. (with rare earth NdFeB wastes processing as its primary business), and will hold 49.95% of Tongcheng Rare Earth once the capital increase is finished.
China Nonferrous Metal Industry's Foreign Engineering and Construction Co., Ltd.: In October 2013, its holding subsidiary NFC Southern Rare Earths (Xinfeng) Co., Ltd. signed a cooperation agreement on exploiting and operating rare earth resources in Xinfeng with People’s Government of Xinfeng County, Guangdong. As agreed upon, the two sides will jointly set up a rare earth mining company-- NFC Southern Rare Earths (Xinfeng) Mining Co., Ltd. that specializes in exploitation and operation of rare earth mines.
China Rare Earth Industry Report, 2013-2016 by ResearchInChina highlights the following:
Supply and consumption of and key companies in global rare earth industry;
Industrial environment, policy environment and regional development of China rare earth industry;
Supply and demand, export and market prices of China rare earth industry;
Application of rare earth metals in China by segment
Operation and development of 13 key Chinese rare earth producers;
Operation and development of 5 Chinese rare earth new material producers.
第一章 稀土行业概述
1.1 定义及分类
1.2 产业链
第二章 全球稀土行业发展现状
2.1 资源现状
2.1.1 储量及分布
2.1.2 海外稀土矿山开发情况
2.2 供需情况
2.2.1 供给
2.2.2 消费
2.3 重点企业
第三章 中国稀土行业发展环境
3.1 产业环境
3.2 政策环境
3.2.1 生产政策
3.2.2 外商投资政策
3.2.3 出口政策
3.2.4 产业整合政策
3.2.5 专用发票制度
3.3 政策走向
第四章 中国稀土行业发展现状
4.1 储量及分布
4.1.1 资源分布
4.1.2 离子型稀土矿
4.2 主要地区稀土行业发展状况
4.2.1 内蒙古
4.2.2 四川
4.2.3 山东
4.2.4 江西
4.2.5 广西
4.2.6 广东
4.2.7 湖南
4.2.8 福建
4.2.9 云南
第五章 中国稀土行业市场供需情况
5.1 供需情况
5.1.1 稀土矿生产情况
5.1.2 稀土产品生产情况
5.1.3 稀土消费情况
5.2 出口情况
5.2.1 出口配额
5.2.2 出口规模
5.2.3 出口价格
5.2.4出口结构
5.2.5 出口诉讼
5.3 市场价格
5.3.1 整体价格走势
5.3.2 主要中重稀土金属产品价格
5.3.3 主要轻稀土金属产品价格
第六章 中国稀土金属应用市场领域
6.1 应用结构
6.2 磁性材料
6.2.1 主要应用领域
6.2.2 消耗情况
6.2.3 主要企业及产能
6.3 储氢材料
6.3.1 消耗情况
6.3.2 主要企业及产能
6.4 抛光材料
6.4.1 消耗情况
6.4.2 主要企业及产能
6.5 发光材料
6.5.1 主要应用领域
6.5.2 生产情况
6.5.3 主要企业及产能
第七章 中国稀土行业主要企业
7.1 包钢稀土
7.1.1 公司简介
7.1.2 经营情况
7.1.3 收入结构
7.1.4 毛利率
7.1.5 发展动态
7.1.6 经营业绩预测
7.2 五矿稀土
7.2.1 公司简介
7.2.2 经营情况
7.2.3 收入结构
7.2.4 毛利率
7.2.5 发展动态
7.3 江钨集团
7.3.1 公司简介
7.3.2 经营情况
7.4 中色股份
7.4.1 公司简介
7.4.2 经营情况
7.4.3 稀土业务
7.4.4 发展动态
7.5 广晟有色
7.5.1 公司简介
7.5.2 经营情况
7.5.3 收入结构
7.5.4 毛利率
7.5.5 发展动态
7.6 厦门钨业
7.6.1 公司简介
7.6.2 经营情况
7.6.3 稀土业务
7.6.4 发展动态
7.6.5 经营业绩预测
7.7 湖南稀土院
7.7.1 企业简介
7.7.2 经营情况
7.7.3 发展动态
7.8 盛和稀土
7.8.1 公司简介
7.8.2 经营情况
7.8.3 发展动态
7.9 中国稀土
7.9.1 公司简介
7.9.2 经营情况
7.9.3 收入结构
7.9.4 稀土业务
7.9.5 发展动态
7.10 有研稀土
7.10.1 企业简介
7.10.2 经营情况
7.10.3 发展动态
7.11 江阴加华
7.11.1 公司简介
7.11.2 经营情况
7.12 淄博加华
7.12.1 公司简介
7.12.2 经营情况
7.13 赣州晨光
7.13.1 公司简介
7.13.2 经营情况
第八章 中国主要稀土新材料生产企业
8.1 中科三环
8.1.1 公司简介
8.1.2 公司产业链拓展情况
8.1.3 经营情况
8.1.4 收入结构
8.1.5 毛利率
8.1.6 发展动态
8.1.7 经营业绩预测
8.2 宁波韵升
8.2.1 公司简介
8.2.2 经营情况
8.2.3 收入结构
8.2.4 毛利率
8.2.5 发展动态
8.2.6 经营业绩预测
8.3 太原刚玉
8.3.1 公司简介
8.3.2 经营情况
8.3.3 收入结构
8.3.4 毛利率
8.3.5 发展动态
8.3.6 经营业绩预测
8.4 科恒股份
8.4.1 公司简介
8.4.2 经营情况
8.4.3 收入结构
8.4.4 毛利率
8.4.5 产销量
8.4.6 经营业绩预测
8.5 彩虹荧光
8.5.1 公司简介
8.5.2 经营情况
8.5.3 发展动态
第九章 总结
9.1 市场
9.2 企业
1. Overview of Rare Earth Industry
1.1 Definition & Classification
1.2 Industry Chain
2. Development of Global Rare Earth Industry
2.1 Resource Situation
2.1.1 Reserves and Distribution
2.1.2 Development of Rare Earth Mining Overseas
2.2 Supply & Demand
2.2.1 Supply
2.2.2 Demand
2.3 Key Enterprises
3. Environment for China’s Rare Earth Industry Development
3.1 Industry Environment
3.2 Policy Environment
3.2.1 Production Policy
3.2.2 Foreign Investment Policy
3.2.3 Export Policy
3.2.4 Industrial Integration Policy
3.2.5 Special Invoice System for Rare Earth
3.3 Policy Trend
4. Status Quo of China’s Rare Earth Industry Development
4.1 Reserves and Distribution
4.1.1 Resource Distribution
4.1.2 Ion-absorbing Type Rare Earth Ore
4.2 Development in Major Regions
4.2.1 Inner Mongolia
4.2.2 Sichuan
4.2.3 Shandong
4.2.4 Jiangxi
4.2.5 Guangxi
4.2.6 Guangdong
4.2.7 Hunan
4.2.8 Fujian
4.2.9 Yunnan
5. Supply and Demand in China’s Rare Earth Industry Market
5.1 Supply & Demand
5.1.1 Production of Rare Earth Ore
5.1.2 Production of Rare Earth Products
5.1.3 Consumption of Rare Earth
5.2 Export
5.2.1 Export Quota
5.2.2 Export Scale
5.2.3 Export Price
5.2.4 Export Structure
5.2.5 Export Litigation
5.3 Market Price
5.3.1 Overall Price
5.3.2 Prices of Major Middle & Heavy Rare Earth Metals
5.3.3 Prices of Major Light Rare Earth Metals
6. Application of Rare Earth Metals
6.1 Application Structure
6.2 Magnetic Materials
6.2.1 Major Application
6.2.2 Consumption
6.2.3 Major Enterprises and Capacity
6.3 Hydrogen Storage Material
6.3.1 Consumption
6.3.2 Major Enterprises and Capacity
6.4 Polishing Material
6.4.1 Consumption
6.4.2 Major Enterprises and Capacity
6.5 Luminescent Material
6.5.1 Major Application
6.5.2 Production
6.5.3 Major Enterprises and Capacity
7. Major Rare Earth Enterprises in China
7.1 Inner Mongolia Baotou Steel Rare-Earth (Group) Hi-Tech Co., Ltd
7.1.1 Profile
7.1.2 Operation
7.1.3 Revenue Structure
7.1.4 Gross Margin
7.1.5 Developments
7.1.6 Business Performance Prediction
7.2 China Minmetals Rare Earth Co., Ltd
7.2.1 Profile
7.2.2 Operation
7.2.3 Revenue Structure
7.2.4 Gross Margin
7.2.5 Developments
7.3 Jiangxi Tungsten Industry Group Co., Ltd
7.3.1 Profile
7.3.2 Operation
7.4 China Nonferrous Metal Industry's Foreign Engineering and Construction Co., Ltd.
7.4.1 Profile
7.4.2 Operation
7.4.3 Rare Earth Business
7.4.4 Developments
7.5 Rising Nonferrous Metals Group Co., Ltd.
7.5.1 Profile
7.5.2 Operation
7.5.3 Revenue Structure
7.5.4 Gross Margin
7.5.5 Developments
7.6 Xiamen Tungsten Co., Ltd
7.6.1 Profile
7.6.2 Operation
7.6.3 Rare Earth Business
7.6.4 Developments
7.6.5 Business Performance Prediction
7.7 Hunan Rare-Earth Research Institute
7.7.1 Profile
7.7.2 Operation
7.7.3 Developments
7.8 Leshan Shenghe Rare Earth Technology Co., Ltd.
7.8.1 Profile
7.8.2 Operation
7.8.3 Developments
7.9 China Rare Earth Holdings Ltd.
7.9.1 Profile
7.9.2 Operation
7.9.3 Revenue Structure
7.9.4 Rare Earth Business
7.9.5 Developments
7.10 Grirem Advanced Materials Co., Ltd.
7.10.1 Profile
7.10.2 Operation
7.10.3 Developments
7.11 Jiangyin Jiahua Advanced Material Resources Co., Ltd
7.11.1 Profile
7.11.2 Operation
7.12 Zibo Jiahua Advanced Material Resource Co., Ltd
7.12.1 Profile
7.12.2 Operation
7.13 Gan Zhou Chen Guang Rare Earths New Material Shares Co., Ltd.
7.13.1 Profile
7.13.2 Operation
8. Major Rare Earth New Material Enterprises in China
8.1 Beijing Zhong Ke San Huan High-Tech Co., Ltd.
8.1.1 Profile
8.1.2 Expansion of Industry Chain
8.1.3 Operation
8.1.4 Revenue Structure
8.1.5 Gross Margin
8.1.6 Developments
8.1.7 Business Performance Prediction
8.2 Ningbo Yunsheng Co., Ltd.
8.2.1 Profile
8.2.2 Operation
8.2.3 Revenue Structure
8.2.4 Gross Margin
8.2.5 Developments
8.2.6 Business Performance Prediction
8.3 Taiyuan Twin Tower Alomllum Oxide Co., Ltd.
8.3.1 Profile
8.3.2 Operation
8.3.3 Revenue Structure
8.3.4 Gross Margin
8.3.5 Developments
8.3.6 Business Performance Prediction
8.4 Jiangmen Kanhoo Industry Co., Ltd.
8.4.1 Profile
8.4.2 Operation
8.4.3 Revenue Structure
8.4.4 Gross Margin
8.4.5 Output and Sales Volume
8.4.6 Business Performance Prediction
8.5 Shannxi IRICO Fluorescent Materials Co., Ltd.
8.5.1 Profile
8.5.2 Operation
8.5.3 Developments
9. Summary
9.1 Market
9.2 Enterprises
表:稀土分类
图:稀土行业产业链
表:稀土矿类型
表:2013年全球稀土资源储量分布
表:2013年国外稀土矿山开发项目
表:海外主要稀土矿山开发项目概况
表:2009-2013年全球主要国家稀土产量
图:2015年全球稀土供应格局
表:2015年全球稀土供给预测
图:2006-2016年全球稀土消费量
图:2013年全球稀土(分国家)消费量
图:美国稀土(分产品)消费结构
图:日本稀土(分产品)消费结构
表:2015年全球稀土消费结构预测
表:2015年全球下游行业稀土各元素的消费量预测
表:2002-2013年中国公布的主要稀土产业政策
表:2013年中国符合稀土行业准入条件企业名单
表:2013年中国各地区稀土采矿证数量
表:2013年中国稀土产品出口关税税率
表:2011-2013年中国稀土产业整合政策
图:中国稀土资源分布
表:中国主要矿区稀土矿床利用对比情况
图:中国离子型稀土矿分布
表:中国离子型稀土矿配份
表:全球主要资源静态储采比
表:2013年稀土开采总量控制指标
表:2014年包头市稀土出口企业配额
表:四川省主要稀土运用企业
图:2008-2013年中国稀土矿产量
表:2008-2013年中国稀土矿生产结构
图:2008-2013年中国稀土产品产量
表:2008-2013年中国稀土产品生产结构
表:通过环保审查的稀土企业名单
图:2006-2013年中国稀土消费量
图:2006-2016年中国新材料领域占稀土消费的比重
图:2013年中国稀土消费结构
表:2008-2014年中国稀土出口配额
表:2012-2013年中国稀土出口配额分配
表:2014年中国稀土出口企业名单及第一批配额
图:2006-2013年中国稀土产品出口量
图:2013年中国稀土商品(分月度)出口量
图:2006-2013年中国稀土产品出口额
图:2013年中国稀土商品(分月度)出口价格
图:2013年中国稀土分离冶炼产品出口量
图:2013年中国稀土分离冶炼产品(分国家/地区)出口量
图:2001-2013年中国稀土永磁体出口量
图:2013年中国稀土永磁体(分国家/地区)出口量
表:稀土WTO争端解决基本流程
表:2013年中国主要稀土氧化物均价
图:2013-2014年中国氧化镝价格
图:2013-2014年中国金属镝价格
图:2013-2014年中国氧化铒价格
图:2013-2014年中国氧化铕价格
图:2013-2014年中国氧化钆价格
图:2013-2014年中国氧化钐价格
图:2013-2014年中国金属铽价格
图:2013-2014年中国氧化铽价格
图:2013-2014年中国金属钇价格
图:2013-2014年中国氧化钇价格
图:2013-2014年中国氧化铈价格
图:2013-2014年中国氧化钕价格
图:2013-2014年中国氧化镧价格
图:2013-2014年中国氧化镨价格
图:2013-2014年中国金属钕价格
图:2013-2014年中国金属镧价格
图:2013-2014年中国金属镨价格
图:2013-2014年中国金属铈价格
图:2013年中国稀土在传统消费领域中的应用结构
图:2013年中国稀土在新材料领域的应用结构
图:稀土永磁材料中稀土元素应用比重
表:钕铁硼永磁材料与其他永磁材料磁性能对比
表:中国钕铁硼应用领域
图:2013年中国稀土永磁消费结构
图:2006-2016年中国永磁材料对稀土消耗量
图:2013年中国钕铁硼产能格局
表:2013年中国钕铁硼主要企业产能
图:稀土储氢材料中稀土元素应用比重
图:2013年中国镍氢电池消费结构
图:2006-2016年中国储氢材料对稀土的消耗量
表:2013年中国稀土储氢材料主要企业产能
图:稀土抛光材料中稀土元素应用比重
图:2006-2013年全球稀土抛光粉消费量
表:中国稀土抛光粉的主要应用领域
图:2006-2016年中国抛光材料对稀土的消耗量
表:2013年中国主要抛光材料企业产能
图:稀土发光材料中稀土元素应用比重
表:稀土发光材料应用领域
图:2013年全球稀土发光材料消费结构
图:2013年全球稀土发光材料产量分布
图:2013年中国稀土发光材料产量分布
图:2008-2016年中国稀土发光材料产量
表:2013年中国主要稀土发光材料企业产能
表:包钢稀土主营产品
表:2013年包钢稀土主要产品产能
图:2008-2013年包钢稀土营业收入及净利润
表:2011-2013年包钢稀土(分产品)主营业务收入
表:2010-2013年包钢稀土(分地区)主营业务收入
表:2011-2013年包钢稀土(分产品)毛利率
表:2014-2016年包钢稀土营业收入及净利润
表:五矿稀土主要下属企业主导稀土产品及产能
图:2011-2013年五矿稀土主营业务收入及净利润
图:2012-2013年五矿稀土(分产品)主营业务收入
表:2012-2013年五矿稀土(分产品)毛利率
表:江西钨业主要下属稀土企业
图:2009-2016年江钨集团营业收入
图:2008-2013年中色股份营业收入及净利润
图:2011-2013年中色股份稀土氧化物产销量
图:2018-2013年中色股份稀土业务营业收入
表:广晟有色主要稀土子公司生产规模
图:2008-2013年广晟有色营业收入及净利润
表:2010-2013年广晟有色(分产品)主营业务收入
表:2010-2013年广晟有色(分地区)主营业务收入
表:2010-2013年广晟有色(分产品)毛利率
图:2008-2013年厦门钨业营业收入及净利润
表:2013年厦门钨业主要稀土产品产能
表:2011-2013年厦门钨业稀土开采总量控制指标
表:2014-2016年厦门钨业营业收入及净利润
表:湖南稀土院有限责任公司主要运作稀土项目
图:2010-2015年湖南稀土新能源材料研究院营业收入规划
表:2009-2013年盛和稀土主要财务指标
表:2012-2013年盛和稀土(分产品)产销量
图:2008-2013年中国稀土营业收入及净利润
图:2008-2013年中国稀土(分业务)主营业务收入
表:2010-2013年中国稀土(分地区)收入占比
表:有研稀土主营产品
图:2009-2013年乐山有研稀土新材料有限公司主营业务收入
图:2009-2013年廊坊关西磁性材料有限公司主营业务收入
表:2011-2014年有研稀土稀土出口配额
表:2011-2014年江阴加华稀土出口配额
表:2011-2013年淄博加华营业收入及利润总额
表:2011-2014年淄博加华稀土出口配额
表:2010-2014年赣州晨光营业收入及净利润
表:2011-2014年赣州晨光稀土产品出口配额
表:中科三环旗下主要钕铁硼生产企业
表:中科三环旗下主要稀土原料生产企业
图:2008-2013年中科三环营业收入及净利润
表:2010-2013年中科三环(分产品)主营业务收入
表:2010-2013年中科三环(分地区)主营业务收入
表:2010-2013年中科三环(分产品)毛利率
表:2013年中科三环主要稀土永磁材料技术改造项目
表:2014-2016年中科三环营业收入及净利润
图:2008-2013年宁波韵升营业收入及净利润
表:2010-2013年宁波韵升(分产品)主营业务收入
表:2010-2013年宁波韵升(分地区)主营业务收入
表:2010-2013年宁波韵升(分产品)毛利率
图:2013年宁波韵升稀土永磁材料下游应用领域
表:2014-2016年宁波韵升营业收入及净利润
图:2008-2013年太原刚玉营业收入及净利润
表:2010-2013年太原刚玉(分产品)主营业务收入
图:2008-2013年太原刚玉毛利率
表:2010-2013年太原刚玉(分产品)毛利率
表:2014-2016年太原刚玉营业收入及净利润
图:2008-2013年科恒股份营业收入及净利润
表:2009-2013年科恒股份(分产品)主营业务收入
表:2013年科恒股份(分地区)主营业务收入
图:2009-2013年科恒股份毛利率
表:2009-2013年科恒股份(分产品)毛利率
表:2009-2013年科恒股份稀土发光材料产销量
表:2014-2016年科恒股份营业收入、净利润及毛利率
表:2010-2013年彩虹荧光营业收入及利润总额
表:2010-2012年彩虹荧光主要产品销量
图:2009-2013年中国稀土及其产品销量增长率
图:2007-2013年中国稀土产品出口量及出口额增长率
图:2009-2013年中国稀土行业主要企业营业收入增长率
图:2010-2013年中国稀土行业主要企业毛利率
Rare Earth Classification
Rare Earth Industry Chain
Rare Earth Ore Classification
Global Distribution of Rare Earth Reserves, 2013
Development Projects of Rare Earth Mines Overseas, 2013
Overview of Major Overseas Rare Earth Mine Development Projects
Global Rare Earth Output by Country, 2009-2013
Global Rare Earth Supply Pattern, 2015
Global Rare Earth Supply Prediction, 2015
Global Rare Earth Consumption, 2006-2016
Global Rare Earth (by Country) Consumption, 2013
Consumption Structure of Rare Earths in the US
Consumption Structure of Rare Earths in Japan
Consumption Structure of Rare Earths Worldwide, 2015
Global Consumption of Rare Earth Elements in Downstream Sectors, 2015
Major Rare Earth Industrial Policies Released by China, 2002-2013
List of Enterprises Qualified for Rare Earth Industry Access Conditions in China, 2013
Quantity of Rare Earth Mining Licences by Region in China, 2013
China’s Export Duties on Rare Earth Products, 2013
Chinese Policies on Rare Earth Industry Integration, 2011-2013
Distribution of Rare Earth Resources in China
Ore Bed Utilization of Leading Rare Earth Mines in China
Distribution of Ion Absorption Type Rare Earth Ore in China
Share of Ion Absorption Type Rare Earth Ore in China
Static Reserves-to-Output Ratio of Major Resources Worldwide
Rare Earth Exploitation Control Indices, 2013
Quota of Baotou City-based Rare Earth Export Enterprises,2014
Main Rare Earth Application Enterprises in Sichuan
China’s Output of Rare Earth Ore, 2008-2013
China’s Production Structure of Rare Earth Ore, 2008-2013
China’s Output of Rare Earth Products, 2008-2013
China’s Production Structure of Rare Earth Products, 2008-2013
Name List of Rare Earth Companies Having Passed Environmental Protection Examination
Rare Earth Consumption in China, 2006-2013
Proportion of New Material Field in Rare Earth Consumption in China, 2006-2016E
China’s Rare Earth Consumption Structure, 2013
Rare Earth Export Quota of China, 2008-2014
Distribution of China’s Rare Earth Export Quotas, 2012-2013
Name List of Chinese Rare Earth Exporting Companies and the First Batch of Quotas, 2014
China’s Export Volume of Rare Earths, 2006-2013
China’s Export Volume of Rare Earths Product(by Months), 2013
China’s Rare Earth Products Export Value, 2006-2013
China’s Rare Earth Products Export Price (by Months), 2013
China’s Rare Earth Smelting Separation Products Export Volume, 2013
China’s Rare Earth Smelting Separation Products Export Volume (by Country/Region), 2013
China's Rare Earth Permanent Magnet Export Volume,2001-2013
China's Rare Earth Permanent Magnet (by Country/Region) Export Volume,2013
Basic Flows to Address WTO Disputes about Rare Earths
Average Price of Key Rare Earth Oxides in China, 2013
Price of Dy Oxide of China, 2013-2014
Price of Dy Metal of China, 2013-2014
Price of Er Oxide of China, 2013-2014
Price of Eu Oxide of China, 2013-2014
Price of Gd Oxide of China, 2013-2014
Price of Sm Oxide of China, 2013-2014
Price of Tb Metal of China, 2013-2014
Price of Tb Oxide of China, 2013-2014
Price of Yt Metal of China, 2013-2014
Price of Yt Oxide of China, 2013-2014
Price of Ce Oxide of China, 2013-2014
Price of Nd Oxide of China, 2013-2014
Price of La Oxide of China, 2013-2014
Price of Pr Oxide of China, 2013-2014
Price of Nd Metal of China, 2013-2014
Price of La Metal of China, 2013-2014
Price of Pr Metal of China, 2013-2014
Price of Ce Metal of China, 2013-2014
Structure of Rare Earth Application in Traditional Consumption Fields in China, 2013
Structure of Rare Earth Application in the Field of New Materials in China, 2013
Application of Rare Earth Elements in Rare-earth Permanent Magnet Material
Performance Comparison between NdFeB Permanent Magnetic Material and Other Permanent Magnetic Materials
Applications of NdFeB in China
Consumption Structure of Rare Earth Permanent Magnets in China, 2013
Demand of Permanent Magnetic Materials for Rare Earth in China, 2006-2016E
Production Patterm of NdFeB Companies in China, 2013
Production Capacity of Leading NdFeB Companies in China, 2013
Application of Rare Earth Elements in Rare-earth Hydrogen Storage Material
China's NI-MH Battery Consumption Structure,2013
Demand of Hydrogen Storage Materials for Rare Earth in China, 2006-2016E
Production Capacities of Key Rare Earth Hydrogen Storage Material Companies in China, 2013
Application of Rare Earth Elements in Rare-earth polishing material
Global Consumption of Rare Earth Polishing Powder, 2006-2013
Major Applications of Rare Earth Polishing Powder in China
Demand of Polishing Materials for Rare Earth in China, 2006-2016E
Production Capacities of Leading Polishing Material Companies in China, 2013
Application of Rare Earth Elements in Rare-earth Luminescent Material
Application of Rare-Earth luminescent Material
Global Consumption Structure of Rare Earth Fluorescent Materials, 2013
Global Distribution of Rare Earth Fluorescent Material Output, 2012
China’s Distribution of Rare Earth Fluorescent Material Output, 2012
China’s Output of Rare Earth Fluorescent Materials, 2008-2016E
Production Capacities of Key Rare Earth Fluorescent Material Companies in China, 2013
Key Products of Inner Mongolia Baotou Steel Rare-earth (Group)
Capacity of Major Products of Inner Mongolia Baotou Steel Rare-Earth (Group), 2013
Revenue and Net Income of Inner Mongolia Baotou Steel Rare-Earth (Group), 2008-2013
Operating Revenue of Inner Mongolia Baotou Steel Rare-Earth (Group) (by Product), 2011-2013
Operating Revenue of Inner Mongolia Baotou Steel Rare-Earth (Group) (by Region), 2010-2013
Gross Margin of Inner Mongolia Baotou Steel Rare-Earth (Group) (by Product), 2011-2013
Revenue and Net Income of Inner Mongolia Baotou Steel Rare-Earth (Group), 2014-2016E
Leading Rare Earth Products and Production Capacities of Key Subsidiaries under China Minmetals Rare Earth Co., Ltd
Revenue and Net Income of China Minmetals Rare Earth Co.,Ltd., 2011-2013
Operating Revenue of China Minmetals Rare Earth Co., Ltd.(by Product), 2012-2013
Gross Margin of China Minmetals Rare Earth Co., Ltd.(by Product), 2012-2013
Major Rare Earth Companies under Jiangxi Tungsten Industry Group Co., Ltd
Revenue of Jiangxi Tungsten Industry Group Co., Ltd, 2009-2016E
Revenue and Net Income of China Nonferrous Metal Industry's Foreign Engineering and Construction Co., Ltd., 2008-2013
Rare Earth Oxide Output of China Nonferrous Metal Industry's Foreign Engineering and Construction Co., Ltd., 2011-2013
Rare Earth Business Revenue of China Nonferrous Metal Industry's Foreign Engineering and Construction Co., Ltd., 2008-2013
Production Scale of Major Rare Earth Subsidiaries of Guangdong Rising Nonferrous Metals Group
Revenue and Net Income of Rising Nonferrous Metals Share Co., Ltd., 2008-2013
Operating Revenue of Rising Nonferrous Metals Share Co., Ltd.(by Product), 2010-2013
Operating Revenue of Rising Nonferrous Metals Share Co., Ltd.(by Region), 2010-2013
Gross Margin of Rising Nonferrous Metals Share Co., Ltd.(by Product), 2010-2013
Revenue and Net Income of Xiamen Tungsten Co., Ltd, 2008-2013
Capacity of Major Rare Earth Products of Xiamen Tungsten Co., Ltd, 2013
Rare Earth Exploitation Control Indices of Xiamen Tungsten Co., Ltd., 2011-2013
Revenue and Net Income of Xiamen Tungsten Co., Ltd, 2014-2016E
Major Rare Earth Projects of Hunan Rare-Earth Research Institute
Revenue Planning of Hunan Rare-Earth Research Institute, 2010-2015E
Key Financial Indices of Leshan Shenghe Rare Earth Technology Co., Ltd., 2009-2013
Production and Sales of Leshan Shenghe Rare Earth Technology Co., Ltd.(by Product), 2012-2013
Revenue and Net Income of China Rare Earth Holdings Ltd., 2008-2013
Operating Revenue of China Rare Earth Holdings (by Business), 2008-2013
Operating Revenue of China Rare Earth Holdings (by Region), 2008-2013
Main Products of Grirem Advanced Materials
Operating Revenue of Leshan Grirem Advanced Materials Ltd., 2009-2013
Operating Revenue of Langfang Kansai Magnetic Materials Co.,Ltd., 2009-2013
Rare Earth Export Quotas of Grirem Advanced Materials Co., Ltd., 2011-2014
Rare Earth Export Quotas of Jiangyin Jiahua Advanced Material Co., Ltd., 2011-2014
Revenue and Net Income of Zibo Jiahua Advanced Material Resource Co., Ltd, 2011-2013
Rare Earth Export Quotas of Zibo Jiahua Advanced Material Resource Co., Ltd, 2011-2014
Revenue and Net Income of Gan Zhou Chen Guang Rare Earths New Material Shares Co., Ltd., 2010-2014
Export Quotas of Rare Earth Products of Gan Zhou Chen Guang Rare Earths New Material Shares Co., Ltd., 2011-2014
Key NdFeB Manufacturers Affiliated to Zhong Ke San Huan
Key Rare Earth Raw Materials Manufacturers Affiliated to Zhong Ke San Huan
Revenue and Net Income of Beijing Zhong Ke San Huan High-Tech, 2008-2013
Operating Revenue of Beijing Zhong Ke San Huan High-Tech (by Product), 2010-2013
Operating Revenue of Beijing Zhong Ke San Huan High-Tech (by Region), 2010-2013入
Gross Margin of Beijing Zhong Ke San Huan High-Tech (by Product), 2010-2013
Key Rare Earth Permanent Magnetic Material Technology Transformation Projects of Beijing Zhong Ke San Huan High-Tech, 2013
Revenue and Net Income of Beijing Zhong Ke San Huan High-Tech, 2014-2016E
Revenue and Net Income of Ningbo Yunsheng Co.,Ltd., 2008-2013
Operating Revenue of Ningbo Yunsheng Co.,Ltd (by Product), 2010-2013
Operating Revenue of Ningbo Yunsheng Co.,Ltd (by Region), 2010-2013
Gross Margin of Ningbo Yunsheng Co.,Ltd (by Product), 2010-2013
Rare Earth Permanent Magnet's Application of Ningbo Yunsheng Co., Ltd.
Revenue and Net Income of Ningbo Yunsheng Co., Ltd., 2014-2016E
Revenue and Net Income of Taiyuan Twin Tower Alomllum Oxide Co., Ltd., 2008-2013
Operating Revenue of Taiyuan Twin Tower Alomllum Oxide Co., Ltd. (by Product), 2010-2013
Gross Margin of Taiyuan Twin Tower Alomllum Oxide Co., Ltd, 2008-2013
Gross Margin of Taiyuan Twin Tower Alomllum Oxide Co., Ltd (by Product), 2010-2013
Revenue and Net Income of Taiyuan Twin Tower Alomllum Oxide Co., Ltd., 2014-2016E
Revenue and Net Income of Jiangmen Kanhoo Industry Co., Ltd., 2008-2013
Operating Revenue of Jiangmen Kanhoo Industry Co., Ltd (by Product), 2009-2013
Operating Revenue of Jiangmen Kanhoo Industry Co., Ltd (by Region), 2009-2013
Gross Margin of Jiangmen Kanhoo Industry Co., Ltd, 2009-2013
Gross Margin of Jiangmen Kanhoo Industry Co., Ltd (by Product), 2009-2013
Output and Sales Volume of Various Products of Jiangmen Kanhoo Industry Co., Ltd, 2009-20113
Revenue, Net Income and Gross Margin of Jiangmen Kanhoo Industry Co., Ltd, 2014-2016E
Revenue and Total Profit of Shannxi IRICO Fluorescent Materials Co., Ltd., 2010-2013
Sales Volume of Major Products of Shannxi IRICO Fluorescent Materials Co., Ltd., 2010-2012
Sales Growth of Rare Earth in China, 2009-2013
Export Growth of Rare Earth in China, 2007-2013
Main Enterprises' Revenue Growth in China, 2009-2013
Main Enterprises' Gross Margin in China, 2010-2013
如果这份报告不能满足您的要求,我们还可以为您定制报告,请 留言说明您的详细需求。
|