|
|
|
报告导航:研究报告—
生命科学—制药医疗
|
|
2013-2016年全球及中国血液透析行业研究报告 |
 |
字数:3.9万 |
页数:108 |
图表数:121 |
|
中文电子版:8500元 |
中文纸版:4250元 |
中文(电子+纸)版:9000元 |
|
英文电子版:2400美元 |
英文纸版:2550美元 |
英文(电子+纸)版:2700美元 |
|
编号:HK043
|
发布日期:2014-05 |
附件:下载 |
 |
|
|
血液透析也称人工肾,是血液净化技术的一种,主要适用于肾衰竭患者的治疗。
2013年,全球透析人数继续增长至251.9万人,新增透析病人主要来源于亚太地区(除日本),欧美日等成熟市场由于其晚期肾衰患者接受治疗比例较高,透析人数增长缓慢。如2013年亚太地区透析人数同比增长17.0%;而日本、欧盟和美国透析人数同比增长率则仅为2%-4%。
全球血液透析市场可分为血液透析服务和血液透析设备两部分,其中血液透析服务市场规模较大,约占85%左右。
1、 透析服务市场
全球血液透析服务市场地区差异较大,欧洲和亚太地区以公立机构为主,北美以私人公司运营机构为主,拉丁美洲则以私人诊所为主。目前全球提供血液透析服务的企业主要有费森尤斯医疗、DaVita等,2013年二者服务的透析人数之和接近34万人。
中国透析服务市场以各级医院为主,由于目前国家医保报销比例相对较低,且患者经济承受能力不高,导致中国晚期肾病患者接受透析治疗的比例偏低,2013年仅为12%左右。2013年中国肾衰患者接受透析治疗的人数约为25万人,治疗方式以血液透析为主,腹膜透析的患者不足3万人。未来随着中国各级医保覆盖面的逐步扩大,晚期肾病患者接受治疗的比例将大幅上升,市场前景非常可观。
2、 透析设备市场
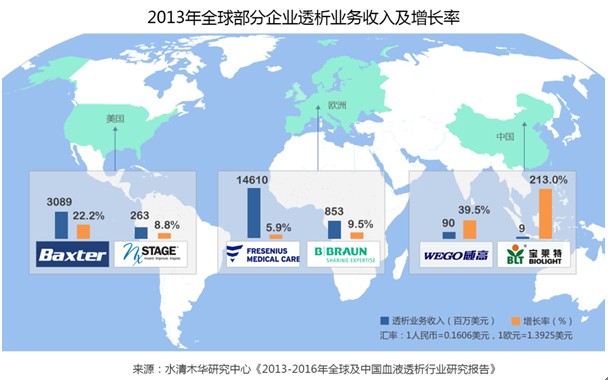
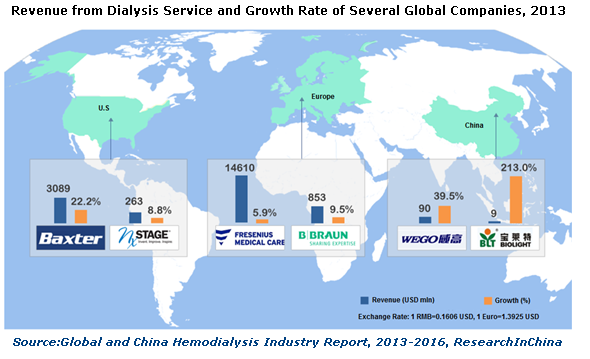
全球血液透析设备市场集中度较高,主要由欧美和日本企业占据。一线品牌主要是欧美品牌,包括德国费森尤斯、美国百特、德国贝朗等;二线品牌主要是日系品牌,包括日机装、日本尼普洛、日本东丽等。2013年,费森尤斯和百特在全球透析设备市场的占有率分别达到34%和30%。
中国本土血液透析设备竞争力差,市场占有率较低,2013年中国血液透析设备进口依赖率达70%左右。中国透析领域生产企业包括:血液透析机生产企业广州暨华、宝莱特、重庆山外山等;透析器生产企业威高股份、江苏朗生等,腹膜透析液生产企业华仁药业、科伦药业等。
水清木华研究中心《2013-2016年全球及中国血液透析行业研究报告》主要包括以下几个内容:
 全球血液透析人群数量及分布情况等; 全球血液透析人群数量及分布情况等;
全球血液透析设备及服务市场发展现状、竞争格局及发展趋势等;
中国血液透析行业市场规模、竞争格局、进出口及发展预测等;
全球及中国血液透析设备细分市场现状及竞争格局等;
全球及中国16家血液透析行业生产企业的经营分析、血液透析业务分析及发展预测等。
Hemodialysis, also known as artificial kidney, is a type of blood purification technology, primarily applicable to the treatment of patients with rental failure.
In 2013, the global number of patients receiving dialysis continued to grow to 2.519 million. The new patients mainly come from Asia Pacific region (excluding Japan), whereas for Europe, America, Japan and other mature markets, since these countries have a higher proportion of patients with advanced renal failure receiving treatment, so they have a slower growth in the number of patients receiving dialysis. For example, in 2013, the number of patients receiving dialysis in Asia-Pacific region grew by 17.0% YoY; while in Japan, EU and US, the number of patients receiving dialysis grew by only 2%-4% YoY.
The global hemodialysis market can be divided into two parts: hemodialysis service and hemodialysis equipment, of which the scale of hemodialysis service market is larger, accounting for about 85% of the overall market.
1 Hemodialysis Service Market
Global hemodialysis service market has great regional differences: in Europe and Asia Pacific, public institutions dominate, however, in North America, private-company-operated institutions and in Latin America, private clinics are the main forms. Currently, global companies providing hemodialysis service mainly include Fresenius Medical Care, DaVita, etc. The number of patients receiving hemodialysis in these two companies in 2013 came to nearly 340,000.
Dialysis services in China are mainly provided by all levels of hospitals, mainly due to that currently the national health insurance reimbursement ratio is relatively low and the affordability of patients is not high, resulting in lower proportion of patients with end-stage renal disease undergoing dialysis treatment, which was only about 12% in 2013. In 2013 the number of Chinese patients with renal failure undergoing dialysis treatment (mainly hemodialysis treatment) was approximately 250,000, and number of patients undergoing peritoneal dialysis was less than 30,000. But with the gradual expansion of China's health insurance coverage at all levels, the proportion of patients with end stage renal disease undergoing treatment will rise sharply and the market prospects will be very promising.
2 Dialysis Equipment Market
The global hemodialysis equipment market is relatively concentrated, mainly dominated by European, American and Japanese companies. The first-tier brands are American and European brands, including Germany-based Fresenius and Braun, U.S.-based Baxter and so on; the second-tier brands mainly are Japanese brands, including NIKKISO, Nipro, Toray and so on. In 2013, market share of Fresenius and Baxter in the global dialysis equipment market reached 34% and 30% respectively.
Local Chinese hemodialysis equipment has poor competitiveness and low market share. In 2013, China's hemodialysis equipment import dependency rate was about 70%. Chinese manufacturers in the field of dialysis include: hemodialysis machine manufacturers like Jihua Medical Apparatus and Instruments Co., Ltd, Guangdong Biolight Meditech Co., Ltd and Chongqing Shanwaishan Science & Technology Co., Ltd; dialyzer manufacturers include Shandong Weigao Group and Jiangsu Lengthen Life Science and Technology Co., Ltd; peritoneal dialysis solution manufacturers include Huaren Pharmaceutical Co., Ltd and Sichuan Kelun Pharmaceutical Co., Ltd.
The "Global and China Hemodialysis Industry Report, 2013-2016" published by ResearchInChina includes the following main contents:
Global hemodialysis population and distribution, etc.;
Status quo, competition pattern and development trend of the global hemodialysis equipment and service markets;
Market scale, competition pattern, import & export and development forecasting, etc of China hemodialysis industry;
Status quo and competition pattern of global and China hemodialysis equipment market segments;
Operational analysis, hemodialysis business analysis and development forecasting of 16 global and Chinese enterprises in the hemodialysis industry.
第一章血液透析行业概述
1.1 定义
1.2 血液透析设备
1.3 血液透析服务
1.3.1 透析中心血透
1.3.2 家庭血液透析
1.4 产业链
第二章全球血液透析市场分析
2.1 透析人群
2.2 市场总体情况
2.3 血液透析设备市场
2.4 血液透析服务市场
第三章中国血液透析市场分析
3.1 发展现状
3.2 政策环境
3.3 竞争格局
3.4 市场规模
第四章中国血液透析设备进出口分析
4.1进口分析
4.2 出口分析
第五章血液透析细分市场分析
5.1 血液透析机
5.2 腹膜透析
5.3 透析器
5.4 透析回路管
5.5 透析浓缩液
5.6 家庭用血液透析机
5.7 血液透析膜
第六章国外主要生产企业
6.1 德国费森尤斯医疗
6.1.1 公司简介
6.1.2 经营情况
6.1.3 透析产品业务
6.1.4 透析服务业务
6.1.5 透析人数
6.1.6 发展情况
6.1.7 在华业务
6.2 日本日机装
6.2.1 公司简介
6.2.2 经营情况
6.2.3 血液透析业务
6.2.4 在华业务
6.3 美国百特
6.3.1 公司简介
6.3.2 经营情况
6.3.3 血液透析业务
6.3.4 收购瑞典金宝
6.3.5 在华经营状况
6.4 日本旭化成
6.4.1 公司简介
6.4.2 经营情况
6.4.3 健康医疗部门经营状况
6.4.4 在华业务
6.5 日本尼普洛
6.5.1 公司简介
6.5.2 经营情况
6.5.3 血液透析业务
6.5.4 在华业务
6.6 德国贝朗
6.6.1 公司简介
6.6.2 经营情况
6.6.3 血液透析业务
6.6.4 在华业务
6.7 美国Nxstage
6.7.1 公司简介
6.7.2 经营情况
6.7.3 便携式血液透析机业务
6.7.4 血液透析耗材业务
第七章中国主要生产企业
7.1 威高股份
7.1.1 公司简介
7.1.2 经营状况
7.1.3 营收构成
7.1.4 研发
7.1.5 血液透析业务
7.1.6 发展前景及预测
7.2 华仁药业
7.2.1 公司简介
7.2.2 经营情况
7.2.3 血液透析业务
7.3 宝莱特
7.3.1 公司简介
7.3.2 经营情况
7.3.3 营收构成
7.3.4 毛利率
7.3.5 研发
7.3.6 客户
7.3.7 血液透析业务
7.3.8 预测与展望
7.4 科伦药业
7.4.1 公司简介
7.4.2 经营情况
7.4.3 血液透析业务
7.5 广州暨华
7.5.1 公司简介
7.5.2 血液透析业务
7.6 贝恩医疗
7.6.1 公司简介
7.6.2 经营状况
7.6.3 血液透析业务
7.7 联合捷然
7.7.1 公司简介
7.7.2 经营状况
7.8 江苏朗生
7.8.1 公司简介
7.8.2 经营状况
7.8.3 血液透析业务
7.9 广州康盛
7.9.1 公司简介
7.9.2 经营情况
第八章总结与预测
8.1 总结
8.2 发展预测
8.2.1 血液透析人群增大
8.2.2 透析治疗比例稳步提高
8.2.3 市场规模预测
1 Hemodialysis Industry Overview
1.1 Definition
1.2 Hemodialysis Equipment
1.3 Hemodialysis Service
1.3.1 In-Center Hemodialysis
1.3.2 Home Hemodialysis
1.4 Industry Chain
2 Global Hemodialysis Market
2.1 Dialysis Population
2.2 Overall Market Situation
2.3 Hemodialysis Equipment Market
2.4 Hemodialysis Service Market
3 China Hemodialysis Market
3.1 Status Quo
3.2 Policy Environment
3.3 Competition Pattern
3.4 Market Scale
4 China Hemodialysis Equipment Import and Export
4.1 Import
4.2 Export
5 Hemodialysis Market Segments
5.1 Hemodialysis Machine
5.2 Peritoneal Dialysis
5.3 Dialyzer
5.4 Dialysis Loop Tube
5.5 Dialysis Concentrate
5.6 Hemodialysis Machine for Home Use
5.7 Hemodialysis Membrane
6 Major Foreign Manufacturers
6.1 Fresenius Medical Care
6.1.1 Profile
6.1.2 Operation
6.1.3 Dialysis Product Business
6.1.4 Dialysis Service Business
6.1.5 Number of Patients Receiving Dialysis
6.1.6 Development Situation
6.1.7 Business in China
6.2 NIKKISO
6.2.1 Profile
6.2.2 Operation
6.2.3 Hemodialysis Business
6.2.4 Business in China
6.3 Baxter
6.3.1 Profile
6.3.2 Operation
6.3.3 Hemodialysis Business
6.3.4 Acquisition of Gambro AB
6.3.5 Operating Conditions in China
6.4 Asahi Kasei
6.4.1 Profile
6.4.2 Operation
6.4.3 Operating Conditions of the Health Care Division
6.4.4 Business in China
6.5 Nipro
6.5.1 Profile
6.5.2 Operation
6.5.3 Hemodialysis Business
6.5.4 Business in China
6.6 B. Braun Melsungen AG
6.6.1 Profile
6.6.2 Operation
6.6.3 Hemodialysis Business
6.6.4 Business in China
6.7 Nxstage
6.7.1 Profile
6.7.2 Operation
6.7.3 Portable Hemodialysis Machine Business
6.7.4 Hemodialysis Consumables Business
7 Major Manufacturers in China
7.1 Weigao Group
7.1.1 Profile
7.1.2 Operation
7.1.3 Revenue Structure
7.1.4 R & D
7.1.5 Hemodialysis Business
7.1.6 Development Prospects and Forecasting
7.2 Huaren Pharmaceutical
7.2.1 Profile
7.2.2 Operation
7.2.3 Hemodialysis Business
7.3 Guangdong Biolight Meditech
7.3.1 Profile
7.3.2 Operation
7.3.3 Revenue Structure
7.3.4 Gross Margin
7.3.5 R & D
7.3.6 Clients
7.3.7 Hemodialysis Business
7.3.8 Forecasting and Outlook
7.4 Kelun Pharmaceutical
7.4.1 Profile
7.4.2 Operation
7.4.3 Hemodialysis business
7.5 Jihua Medical Apparatus and Instruments
7.5.1 Profile
7.5.2 Hemodialysis Business
7.6 Bain Medical Equipment
7.6.1 Profile
7.6.2 Operation
7.6.3 Hemodialysis Business
7.7 Beijing United Bio-Tech
7.7.1 Profile
7.7.2 Operation
7.8 Jiangsu Lengthen Life Science and Technology
7.8.1 Profile
7.8.2 Operation
7.8.3 Hemodialysis Business
7.9 Guangzhou Koncen BioScience
7.9.1 Profile
7.9.2 Operation
8 Summary and Forecasting
8.1 Summary
8.2 Development Forecasting
8.2.1 Increasing Hemodialysis Population
8.2.2 Steadily Increasing Proportion of Dialysis Treatment
8.2.3 Market Size Forecasting
表:透析中心血透优缺点
表:家庭血液透析优缺点
图:血液透析行业产业链
图:1990-2020年全球肾病透析人数及预测
表:2011-2013年全球接受透析治疗病人数量
图:2011-2013年全球接受透析治疗病人的地区分布
图:2011-2013年全球接受透析治疗病人的国家分布
图:2013年全球透析设备市场竞争结构
图:2013年全球血液透析机市场竞争结构
图:2013年全球腹膜透析设备市场竞争结构
表:2011-2013年全球晚期肾衰患者不同治疗方式人数
图:2011-2013年全球晚期肾衰患者(按治疗方式)数量占比
图:2013年全球透析行业(分地区)服务形式
图:2013年全球透析行业主要国家和地区的服务形式
图:2013年全球前五大提供透析服务公司的透析人数
表:2013年全球血液透析服务市场(分地区)主要服务商及其透析人数
图:2008-2013年中国血液透析设备贸易逆差金额
图:2013年中国主要有血液透析机医疗器械注册证的生产企业及其产品
表:2013年中国透析设备生产企业地域分布
图:2013年中国透析市场规模
图:2009-2013年中国血液透析设备进口金额及增长率
图:2009-2013年中国血液透析设备进口数量及增长率
图:2011-2013年中国血液透析设备进口来源结构(按进口金额)
图:2011-2013年中国血液透析设备(分国家)平均进口单价对比
表:2011-2013年中国主要省市血液透析设备进口额占比
图:2009-2013年中国血液透析设备出口金额及增长率
表:2013年中国血液透析设备出口目的地结构(按出口金额)
表:2013年中国主要省市血液透析设备出口额占比
表:部分小型血液透析机介绍
表:费森尤斯集团旗下五大分支
图:2009-2013年费森尤斯医疗净收入和净利润
图:2011-2013年费森尤斯医疗(分产品)净收入占比
图:2011-2013年费森尤斯医疗(分地区)净收入占比
图:2009-2013年费森尤斯医疗透析产品净收入及增长率
图:2011-2013年费森尤斯医疗透析产品(分地区)净收入占比
图:2009-2013年费森尤斯医疗透析服务收入及增长率
图:2011-2013年费森尤斯医疗透析服务(分地区)净收入占比
图:2009-2013年费森尤斯医疗透析治疗人数及同比增长率
图:2011-2013年费森尤斯医疗(分地区)透析治疗人数占比
图:2013年费森尤斯医疗在全球主要市场的占有率(按透析病人数量)
表:2013年费森尤斯医疗生产工厂及主要产品
表:2013年费森尤斯医疗中国子公司经营情况
表:2013年日机装业务部门及其主营业务
图:FY2008-FY2012日机装净销售额和净利润
图:FY2012日机装(分部门)净销售额占比
图:FY2012日机装(分地区)净销售额占比
表:2013年日机装血液透析业务相关工厂
图:FY2008-FY2012日机装医疗部门净销售额及同比增长
表:百特主要业务及其产品
图:2009-2013年百特净销售额及净利润
表:2011-2013年百特(分部门)净销售额占比
表:2011-2013年百特(分地区)净销售额占比
图:2011-2013年百特医药产品部门(分产品)净销售额占比
图:2009-2013年百特肾科业务净销售额及同比增长
图:2010-2012年百特肾科业务(分地区)净销售额占比
图:2008-2012年金宝公司净销售额及EBITDA
表:2012年百特中国工厂及其主营业务
表:旭化成九大事业公司主营业务
图:2008-2012财年旭化成净销售额和净利润
图:2010-2012财年日本旭化成(分部门)净销售额占比
图:FY2008-FY2012旭化成健康医疗部门净销售额和营业利润
表:旭化成医疗主要关联公司
图:2007-2009年旭化成医疗器械(杭州)有限公司主营业务收入和营业利润
表:尼普洛三大业务板块及具体业务
图:2008-2012财年尼普洛净销售额和净利润
图:2012财年尼普洛(分业务)销售收入占比
图:2012财年尼普洛(分地区)销售收入占比
图:2008-2012财年尼普洛医疗相关业务净销售额和营业利润
图:2008-2012财年尼普洛制药相关业务净销售额和营业利润
表:Nipro在华主要子公司及其业务
表:尼普洛上海血液透析产品
图:2007-2009年上海尼普洛主营业务收入及利润总额
表:德国贝朗四大事业部门及其主要业务
图:2009-2013年德国贝朗销售额及EBITDA
图:2011-2013年德国贝朗(分部门)销售收入占比
图:2011-2013年德国贝朗(分地区)销售收入占比
图:2011-2013年德国贝朗产品及服务的销售收入占比
图:2009-2013年贝朗爱敦销售收入及同比增长
表:2013年德国贝朗在中国大陆的子公司及其主营业务
图:2009-2013年贝朗爱敦(上海)销售收入
表:NxStage主要事业部门及主营业务
图:2009-2013年美国Nxstage总收入及毛利润
图:2011-2013年美国Nxstage(分部门)收入占比
图:2009-2013年美国Nxstage便携式血液透析机部门收入及毛利润
图:2011-2013年美国Nxstage便携式血液透析机部门(分业务)收入占比
图:2008-2012年美国Nxstage血液透析耗材收入及毛利润
表:威高股份产品系列
图:2009-2013年威高股份营业收入和净利润
表:2011-2013年威高股份(分产品)营业收入
表:2011-2013年威高股份主要产品产量
表:2011-2013年威高股份(分产品)营业收入占比
表:2011-2013年威高股份(分地区)营业收入
表:2011-2013年威高股份(分地区)营业收入占比
图:2010-2012年威高股份研发支出及占营业收入比例
表:2013年威高股份血液透析业务相关子公司
图:2012-2016年威高股份营业收入及净利润预测
图:2009-2013年华仁药业营业收入及净利润
图:2009-2013年宝莱特营业收入及净利润
表:2011-2013年宝莱特(分产品)营业收入
图:2011-2013年宝莱特(分产品)营业收入占比
表:2011-2013年宝莱特(分地区)营业收入
图:2011-2013年宝莱特(分地区)营业收入占比
图:2011-2013年宝莱特主营产品毛利率
图:2011-2013年宝莱特研发支出及占营业收入比例
图:2011-2013年宝莱特前五名客户贡献收入及占比
图:2013年宝莱特前五名客户名称、收入贡献及占比
表:2013年宝莱特血液透析业务相关子公司情况
表:2012-2013年宝莱特透析液/透析粉产销量
图:2012-2016年宝莱特公司营业收入和净利润预测
图:2009-2013年科伦药业营业收入及净利润
图:2012-2013年青山利康营业收入和净利润
表:广州暨华血液透析系列产品
图:2008-2009年贝恩医疗主营业务收入、利润总额及毛利率
图:2007-2009年联合捷然主营业务收入、利润总额及毛利率
图:2007-2009年江苏朗生主营业务收入、利润总额及毛利率
表:截至2013年广州康盛股权结构
表:广州康盛产品系列
图:2012-2013年广州康盛主要财务指标
表:2013年全球及中国血液透析企业经营情况对比
图:每百万人ESRD 患病人数和人均GDP 正相关
表:2013-2016年中国血液透析市场规模预测
Pros and Cons of In-Center Hemodialysis
Pros and Cons of Home Hemodialysis
Hemodialysis Industry Chain
Global Number of Nephritic Patients Receiving Dialysis, 1990-2020E
Global Number of Patients Receiving Dialysis Treatment, 2011-2013
Patients Receiving Dialysis Treatment Worldwide by Region, 2011-2013
Patients Receiving Dialysis Treatment Worldwide by Country, 2011-2013
Competition Structure of Global Dialysis Equipment Market, 2013
Competition Structure of Global Hemodialysis Machine Market, 2013
Competition Structure of Global Peritoneal Dialysis Equipment Market, 2013
Global Number of Patients with Advanced Renal Failure by Treatment Method, 2011-2013
Proportions of Global Number of Patients with Advanced Renal Failure (by Treatment Method), 2011-2013
Service Forms of Global Dialysis Industry (by Region), 2013
Service Forms of Major Countries and Regions in Global Dialysis Industry, 2013
Number of Patients Receiving Dialysis at the World's Top Five Dialysis Service Providers, 2013
Number of Patients Receiving Dialysis at the World’s Leading Hemodialysis Service Providers (by Region), 2013
Amount of China’s Hemodialysis Equipment Trade Deficit, 2008-2013
Products of China’s Major Hemodialysis Machine Manufacturers Holding Medical Device Registration Certificate, 2013
Geographical Distribution of Chinese Dialysis Equipment Manufacturers, 2013
China's Dialysis Market Size, 2013
China's Hemodialysis Equipment Import Value and Growth Rate, 2009-2013
China's Hemodialysis Equipment Import Volume and Growth Rate, 2009-2013
China's Hemodialysis Equipment Import Source Structure (by Import Value), 2011-2013
Comparison by Average Unit Price of China’s Hemodialysis Equipment Imports (by Country), 2011-2013
China’s Hemodialysis Equipment Import Value Structure by Province/City, 2011-2013
China's Hemodialysis Equipment Export Value and Growth Rate, 2009-2013
China's Hemodialysis Equipment Export Destination Structure (by Export Value), 2013
China's Hemodialysis Equipment Export Value Structure by Province/City, 2013
Introduction of Some Small Hemodialysis Machines
Five Branches of Fresenius Group
Net Revenue and Net Income of Fresenius Medical Care, 2009-2013
Net Revenue Structure of Fresenius Medical Care (by Product), 2011-2013
Net Revenue Structure of Fresenius Medical Care (by Region), 2011-2013
Net Revenue and Growth Rate of Dialysis Products of Fresenius Medical Care, 2009-2013
Net Revenue Structure of Dialysis Products of Fresenius Medical Care (by Region), 2011-2013
Revenue and Growth Rate of Dialysis Service of Fresenius Medical Care, 2009-2013
Net Revenue Structure of Dialysis Service of Fresenius Medical Care (by Region), 2011-2013
Number of Patients Receiving Dialysis Treatment at Fresenius Medical Care and YoY Growth Thereof, 2009-2013
Proportion of Patients Receiving Dialysis Treatment at Fresenius Medical Care (by Region), 2011-2013
Market Share of Fresenius Medical Care in the World's Major Markets (by Number of Patients Receiving Dialysis), 2013
Production Plants and Main Products of Fresenius Medical Care, 2013
Operation of Fresenius Medical Care's Subsidiaries in China, 2013
Main Business of NIKKISO by Division, 2013
Net Sales and Net Income of NIKKISO, FY2008-FY2012
Net Sales Structure of NIKKISO (by Division), FY2012
Net Sales Structure of NIKKISO (by Region), FY2012
Hemodialysis-Related Factories of NIKKISO, 2013
Net Sales and YoY Growth of Medical Division of NIKKISO, FY2008-FY2012
Main Business and Products of Baxter
Net Sales and Net Income of Baxter, 2009-2013
Net Sales Structure of Baxter (by Division), 2011-2013
Net Sales Structure of Baxter (by Region), 2011-2013
Net Sales Structure of Medical Products Division of Baxter (by Product), 2011-2013
Net Sales and YoY Growth of Renal Business of Baxter, 2009-2013
Net Sales Structure of Renal Business of Baxter (by Region), 2010-2012
Net Sales and EBITDA of Gambro AB, 2008-2012
Main Business of Baxter’s Factories in China, 2012
Main Business of Nine Core Operating Companies of Asahi Kasei
Net Sales and Net Income of Asahi Kasei, FY2008-FY2012
Net Sales Structure of Asahi Kasei (by Division), FY2010-FY2012
Net Sales and Operating Income of Health Care Division of Asahi Kasei, FY2008-FY2012
Major Affiliates of Asahi Kasei Medical
Operating Revenue and Operating Income of Asahi Kasei Medical (Hangzhou), 2007-2009
Three Major Business Segments and Specific Business of Nipro
Net Sales and Net Income of Nipro, FY2008-FY2012
Sales Structure of Nipro (by Business), FY2012
Sales Structure of Nipro (by Region), FY2012
Net Sales and Operating Income of Medical-Care-Related Business of Nipro, FY2008-FY2012
Net Sales and Operating Income of Pharmaceutical-Related Business of Nipro, FY2008-FY2012
Business of Nipro’s Subsidiaries in China
Hemodialysis Products of Nipro Trading (Shanghai)
Operating Revenue and Total Profit of Nipro Trading (Shanghai), 2007-2009
Main Business of Four Divisions of B.Braun
Sales and EBITDA of B.Braun, 2009-2013
Sales Structure of B.Braun (by Division), 2011-2013
Sales Structure of B.Braun (by Region), 2011-2013
Sales Structure of B.Braun (by Product and Service), 2011-2013
Sales and YoY Growth of B.Braun Avitum, 2009-2013
Main Business of B.Braun’s Subsidiaries in Mainland China, 2013
Sales of B.Braun Avitum (Shanghai) Trading Company Limited, 2009-2013
Main Business Divisions and Business of Nxstage
Total Revenue and Gross Profit of Nxstage, 2009-2013
Revenue Structure of Nxstage (by Division), 2011-2013
Revenue and Gross Profit of Portable Hemodialysis Machine Division of Nxstage, 2009-2013
Revenue Structure of Portable Hemodialysis Machine Division of Nxstage (by Business), 2011-2013
Revenue and Gross Profit of Hemodialysis Consumables of Nxstage, 2008-2012
Product Line of Weigao Group
Revenue and Net Income of Weigao Group, 2009-2013
Revenue Breakdown of Weigao Group (by Product), 2011-2013
Output of Main Products of Weigao Group, 2011-2013
Revenue Structure of Weigao Group (by Product), 2011-2013
Revenue Breakdown of Weigao Group (by Region), 2011-2013
Revenue Structure of Weigao Group (by Region), 2011-2013
R&D Costs and % of Total Revenue of Weigao Group, 2010-2012
Hemodialysis-Related Subsidiaries of Weigao Group, 2013
Revenue and Net Income of Weigao Group, 2012-2016E
Revenue and Net Income of Huaren Pharmaceutical, 2009-2013
Revenue and Net Income of Guangdong Biolight Meditech, 2009-2013
Revenue Breakdown of Guangdong Biolight Meditech (by Product), 2011-2013
Revenue Structure of Guangdong Biolight Meditech (by Product), 2011-2013
Revenue Breakdown of Guangdong Biolight Meditech (by Region), 2011-2013
Revenue Structure of Guangdong Biolight Meditech (by Region), 2011-2013
Gross Margin of Main Products of Guangdong Biolight Meditech, 2011-2013
R&D Costs and % of Total Revenue of Guangdong Biolight Meditech, 2011-2013
Guangdong Biolight Meditech’s Revenue from Top 5 Clients and % of Total Revenue, 2011-2013
Name List, Revenue Contribution and % of Guangdong Biolight Meditech's Top 5 Clients, 2013
Hemodialysis-Related Subsidiaries of Guangdong Biolight Meditech, 2013
Output and Sales Volume of Dialysis Solution/Powder of Guangdong Biolight Meditech, 2012-2013
Revenue and Net Income of Guangdong Biolight Meditech, 2012-2016E
Revenue and Net Income of Kelun Pharmaceutical, 2009-2013
Revenue and Net Income of Chengdu Qingshan Likang Pharmaceutical, 2012-2013
Hemodialysis Series Products of Jihua Medical Apparatus and Instruments
Operating Revenue, Total Profit and Gross Margin of Bain Medical Equipment, 2008-2009
Operating Revenue, Total Profit and Gross Margin of Beijing United Bio-Tech, 2007-2009
Operating Revenue, Total Profit and Gross Margin of Jiangsu Lengthen Life Science and Technology, 2007-2009
Shareholding Structure of Guangzhou Koncen Bioscience as of 2013
Product Line of Guangzhou Koncen Bioscience
Key Financial Indicators of Guangzhou Koncen Bioscience, 2012-2013
Operation Comparison between Global and Chinese Hemodialysis Enterprises, 2013
Positive Correlation between the Number of ESRD Patients per Million Population and GDP Per Capita
China Hemodialysis Market Size, 2013-2016E
如果这份报告不能满足您的要求,我们还可以为您定制报告,请 留言说明您的详细需求。
|