|
|
|
报告导航:研究报告—
生命科学—制药医疗
|
|
2013-2016年中国化学制药行业研究报告 |
 |
字数:4.2万 |
页数:133 |
图表数:159 |
|
中文电子版:8500元 |
中文纸版:4250元 |
中文(电子+纸)版:9000元 |
|
英文电子版:2500美元 |
英文纸版:2700美元 |
英文(电子+纸)版:2800美元 |
|
编号:ZYM055
|
发布日期:2014-05 |
附件:下载 |
 |
|
|
化学制药主要分化学制剂和原料要两大类,且化学制剂行业毛利率一般高于同期原料药。2013年,中国化学制剂与原料药行业收入分别达5731亿元、3820亿元,毛利率分别为35%-40%、20%。
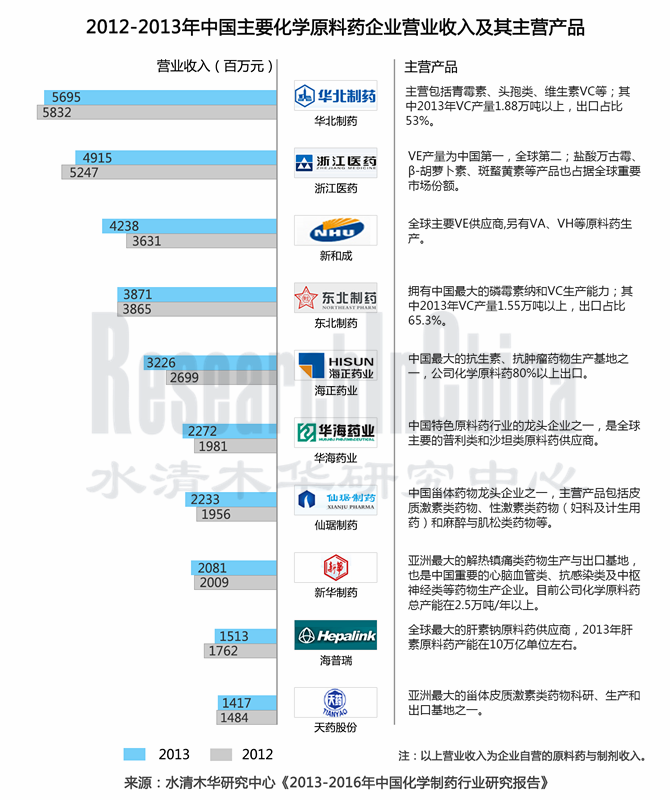
中国是化学原料药生产大国,能够生产约1600种原料药。青霉素类、维生素类与解热镇痛类等多个大宗原料药品种产量位居世界第一;他汀类、普利类、沙坦类等特色原料药也在国际市场占据重要份额。2013年中国化学原料药产量270.9万吨。
虽然中国是全球主要的化学原料药供应地区,但是由于原料药品类众多,加之国内企业总体实力有限,目前中国化学原料药行业集中度较低,企业一般只能在单一或几个品类药品市场占据重要地位。并且在环保和产业升级的双重压力下,国内许多大型原料药企业通过研发、收购等方式向制剂企业转移。
华北制药和东北制药是中国抗生素和VC原料药主要供应商,其中VC供应能力均在2万吨左右,2013年这两家企业的原料药和制剂业务合计收入分别为56.95亿元、38.71亿元。
浙江医药和新和成是全球VE产品主要生产商,并且两家企业的VE原材料(维生素E生产的关键是有限的原料,异植物醇IP和三甲基氢醌TMHQ)都是自给生产。不过由于全球VE市场需求疲软,企业发展受限,其中浙江医药2013年的医药业务(原料药+制剂)营业收入同比下滑6.3%,至49.15亿元。
海正药业和华海药业是中国特色原料药重要供应商。其中海正药业以抗肿瘤、心血管类产品为主;华海药业是全球主要的普利类和沙坦类原料药供应商(2013年华海药业又获得 EDQM认证书3项)。2013年海正药业、华海药业的原料药和制剂业务合计收入分别达32.26亿元、22.72亿元,同比分别增长19.5%、14.7%。
仙琚制药和天药股份是中国激素类原料药的龙头企业,其中仙琚药业近年一直积极向下游制剂业务拓展。在环保趋严以及人力、原材料等成本上涨的大背景下,发展下游无疑保证了公司的竞争力,2013年仙琚制药的原料药和制剂合计营业收入同比增长16.2%,达22.33亿元;同期,仙琚制药获得3项原料药EDQM认证书。
《2013-2016年中国化学制药行业研究报告》主要包括以下几个方面:
 全球化学制药行业发展现状、市场供需、地区结构以及发展趋势等; 全球化学制药行业发展现状、市场供需、地区结构以及发展趋势等;
中国化学制药行业发展现状、竞争格局、进出口以及发展预测等;
中国维生素类、抗生素类、解热镇痛类、抗肿瘤类、心脑血管类等化学制药细分市场的发展现状、竞争格局以及进出口等;
中国20家化学原料药与制剂企业的经营状况、及发展前景等。
Chemical pharmaceutical consists mainly of chemical drug preparation and active pharmaceutical ingredient (API), and the gross margin of chemical drug preparation industry is generally higher than that of the API over the same period. In 2013, China chemical drug preparation industry and and China API industry recorded revenue of RMB 573.1 billion and RMB 382 billion, with gross margin of 35%-40% and 20%, respectively.
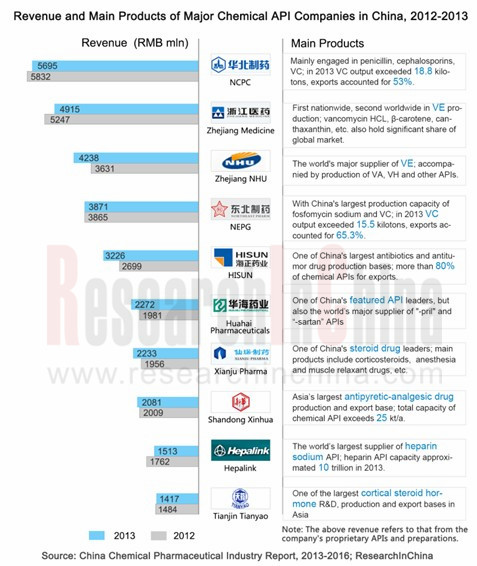
China is a big producer of chemical APIs, capable of producing about 1,600 varieties of APIs. China ranks first worldwide in output of several bulk APIs including penicillins, vitamins and antipyretic analgesics, and holds a significant share of the featured APIs like statins, prils, sartans in the world. China produced 2.709 million tons of chemical APIs in 2013.
Although China is the world's leading chemical APIs supply region, the concentration of China chemical APIs industry is rather low due to numerous categories of APIs and limited overall strength of domestic enterprises, which occupy an important place only in single or a few categories of pharmaceuticals market. In addition, under the pressure of both environmental protection and industrial upgrading, many large APIs companies in the country are transforming into drug preparation companies through means such as R&D and acquisitions.
North China Pharmaceutical Group Corp. (NCPC) and Northeast Pharmaceutical Group Co., Ltd. are major suppliers of antibiotic and VC APIs in China, with supply of VS reaching around 20,000 tons each. In 2013, the two companies’ total revenue from APIs and their revenue from drug preparation business reached RMB 5.695 billion and RMB 3.871 billion, respectively.
Zhejiang Medicine Co., Ltd. and Zhejiang NHU Co., Ltd. are the leading manufacturers of VE products around the globe, with raw materials (vital ingredients for the production of VE are limited raw materials: isophytol and trimethylhydroquinone) for VE being produced by themselves. However, the two companies’ development is constrained due to a weak global demand for VE, of which Zhejiang Medicine reported revenue of RMB 4.915 billion from pharmaceutical business (APIs+ preparation), down 6.3% year on year.
Zhejiang Hisun Pharmaceutical Co., Ltd. and Zhejiang Huahai Pharmaceuticals Co., Ltd. are the key suppliers of featured APIs in China, of which the former specializes in antineoplastic and cardiovascular products, and the latter, which obtains three certificates from EDQM in 2013, is a major global supplier of prils and sartans APIs. In 2013, the two companies’ total revenues from APIs and drug preparation business were RMB 3.226 billion and RMB 2.272 billion, rising by 19.5% and 14.7% from the previous year, respectively.
Zhejiang Xianju Pharmaceutical Co., Ltd. and Tianjin Tianyao Pharmaceuticals Co., Ltd. are the leading suppliers of hormone APIs, of which the former has been aggressively expanding into downstream drug preparation business. In the context of stricter environmental standards and rising costs of raw materials, developing the downstream will undoubtedly ensure competitiveness of the company. In 2013, Xianju Pharmaceutical posted total revenue of RMB 2.233 billion from APIs and preparation business, up 16.2% against the prior year. Also in 2013, the company acquired three EDQM certificates for its APIs.
China Chemical Pharmaceutical Industry Report, 2013-2016 highlights the following:
Development status quo, supply and demand, regional structure and trend of global chemical pharmaceutical industry;
Development status quo, competitive landscape, import and export and forecast of China chemical pharmaceutical industry;
Development status quo, competitive landscape and import and export of China chemical pharmaceutical segments, including vitamins, antibiotics, antipyretic analgesics, antineoplastics and cardiovascular and cerebrovascular;
Operation and prospects of 20 Chinese chemical APIs and preparation companies.
第一章 化学制药行业相关概述
1.1 定义及分类
1.2 产业链解析
第二章 全球化学制药行业发展概况
2.1 发展现状
2.2 市场供需
2.2.1 产品结构
2.2.1 地区结构
2.3 主要国家和地区
2.3.1 北美
2.3.2 欧洲
2.3.3 新兴国家
2.4 发展趋势
2.4.1 专利药陷困境,仿制药前景看好
2.4.2 新兴国家是增长引擎
第三章 中国化学制药行业发展概况
3.1 发展现状
3.1.1 总体状况
3.1.2 医药创新能力提升
3.1.3 医药兼并重组活跃
3.2 运营能力
3.3 进出口
3.3.1 化学制剂
3.3.2 化学原料药
3.4 竞争格局
第四章 中国化学制药细分市场分析
4.1 维生素类
4.1.1 发展现状
4.1.2 竞争格局
4.1.3 进出口
4.2 抗生素类
4.2.1 发展现状
4.2.2 竞争格局
4.2.3 进出口
4.3 解热镇痛类
4.3.1 发展现状
4.3.2 竞争格局
4.3.3 进出口
4.4 激素类
4.4.1 发展现状
4.4.2 竞争格局
4.4.3 进出口
4.5 抗肿瘤类
4.5.1 发展现状
4.5.2 竞争格局
4.6 心脑血管类
4.6.1 发展现状
4.6.2 竞争格局
第五章 中国主要化学原料药生产企业
5.1 东北制药
5.1.1 企业简介
5.1.2 经营状况
5.1.3 营收构成
5.1.4 研发
5.1.5 发展前景
5.2 华北制药
5.2.1 企业简介
5.2.2 经营状况
5.2.3 营收构成
5.2.4研发
5.2.5 发展前景
5.3 浙江医药
5.3.1 企业介绍
5.3.2 经营状况
5.3.3 营收构成
5.3.4 投资与研发
5.3.5 发展预期
5.4 海正药业
5.4.1 企业简介
5.4.2 经营状况
5.4.3 营收构成
5.4.4 研发
5.5.5 发展前景
5.5 新和成
5.5.1 企业简介
5.5.2 经营状况
5.5.3 营收构成
5.5.4 研发
5.5.5 发展前景
5.6 新华制药
5.6.1 企业简介
5.6.2 经营状况
5.6.3 营收构成
5.6.4 研发
5.6.5 发展前景
5.7 海普瑞
5.7.1 企业简介
5.7.2 经营状况
5.7.2 营收构成
5.7.4 研发
5.7.5 发展前景
5.8 仙琚制药
5.8.1 企业简介
5.8.2 经营状况
5.8.3 营收构成
5.8.4 研发
5.8.5 发展前景
5.9 华海药业
5.9.1 企业简介
5.9.2 经营状况
5.9.3 营收构成
5.9.4研发
5.9.5 发展预期
5.10 天药股份
5.10.1 企业简介
5.10.2 经营状况
5.10.3 营收构成
5.10.3 投资与研发
5.10.4 发展前景
第六章 中国主要化学制剂生产企业
6.1 华润双鹤
6.1.1 公司简介
6.1.2 经营情况
6.1.3 营收构成
6.1.4投资与研发
6.1.5 发展前景
6.2 恒瑞医药
6.2.1 企业简介
6.2.2 经营状况
6.2.3 营收构成
6.2.4 研发与投资
6.2.5 发展前景
6.3 三精制药
6.3.1 企业简介
6.3.2 经营概况
6.3.3 营收构成
6.3.4 研发与投资
6.4 海思科
6.4.1 企业简介
6.4.2 经营状况
6.4.3 营收构成
6.4.4 投资与研发
6.4.5 发展前景
6.5 丽珠集团
6.5.1 企业简介
6.5.2 经营状况
6.5.3 营收构成
6.5.4 发展前景
6.5.5 发展前景
6.6 复星医药
6.6.1 公司简介
6.6.2 经营状况
6.6.3 营收构成
6.6.4 研发与投资
6.6.5 发展前景
6.7 恩华药业
6.7.1 公司简介
6.7.2 经营状况
6.7.3 营收构成
6.7.4 研发
6.7.5 发展前景
6.8 海南海药
6.8.1 企业简介
6.8.2 经营状况
6.8.3 营收构成
6.8.4研发
6.8.5 发展前景
6.9华仁药业
6.9.1 企业简介
6.9.2 经营状况
6.9.3 营收构成
6.9.4 投资与研发
6.9.5 发展前景
6.10 人福医药
6.10.1 公司简介
6.10.2 经营状况
6.10.3 营收构成
6.10.4 投资与研发
6.10.5 发展前景
第七章 总结与预测
7.1 总体
7.1.1 市场规模预测
7.1.2 盈利预测
7.2 公司分析
1. Overview of Chemical Pharmaceutical Industry
1.1 Definition and Classification
1.2 Industry Chain
2. Development of Global Chemical Pharmaceutical Industry
2.1 Status Quo
2.2 Supply and Demand
2.2.1 Product Mix
2.2.1 Regional Structure
2.3 Major Countries and Regions
2.3.1 North America
2.3.2 Europe
2.3.3 Emerging Countries
2.4 Development Trends
2.4.1 Proprietary Drugs in Trouble, Generic Drugs with Great Potential
2.4.2 Emerging Countries Being Growth Engines
3. Development of China Chemical Pharmaceutical Industry
3.1 Status Quo
3.1.1 Overall Conditions
3.1.2 Improvement in Pharmaceutical Innovation Capability
3.1.3 Active Merger and Reorganization of Pharmaceutical Companies
3.2 Operating Capability
3.3 Import and Export
3.3.1 Chemical Preparations
3.3.2 Chemical APIs
3.4 Competitive Landscape
4. China Chemical Pharmaceutical Market Segments
4.1 Vitamins
4.1.1 Status Quo
4.1.2 Competitive Landscape
4.1.3 Import and Export
4.2 Antibiotics
4.2.1 Status Quo
4.2.2 Competitive Landscape
4.2.3 Import and Export
4.3 Antipyretic Analgesics
4.3.1 Status Quo
4.3.2 Competitive Landscape
4.3.3 Import and Export
4.4 Hormones
4.4.1 Status Quo
4.4.2 Competitive Landscape
4.4.3 Import and Export
4.5 Anti-tumor
4.5.1 Status Quo
4.5.2 Competitive Landscape
4.6 Cardiovascular and Cerebrovascular
4.6.1 Status Quo
4.6.2 Competitive Landscape
5. Key Chinese Chemical APIs Companies
5.1 Northeast Pharmaceutical Group Co., Ltd.
5.1.1 Profile
5.1.2 Operation
5.1.3 Revenue Structure
5.1.4 R&D
5.1.5 Prospects
5.2 North China Pharmaceutical Co., Ltd.
5.2.1 Profile
5.2.2 Operation
5.2.3 Revenue Structure
5.2.4 R&D
5.2.5 Prospects
5.3 Zhejiang Medicine Co., Ltd.
5.3.1 Profile
5.3.2 Operation
5.3.3 Revenue Structure
5.3.4 Investment and R&D
5.3.5 Forecast
5.4 Zhejiang Hisun Pharmaceutical Co., Ltd.
5.4.1 Profile
5.4.2 Operation
5.4.3 Revenue Structure
5.4.4 R&D
5.5.5 Prospects
5.5 Zhejiang NHU Co., Ltd.
5.5.1 Profile
5.5.2 Operation
5.5.3 Revenue Structure
5.5.4 R&D
5.5.5 Prospects
5.6 Shandong Xinhua Pharmaceutical Company Limited
5.6.1 Profile
5.6.2 Operation
5.6.3 Revenue Structure
5.6.4 R&D
5.6.5 Prospects
5.7 Shenzhen Hepalink Pharmaceutical Co., Ltd.
5.7.1 Profile
5.7.2 Operation
5.7.2 Revenue Structure
5.7.4 R&D
5.7.5 Prospects
5.8 Zhejiang Xianju Pharmaceutical Co., Ltd.
5.8.1 Profile
5.8.2 Operation
5.8.3 Revenue Structure
5.8.4 R&D
5.8.5 Prospects
5.9 Zhejiang Huahai Pharmaceutical Co., Ltd.
5.9.1 Profile
5.9.2 Operation
5.9.3 Revenue Structure
5.9.4 R&D
5.9.5 Forecast
5.10 Tianjin Tianyao Pharmaceuticals Co., Ltd.
5.10.1 Profile
5.10.2 Operation
5.10.3 Revenue Structure
5.10.3 Investment and R&D
5.10.4 Prospects
6. Key Chinese Chemical Preparation Companies
6.1 China Resources Double-Crane Pharmaceutical Co., Ltd.
6.1.1 Profile
6.1.2 Operation
6.1.3 Revenue Structure
6.1.4 Investment and R&D
6.1.5 Prospects
6.2 Jiangsu Hengrui Medicine Co., Ltd.
6.2.1 Profile
6.2.2 Operation
6.2.3 Revenue Structure
6.2.4 R&D and Investment
6.2.5 Prospects
6.3 Harbin Pharm. Group Sanjing Pharmaceutical Shareholding Co., Ltd.
6.3.1 Profile
6.3.2 Operation
6.3.3 Revenue Structure
6.3.4 R&D and Investment
6.4 Xizang Haisco Pharmaceutical Group Co., Ltd.
6.4.1 Profile
6.4.2 Operation
6.4.3 Revenue Structure
6.4.4 Investment and R&D
6.4.5 Prospects
6.5 Livzon Pharmaceutical Group Inc.
6.5.1 Profile
6.5.2 Operation
6.5.3 Revenue Structure
6.5.4 Prospects
6.6 Shanghai Fosun Pharmaceutical (Group) Co., Ltd.
6.6.1 Profile
6.6.2 Operation
6.6.3 Revenue Structure
6.6.4 R&D and Investment
6.6.5 Prospects
6.7 Jiangsu Nhwa Pharmaceutical Co., Ltd.
6.7.1 Profile
6.7.2 Operation
6.7.3 Revenue Structure
6.7.4 R&D
6.7.5 Prospects
6.8 Hainan Haiyao Co., Ltd.
6.8.1 Profile
6.8.2 Operation
6.8.3 Revenue Structure
6.8.4 R&D
6.8.5 Prospects
6.9 Huaren Pharmaceutical Co., Ltd.
6.9.1 Profile
6.9.2 Operation
6.9.3 Revenue Structure
6.9.4 Investment and R&D
6.9.5 Prospects
6.10 Humanwell Healthcare (Group) Co., Ltd.
6.10.1 Profile
6.10.2 Operation
6.10.3 Revenue Structure
6.10.4 Investment and R&D
6.10.5 Prospects
7. Conclusion and Forecast
7.1 Overall
7.1.1 Market Size Forecast
7.1.2 Profit Forecast
7.2 Companies
表:中国化学制药行业子行业分类
图:化学制药行业利润分配格局
图:2003-2013年全球药品市场规模及同比增长
图:2013年全球医药行业并购案交易额
表:2013年全球前10制药并购案
图:2010-2013年FDA批准新药个数
表:2013年FDA批准的新药及销售额
表:2013年全球15家大型药企重磅药物及其销售额
图:2008-2013年全球仿制药销售额占比
图:全球医药产业区域布局
图:2012年全球药品市场规模及同比增长(分国家和地区)
图:1995-2012年美国、加拿大医疗卫生开支在GDP中占比
图:2010-2012年美国药品销售额
图:1995-2012年英国、法国医疗卫生开支在GDP中占比
图:2010-2012年西欧地区药品销售额
图:2010-2012年新兴国家药品销售额
图:2010-2012年新兴国家对全球药品销售增长贡献
图:2000-2012年中国、美国、英国、印度GPD实际增长率
图:2010-2013年中国化学制药工业总产值及占GDP比重
图:2010--2013年中国化学原料药与制剂工业营业收入对比
图:2007-2013年中国化学原料药产量
表:2013年中国批准上市药品情况
图:2010-2013年中国化学制剂行业营业收入及利润
图:2010-2013年中国化学原料药营业收入及利润
图:2010-2013年中国化学制剂与化学原料药毛利率
2010-2013年中国化学原料药进出口额
2010-2013年中国特色原料药出口额及同比增速
2013年中国化学原料药出口地区分布(按金额)
表:2012年中国医院终端化药购药金额结构(按疾病类型)
图:2010-2013年中国维生素产量及出口量占比
表:2012年中国主要维生素C企业及其产量
表:2012年中国VE主要企业及其产量
图:2009-2013年中国维生素出口量、出口金额及均价
图:2008-2013年中国维生素(分产品)出口量占比
图:2013年中国维生素出口目的地分析
图:2010-2013年中国维生素进口量、进口金额及均价
图:2008-2013年中国维生素(分产品)进口量占比
图:2013年中国维生素进口来源地分析
表:2012年中国主要抗生素原料药产品的产量
表:2012年中国主要抗生素制剂产品的产量
表:2012年中国主要抗生素类原料药生产商及产量
表:2008-2013年中国抗菌素进口量及金额
表:2008-2013年中国抗菌素出口量及金额
表:2012年中国主要解热镇痛类原料药产量及出口量
图:2010-2012年中国解热镇痛原料药出口量
图:2012年中国解热镇痛类原料药出口结构(按量)
图:2010-2012年中国激素类药物产量
表:2012年中国主要激素类原料药产量(吨)
表:2013年中国主要激素类产品出口量及金额
表:2012年中国22城市典型医院抗肿瘤和免疫调节剂用药主要品种购药金额及占比
表:2012年中国22城市典型医院心血管系统用药主要品种购药金额及占比
图:2010-2013年东北制药营收及净利润
表:2011-2012年东北制药VC系列产品产量及出口量
图:2010-2013年东北制药(分产品)主营收入
表:2010-2013年东北制药(分地区)主营收入
图:2013-2016年东北制药营业收入与净利润
表:2012年华北制药部分原料药产量及出口量
图:2009-2013年华北制药营收及净利润
图:2009-2013年华北制药(分产品)主营收入
图:2009-2013年华北制药(分地区)主营收入
图:2011-2013年华北制药研发投入及占营业收入比重
图:2013-2016年华北制药营业收入与净利润
表:2012年浙江医药部分原料药产量及出口量
图:2009-2013年浙江医药营业收入与净利润
表:2009-2013年浙江医药(分产品)营业收入
表:2009-2013年浙江医药(分地区)营业收入
图:2011-2013年浙江医药研发投入及占营业收入的比重
图:2013-2016年浙江医药营业收入与净利润
图:2010-2013年海正药业营业收入及净利润
图:2009-2013年海正药业(分产品)主营收入
图:2009-2013年海正药业(分地区)营业收入
图:2010-2013年海正药业研发投入及占营业收入比重
图:2013-2016年海正药业营业收入与净利润
图:2009-2013年新和成营业收入及净利润
表:2010-2013年新和成(分产品)主营业收入
图:2010-2013年新和成(分地区)主营业收入
图:2010-2014年新和成研发投入及占营业收入的比重
图:2013-2016年新和成营业收入与净利润
图:2009-2013年新华制药营业收入及净利润
表:2010-2013年新华制药(分产品)主营业收入
表:2013年新华制药主要产品及占营业收入的比重
图:2013-2016年新华制药营业收入与净利润
图:2009-2013年海普瑞营业收入及净利润
表:2009-2013年海普瑞(分地区)主营业收入
表:2009-2013年海普瑞(分地区)主营业收入
图:2009-2013年海普瑞研发投入及占营业收入的比重
图:2009-2013年仙琚制药营业收入及净利润
图:2009-2013年仙琚制药(分产品)主营收入
图:2009-2013年仙琚制药(分地区)营业收入
图:2010-2013年仙琚制药研发投入及占营业收入的比重
图:2013-2016年仙琚制药营业收入与净利润
图:2009-2013年华海药业营业收入及净利润
图:2009-2013年华海药业(分产品)营业收入
图:2010-2013年华海药业(分地区)营业收入
图:2011-2013年华海药业研发投入及占营业收入比重
图:2013-2016年华海药业营业收入与净利润
图:2010-2013年天药股份营收及净利润
图:2010-2013年天药股份(分产品)营收
图:2010-2013年天药股份(分地区)营收
表:2013年天药股份研发投入及占比
表:2013年天药股份投资项目
图:2013-2016年天药股份营收及净利润
2010-2013年华润双鹤营收及净利润
表:2010-2013年华润双鹤(分行业)营收占比
图:2013年华润双鹤毛利率(分产品)
表:2010-2013年华润双鹤(分地区)营收状况
表:2013年华润双鹤投资建设项目
表:2013年华润双鹤研发支出结构
图:2013-2016年华润双鹤营收及净利润
图:2010-2013年恒瑞医药营收及净利润
图:2010-2013年恒瑞医药(分产品)主营业收入
表:2013年恒瑞医药研发支出(单位:元)
表:截止2013年恒瑞医药投资项目进度
图:2013-2016年恒瑞医药营业收入与净利润
图:2010-2013年三精制药营业收入及净利润
表:2010-2013年三精制药(分产品)主营业收入
表:2013年三精制药研发支出(单位:元)
图:2010-2013年海思科营收及净利润
图:2013年海思科(分产品)营收及毛利率
表:2010-2013年海思科(分地区)营业收入
表:2013年海思科投资项目
表:2010-2013年海思科研发投资金额
图:2013-2016年海思科营收及净利润
图:2008-2013年丽珠集团营业收入及净利润
表:2008-2013年丽珠集团(分产品)主营收入
表:2008-2013年丽珠集团(分地区)主营业收入
图:2013-2016年丽珠集团营业收入和净利润
图:2008-2013年复星医药营业收入及净利润
表:2008-2013年复星医药(分产品)主营业收入
图:2008-2013年复星医药(分地区)营业收入
图:2008-2013年复星医药研发支出及占营业收入比例
表:2013-2016年复星医药营业收入和净利润
图:2009-2013年恩华药业营业收入与净利润
表:2009-2013年恩华药业(分产品)营业收入
图:2010-2013年恩华药业研发投入及占营业收入比重
图:2013-2016年恩华药业营业收入与净利润
图:2009-2013年海南海药营业收入与净利润
表:2009-2013年海南海药(分产品)主营业收入
图:2011-2013年海南海药研发投入及占同期营业收入比重
图:2013-2016年海南海药营业收入与净利润
图:2010-2013年华仁药业营收及净利润
图:2010-2013年华仁药业(分产品)营业收入
图:2010-2013年华仁药业(分产品)毛利率
图:2013年华仁药业(分地区)营业收入
表:2013年华仁药业投资项目
表:2013年华仁药业并购交易
表:2011-2013年华仁药业研发投入
图:2013-2016年华仁药业营收及净利润
图:2010-2013年人福医药营收及净利润
表:2013年人福药业(分产品)营收及毛利率
表:2010-2013年人福药业(分地区)营业收入
表:2013年人福医药项目投资情况
表:2013年人福医药股权投资情况
图:2013-2016年人福药业营收及净利润
图:2004-2013年中国65岁及以上老年人数及占总人口比例
图:2010-2016年中国化学制剂与化学原料营业收入预测
图:2010-2016年中国化学制剂与化学原料药毛利率
表:2013年中国主要化学原料药企业营业收入及其主营产品
表:2013年中国主要化学制剂企业营业收入
Classification of Sub-sectors of China Chemical Pharmaceutical Industry
Profit Distribution of Chemical Pharmaceutical Industry
Size and YoY Growth Rate of Global Pharmaceuticals Market, 2003-2013
M&A Transaction Value in Global Pharmaceutical Industry, 2013
Global Top10 Mergers and Acquisitions in Pharmaceutical Industry, 2013
Number of New Drugs Approved by FDA, 2010-2013
New Drugs Approved by FDA and Sales, 2013
Blockbuster Drugs and Sales of 15 Large Global Pharmaceutical Companies, 2013
Sales Proportion of Global Generic Drugs, 2008-2013
Regional Distribution of Global Pharmaceutical Industry
Size and YoY Growth Rate of Global Pharmaceuticals Market by Country and Region, 2012
Proportion of Spending on Health Care to GDP in the U.S. and Canada, 1995-2012
Pharmaceuticals Sales in the United States, 2010-2012
Proportion of Spending on Health Care to GDP in Britain and France, 1995-2012
Pharmaceuticals Sales in Western Europe, 2010-2012
Pharmaceuticals Sales in Emerging Countries, 2010-2012
Contributions of Emerging Countries to Global Pharmaceuticals Sales Growth, 2010-2012
Real GDP Growth Rates of China, U.S., Britain and India, 2000-2012
Total Output Value and % of GDP of China Chemical Pharmaceutical Industry, 2010-2013
Comparison of Revenue from China Chemical APIs and Preparation Industries, 2010-2013
Output of Chemical APIs in China, 2007-2013
Pharmaceuticals Approved for Marketing in China, 2013
Revenue and Profit of China Chemical Preparation Industry, 2010-2013
Revenue and Profit of China Chemical APIs Industry, 2010-2013
Gross Margin of China Chemical Preparation and Chemical APIs Industry, 2010-2013
Import and Export Value of Chemical APIs in China, 2010-2013
Export Value and YoY Growth Rate of Featured APIs in China, 2010-2013
Regional Distribution of China’s Chemical API Export by Value, 2013
Chemical Pharmaceuticals Purchase Amount Breakdown of China’s Hospitals by Disease Pattern, 2012
Output and % of Vitamin in Export Volume in China, 2010-2013
Major Vitamin C Companies and Their Output in China, 2012
Major Vitamin E Companies and Their Output in China, 2012
Export Volume and Value and Average Price of China’s Vitamins, 2009-2013
Proportion of Export Volume of China’s Vitamins by Product, 2008-2013
Export Destinations of China’s Vitamins, 2013
Import Volume and Value and Average Price of Vitamins in China, 2010-2013
Proportion of Import Volume of Vitamins in China by Product, 2008-2013
Sources of Imported Vitamins in China, 2013
Output of Main Antibiotic APIs in China, 2012
Output of Main Antibiotic Preparations in China, 2012
Manufacturers and Output of Main Antibiotic APIs in China, 2012
Import Volume and Value of Antibiotics in China, 2008-2013
Export Volume and Value of Antibiotics in China, 2008-2013
Output and Export Volume of Antipyretic Analgesics APIs in China, 2012
Export Volume of Antipyretic Analgesics APIs in China, 2012
Export Structure of Antipyretic Analgesics APIs in China by Volume, 2012
Hormone Drugs Output in China, 2010-2012
Output of Main Hormone APIs in China, 2012
Export Volume and Value of Hormone Products in China, 2013
Purchase Amount and Proportion of Main Antineoplastic and Immunoregulatory Drugs in Typical Hospitals of 22 Cities in China, 2012
Purchase Amount and Proportion of Main Cardiovascular System Drugs in Typical Hospitals of 22 Cities in China, 2012
Revenue and Net Income of Northeast Pharmaceutical, 2010-2013
Output and Export Volume of VC Series Products of Northeast Pharmaceutical, 2011-2012
Operating Revenue of Northeast Pharmaceutical by Product, 2010-2013
Operating Revenue of Northeast Pharmaceutical by Region, 2010-2013
Revenue and Net Income of Northeast Pharmaceutical, 2013-2016E
Output and Export Volume of Some APIs of North China Pharmaceutical, 2012
Revenue and Net Income of North China Pharmaceutical, 2009-2013
Operating Revenue of North China Pharmaceutical by Product, 2009-2013
Operating Revenue of North China Pharmaceutical by Region, 2009-2013
R&D Costs and % of Revenue of North China Pharmaceutical, 2011-2013
Revenue and Net Income of North China Pharmaceutical, 2013-2016E
Output and Export Volume of Some APIs of Zhejiang Medicine, 2012
Revenue and Net Income of Zhejiang Medicine, 2009-2013
Revenue of Zhejiang Medicine by Product, 2009-2013
Revenue of Zhejiang Medicine by Region, 2009-2013
R&D Costs and % of Revenue of Zhejiang Medicine, 2011-2013
Revenue and Net Income of Zhejiang Medicine, 2013-2016E
Revenue and Net Income of Zhejiang Hisun Pharmaceutical, 2010-2013
Operating Revenue of Zhejiang Hisun Pharmaceutical by Product, 2009-2013
Operating Revenue of Zhejiang Hisun Pharmaceutical by Region, 2009-2013
R&D Costs and % of Revenue of Zhejiang Hisun Pharmaceutical, 2010-2013
Revenue and Net Income of Zhejiang Hisun Pharmaceutical, 2013-2016E
Revenue and Net Income of Zhejiang NHU Co., Ltd., 2009-2013
Operating Revenue of Zhejiang NHU Co., Ltd. by Product, 2010-2013
Operating Revenue of Zhejiang NHU Co., Ltd. by Region, 2010-2013
R&D Costs and % of Revenue of Zhejiang NHU Co., 2010-2014
Revenue and Net Income of Zhejiang NHU Co., 2013-2016E
Revenue and Net Income of Shandong Xinhua Pharmaceutical, 2009-2013
Operating Revenue of Shandong Xinhua Pharmaceutical by Product, 2010-2013
Main Products and % of Revenue of Shandong Xinhua Pharmaceutical, 2013
Revenue and Net Income of Shandong Xinhua Pharmaceutical, 2013-2016E
Revenue and Net Income of Shenzhen Hepalink Pharmaceutical, 2009-2013
Operating Revenue of Shenzhen Hepalink Pharmaceutical by Product, 2009-2013
Operating Revenue of Shenzhen Hepalink Pharmaceutical by Region, 2009-2013
R&D Costs and % of Revenue of Shenzhen Hepalink Pharmaceutical, 2009-2013
Revenue and Net Income of Zhejiang Xianju Pharmaceutical, 2009-2013
Operating Revenue of Zhejiang Xianju Pharmaceutical by Product, 2009-2013
Operating Revenue of Zhejiang Xianju Pharmaceutical by Region, 2009-2013
R&D Costs and % of Revenue of Zhejiang Xianju Pharmaceutical, 2010-2013
Revenue and Net Income of Zhejiang Xianju Pharmaceutical, 2013-2016E
Revenue and Net Income of Zhejiang Huahai Pharmaceutical, 2009-2013
Revenue of Zhejiang Huahai Pharmaceutical by Product, 2009-2013
Revenue of Zhejiang Huahai Pharmaceutical by Region, 2010-2013
R&D Costs and % of Revenue of Zhejiang Huahai Pharmaceutical, 2011-2013
Revenue and Net Income of Zhejiang Huahai Pharmaceutical, 2013-2016E
Revenue and Net Income of Tianjin Tianyao Pharmaceuticals, 2010-2013
Revenue of Tianjin Tianyao Pharmaceuticals by Product, 2010-2013
Revenue of Tianjin Tianyao Pharmaceuticals by Region, 2010-2013
R&D Costs and % of Revenue of Tianjin Tianyao Pharmaceuticals, 2013
Investment Projects of Tianjin Tianyao Pharmaceuticals, 2013
Revenue and Net Income of Tianjin Tianyao Pharmaceuticals, 2013-2016E
Revenue and Net Income of China Resources Double-Crane Pharmaceutical, 2010-2013
Revenue Structure of China Resources Double-Crane Pharmaceutical by Sector, 2010-2013
Gross Margin of China Resources Double-Crane Pharmaceutical by Product, 2013
Revenue of China Resources Double-Crane Pharmaceutical by Region, 2010-2013
Construction Projects Invested by China Resources Double-Crane Pharmaceutical, 2013
R&D Expenditure Structure of China Resources Double-Crane Pharmaceutical, 2013
Revenue and Net Income of China Resources Double-Crane Pharmaceutical, 2013-2016E
Revenue and Net Income of Jiangsu Hengrui Medicine, 2010-2013
Operating Revenue of Jiangsu Hengrui Medicine by Product, 2010-2013
R&D Expenditure of Jiangsu Hengrui Medicine, 2013
Progress of Investment Projects of Jiangsu Hengrui Medicine as of 2013
Revenue and Net Income of Jiangsu Hengrui Medicine, 2013-2016E
Revenue and Net Income of Harbin Pharm. Group Sanjing Pharmaceutical Shareholding, 2010-2013
Operating Revenue of Harbin Pharm. Group Sanjing Pharmaceutical Shareholding by Product, 2010-2013
R&D Expenditure of Harbin Pharm. Group Sanjing Pharmaceutical Shareholding, 2013
Revenue and Net Income of Xizang Haisco Pharmaceutical, 2010-2013
Revenue and Gross Margin of Xizang Haisco Pharmaceutical by Product, 2013
Revenue of Xizang Haisco Pharmaceutical by Region, 2010-2013
Investment Projects of Xizang Haisco Pharmaceutical, 2013
R&D Expenditure of Xizang Haisco Pharmaceutical, 2010-2013
Revenue and Net Income of Xizang Haisco Pharmaceutical, 2013-2016E
Revenue and Net Income of Livzon Pharmaceutical Group, 2008-2013
Operating Revenue of Livzon Pharmaceutical Group by Product, 2008-2013
Operating Revenue of Livzon Pharmaceutical Group by Region, 2008-2013
Revenue and Net Income of Livzon Pharmaceutical Group, 2013-2016E
Revenue and Net Income of Shanghai Fosun Pharmaceutical, 2008-2013
Operating Revenue of Shanghai Fosun Pharmaceutical by Product, 2008-2013
Operating Revenue of Shanghai Fosun Pharmaceutical by Region, 2008-2013
R&D Costs and % of Revenue of Shanghai Fosun Pharmaceutical, 2008-2013
Revenue and Net Income of Shanghai Fosun Pharmaceutical, 2013-2016E
Revenue and Net Income of Jiangsu Nhwa Pharmaceutical, 2009-2013
Revenue of Jiangsu Nhwa Pharmaceutical by Product, 2009-2013
R&D Costs and % of Revenue of Jiangsu Nhwa Pharmaceutical, 2010-2013
Revenue and Net Income of Jiangsu Nhwa Pharmaceutical, 2013-2016E
Revenue and Net Income of Hainan Haiyao, 2009-2013
Operating Revenue of Hainan Haiyao by Product, 2009-2013
R&D Costs and % of Revenue of Hainan Haiyao, 2011-2013
Revenue and Net Income of Hainan Haiyao, 2013-2016E
Revenue and Net Income of Huaren Pharmaceutical, 2010-2013
Revenue of Huaren Pharmaceutical by Product, 2010-2013
Gross Margin of Huaren Pharmaceutical by Product, 2010-2013
Revenue of Huaren Pharmaceutical by Region, 2013
Investment Projects of Huaren Pharmaceutical, 2013
Mergers and Acquisitions Conducted by Huaren Pharmaceutical, 2013
R&D Expenditure of Huaren Pharmaceutical, 2011-2013
Revenue and Net Income of Huaren Pharmaceutical, 2013-2016E
Revenue and Net Income of Humanwell Healthcare, 2010-2013
Revenue and Gross Margin of Humanwell Healthcare by Product, 2013
Revenue of Humanwell Healthcare by Region, 2010-2013
Project Investment of Humanwell Healthcare, 2013
Equity Investment of Humanwell Healthcare, 2013
Revenue and Net Income of Humanwell Healthcare, 2013-2016E
Number of People Aged 65 and Over and Percentage of Total Population, 2004-2013
Revenue of Chemical Preparations and Chemical APIs in China, 2010-2016E
Gross Margin of Chemical Preparations and Chemical APIs in China, 2010-2016E
Revenue and Main Products of Key Chemical APIs Companies in China, 2013
Revenue of Key Chemical Preparations Companies in China, 2013
如果这份报告不能满足您的要求,我们还可以为您定制报告,请 留言说明您的详细需求。
|