|
|
|
报告导航:研究报告—
TMT产业—电子半导体
|
|
2013-2014年全球及中国LED行业研究报告 |
 |
字数:3.1万 |
页数:153 |
图表数:132 |
|
中文电子版:8500元 |
中文纸版:4250元 |
中文(电子+纸)版:9000元 |
|
英文电子版:2600美元 |
英文纸版:2800美元 |
英文(电子+纸)版:2900美元 |
|
编号:ZYW174
|
发布日期:2014-06 |
附件:下载 |
 |
|
|
《2013-2014年全球及中国LED行业研究报告》主要包含以下内容:
1、LED下游市场分析
2、LED封装趋势
3、蓝宝石晶棒Sapphire Ingots产业与市场
4、LED产业分析
5、39家LED厂家研究
LED产业链可以分为Die(L0)、Package(L1)、Carrier(L2)、Module(L3)、Lump(L4)、System(L5)六个层级,本报告重点研究Die(L0)和Package(L1)级。
经历2011和2012两年的衰退后,LED在2013年迎来好转,2013年Die(L0)和Package(L1)级LED市场规模大约为151.88亿美元,比2012年增长8.3%。预计2014年LED市场继续好转,市场规模达165.62亿美元,比2013年增长9.0%。预计2015年LED市场增速放缓,因为市场可能面临供应过剩和新一轮价格战。
全球LED产业可以分为四大地区,一是欧美地区,以通用照明为主攻方向,强调产品的高可靠性和高亮度。二是日本地区,技术最为全面,无论是通用照明还是背光显示都具备最强实力。发展方向兼顾通用照明、汽车、手机和电视。三是韩国和台湾地区,以笔记本电脑显示屏背光、LED-TV背光和手机背光为主攻方向,出货量大、单价低、毛利低。四是中国大陆,以AlInGaP为主,主攻户外显示屏、广告屏、信号灯领域,这些应用对产品技术要求低,可靠性要求低,客户分散,单价低。
从2011年起中国大陆企业大量进入LED行业,给行业造成很大的心理压力。实际上,包括LED 龙头企业三安光电在内,中国大陆没有任何一个厂家能够生产白光LED颗粒(Chip),也不掌握白光LED颗粒专利。中国大陆所有白光LED颗粒都需要进口或者从外资企业购买。
目前大陆LED 企业的盈利主要靠地方政府补贴,2010-2013年地方政府在LED 领域的补贴巨大。如德豪润达,2010-2013年分别得到2.70、3.11、2.24、3.15亿人民币的补贴。而该公司2013年净利润仅460万人民币,如果没有这些补贴,该公司一直处于严重亏损状态。再例如三安光电,2014年,厦门政府为了从芜湖政府那里把三安光电拉回厦门,给出了40亿人民币的巨额补贴。
中国大陆LED下游企业众多,这些企业规模小,同质化严重,价格战激烈,同时无法获得政府补贴,也无法在股市融资,预计2014年中国大陆将有不少LED下游企业倒闭。
从2013年开始LED行业的发展主要集中在封装领域,今后LED成本的削减主要还是依靠封装而不是Epitaxy。封装占LED Chip成本超过50%。目前COB封装和Flip Chip封装是最有前途的封装方式,也是未来的发展方向。
COB在路灯领域优势最为明显,在大功率通用照明领域优势也比较明显,但在考虑体积的领域,如电视BLU,则不如FLIP-CHIP优势明显。此外,FLIP-CHIP成本优势更明显。从成本和应用角度来看,COB成为将来灯具化设计的主流方向。
FLIP-CHIP最早出现在2008年,2012年初成熟,其最大优势是无需Wirebond,可以直接进入SMT生产线,无需再单独焊接,可以通过高电流,体积比较小。预估市场规模将由2013年的15亿美元快速成长,至2017年规模将达55亿美元。在BLU领域,FLIP-CHIP会成为主流。
2014年之前,LED成本削减压力集中在Epitaxy领域,Epitaxy厂家因此利润大幅度下滑,有不少企业因亏损而退出,行业洗牌基本结束。2014年后,成本削减压力开始向封装厂转移,技术能力差的恐怕利润将会出现下滑。
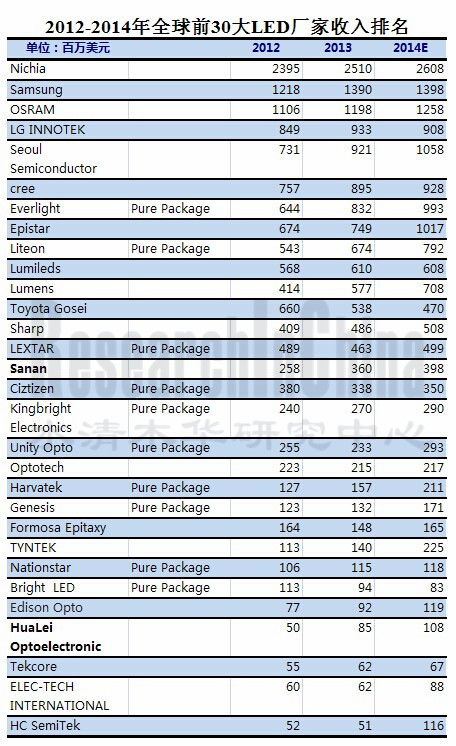
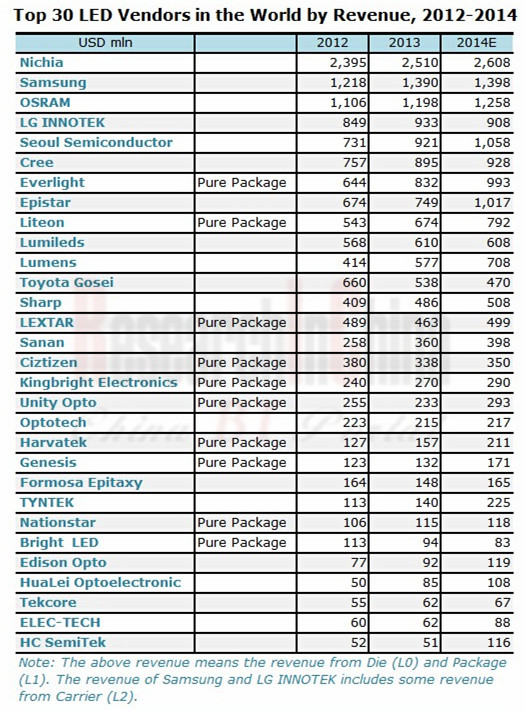
注:以上为 Die(L0)和Package(L1)级收入统计,三星和LG INNOTEK包含部分Carrier(L2)收入。
Global and China LED Industry Report, 2013-2014 mainly includes the following:
1, LED downstream market
2, Trends of LED packaging
3, Sapphire Ingot Industry and Market
4, LED industry
5,39 LED vendors
The LED industry chain consists of six levels: Die (L0), Package (L1), Carrier (L2), Module (L3), Lump (L4) and System (L5). Herein, Die (L0) and Package ( L1) are two focuses.
After the recession in 2011 and 2012, LED saw a turning point in 2013 when Die (L0) and Package (L1) LED market size hit about USD15,188 million, a rise of 8.3% from 2012. In 2014, the LED market will continue to recover with the market size of USD16.562 billion (up 9.0% from 2013). However, the market is expected to slow down in 2015 because oversupply and a new round of price wars may arise.
The global LED industry can be divided into four clusters. First, Europe and America underline general lighting with an emphasis on high reliability and high brightness. Second, Japan embodies the most comprehensive technology, performing outstandingly in both of general lighting and backlight display. Besides, it also targets general lighting, automobiles, mobile phones and TV. Third, South Korea and Taiwan targets laptop display backlight, LED-TV backlight and mobile phone backlight with large shipment, low unit price and low margin. Last, Mainland China centers AlInGaP, outdoor display, advertising screen and signal lights which require low technology and reliability; and in these fields, customers are scattered and the unit price is low.
From 2011 onwards, a large number of Mainland Chinese enterprises have entered the LED industry, causing panic. In reality, none of Mainland Chinese enterprises (including the giant Sanan Optoelectronics) is capable of producing white LED chips or grasping the related patents. Therefore, Mainland China has to import or purchase all needed white LED chips from foreign companies.
Mainland Chinese LED enterprises rely on local governmental subsidies which were huge in 2010-2013. For example, Elec-Tech International was subsidized with RMB270 million in 2010, RMB311 million in 2011, RMB224 million in 2012 and RMB315 million in 2013; but, the net income of the company was only RMB4.6 million in 2013. Without these subsidies, the company might be in a serious loss. Sanan Optoelectronics obtains RMB4 billion from Xiamen’s government in 2014, because Xiamen is eager to make the company return to Xiamen from Wuhu.
Numerous Mainland Chinese LED downstream enterprises are featured with small scale, severe homogenization and intense price war. They cannot get governmental subsidies or conduct financing in the stock market. In 2014, many of them may go bankrupt.
Since 2013, the development of the LED industry has been mainly reflected in the packaging field. In the future, the LED cost reduction depends on packaging instead of Epitaxy. Packaging costs over 50% of the LED chip cost. Currently, COB packaging and Flip chip packaging are not only the most promising, but also represent the future direction.
COB performs strikingly in the field of street lighting and high-power general lighting. But, it is inferior to FLIP-CHIP in the fields where volume is emphasized, such as TV BLU. In addition, FLIP-CHIP’s cost advantage is more obvious. From the perspective of cost and application, COB will become the future mainstream of lighting design.
FLIP-CHIP made its debut in 2008, and became mature in early 2012. Its biggest advantage lies in: it can go to SMT production lines directly under high current without Wirebond and hand welding; besides, its size is small. The market size is estimated to jump from USD1.5 billion in 2013 to USD5.5 billion in 2017. In the BLU field, FLIP-CHIP will become the mainstream.
Prior to 2014, LED cost cutting concentrated in the Epitaxy field, so that Epitaxy vendors witnessed a sharp decline in profits, even many of them exited from the industry due to losses. After 2014, packaging factories will suffer the cost-cutting pressure, so some of them with poor technical capabilities may see descending profit.
第一章、LED市场
1.1、LED市场规模
1.2、LED照明市场规模
1.3、LED照明市场趋势
1.4、日本LED照明市场
1.5、北美LED照明市场
1.6、大尺寸BLU用LED市场
1.7、手机BLU市场
1.8、LED汽车照明
1.8.1、LED汽车照明市场
1.8.2、汽车内饰(INTERIOR)LED 照明
1.8.3、汽车外饰LED照明
1.9、数字广告牌市场
第二章、LED封装
2.1、LED封装简介
2.2、COB封装
2.3、FLIP-CHIP(覆晶或倒装)封装
2.3.1、FLIP-CHIP封装简介
2.4、中功率LED
2.5、LED封装尺寸趋势
第三章、LED产业链
3.1、LED产业链
3.2、蓝宝石晶棒市场
3.3、蓝宝石晶棒产业
3.4、蓝宝石基板
3.5、RUBICON
3.6、MOCVD产业
3.7、AIXTRON
3.8、VEECO
3.9、LED产业地域分布
3.10、 2012-2014年全球前30大LED厂家收入排名
3.11、台湾LED产业
3.12、2013年中国大陆LED产业总结
3.13、2014年中国LED产业预测
3.14、白光LED 专利
第四章、台湾LED厂家研究
4.1、亿光
4.2、晶元光电
4.3、新世纪光电
4.4、华上光电
4.5、璨圆光电
4.6、光宝
4.7、佰鸿
4.8、光磊
4.9、宏齐
4.10、泰谷
4.11、东贝
4.12、广镓
4.13、隆达
4.14、鼎元光电
4.15、艾笛森
第五章 中国大陆LED厂商研究
5.1、上海蓝光
5.2、华磊光电
5.3、士兰明芯
5.4、三安光电
5.5、南通同方半导体
5.6、浪潮华光
5.7、国星光电
5.8、上海蓝宝
5.9、大连路美
5.10、干照光电
5.11、德润豪达
5.12、真明丽
5.13、华灿光电
第六章、海外LED厂商研究
6.1、CREE
6.2、丰田合成
6.3、日亚化学
6.4、OSRAM OPTO SEMICONDUCTOR
6.5、LUMILEDS(PHILIPS)
6.6、首尔半导体
6.7、LG INNOTEK
6.8、三星LED
6.9、Lumens
1. LED Market
1.1 LED Market Size
1.2 LED Lighting Market Size
1.3 LED Lighting Market Trend
1.4 Japan’s LED Lighting Market
1.5 North America’s LED Lighting Market
1.6 LED for Large-size BLU Market
1.7 Mobile Phone BLU Market
1.8 LED Automotive Lighting
1.8.1 LED Automotive Lighting Market
1.8.2 Automotive Interior LED Lighting
1.8.3 Automotive Exterior LED Lighting
1.9 Digital Billboard Market
2. LED Packaging
2.1 Overview of LED Packaging
2.2 COB Packaging
2.3 Flip Chip Packaging
2.3.1 Overview of Flip Chip Packaging
2.4 Medium Power LED
2.5 Trend of LED Packaging Size
3. LED Industry Chain
3.1 LED Industry Chain
3.2 Sapphire Ingot Market
3.3 Sapphire Ingot Industry
3.4 Sapphire Substrate
3.5 Rubicon
3.6 MOCVD Industry
3.7 AIXTRON
3.8 VEECO
3.9 Geographical Distribution of LED Industry
3.10 Global Top 30 LED Vendors by Revenue, 2012-2014
3.11 Taiwan LED Industry
3.12 Summary of Mainland China LED Industry in 2013
3.13 Forecast for China LED Industry in 2014
3.14 White Light LED Patents
4. Taiwanese LED Companies
4.1 Everlight Electronics Co., Ltd.
4.2 Epistar Corporation
4.3 Genesis Photonics Inc.
4.4 Arima Optoelectronics Corp
4.5 Formosa Epitaxy Inc
4.6 Lite-On Technology Corporation
4.7 Bright LED Electronics Corp.
4.8 Opto Tech Corporation
4.9 Harvatek Corporation
4.10 Tekcore
4.11 Unity Opto Technology LTD.
4.12 Huga Optotech Inc.
4.13 Lextar Electronics Corporation
4.14 TYNTEK Corporation
4.15 Edison Opto Corp.
5. LED Companies in Mainland China
5.1 Epiligh Technology Co., Ltd.
5.2 Hunan HuaLei Optoelectronic Corporation
5.3 Hangzhou Silan Azure Co., Ltd.
5.4 Sanan Optoelectronics Co., Ltd.
5.5 Nantong Tongfang Semiconductor Co., Ltd.
5.6 Shandong Inspur Huaguang Optoelectonics Co., Ltd.
5.7 Foshan Nationstar Optoelectronics Co. Ltd.
5.8 Shanghai Rainbow Optoelectronics Material Co. Ltd.
5.9 Dalian Lumei Optoelectronics Corporation
5.10 Xiamen Changelight Co., Ltd.
5.11 Elec-tech International Co., Ltd.
5.12 Neo-Neon Holdings Ltd.
5.13 HC SemiTek Corporation
6. Foreign LED Companies
6.1 Cree Inc.
6.2 Toyoda Gosei Co., Ltd.
6.3 Nichia Corporation
6.4 OSRAM Opto Semiconductor
6.5 Philips Lumileds Lighting Company
6.6 Seoul Semiconductor Co., Ltd.
6.7 LG Innotek Ltd.
6.8 Samsung LED
6.9 Lumens Digital Optics Inc.
2008-2016年全球LED市场规模
2013-2018年LED市场规模下游分布
2009-2017年全球照明市场技术分布
2011-2016年LED 照明芯片数量(分应用领域)
各个国家的照明节能政策
2012年5月-2014年1月40W 和 60W LED light bulbs价格走势
2012-2014年日本LED Bulb 平均单价
2012-2014年日本Bulbs 销售增长率
2013年日本LED照明市场主要厂家市场占有率
2009-2015年BLU大尺寸应用比例
2007-2014年全球手机出货量
2011-2014年全球3G/4G手机出货量地域分布
2013年全球智能手机各大品牌销量
2013年全球各大操作系统智能手机销量
2013年全球各手机品牌销量
2010-2016年全球LED汽车照明市场规模
2007-2014年五种汽车光源成本与光照度发展趋势
LED结构
LED成本分析
COB封装
2012-2016年蓝宝石晶棒需求量预测
2012-2016 2012-2016年蓝宝石晶棒需求金额预测
2012-2016年全球主要蓝宝石晶棒厂家产能趋势
2012-2016年蓝宝石晶棒价格预测(分尺寸)
2012-2016年各国/地区蓝宝石基板需求
2012-2016年蓝宝石基板需求(分尺寸)
2005-2014年Rubicon收入与运营利润率
Rubicon Technology生产流程
2009-2013年Rubicon 收入地域分布
2009-2013年Rubicon 收入产品分布
2009-2017年LED前端设备市场规模
1999-2013年MOCVD主要厂家市场占有率
AIXTRON全球分布
2003-2014年AIXTRON收入与EBIT率
AIXTRON 季度收入\新订单\在手订单
2010年AIXTRON收入应用分布、地域分布
2014年1季度AIXTRON 分地区和应用领域收入
1999-2013年AIXTRON收入下游应用分布
2004-2014年VEECO收入与运营利润率
2011-2013年VEECO收入业务分布
VEECO主要客户
2013、2014年全球LED 产值地域分布
台湾LED企业关系图
台湾LED 厂家2012-2014年营业利润率
EVERLIGHT(亿光电子)组织结构
2003-2014年EVERLIGHT(亿光电子)收入与运营利润率
2008-2011年EVERLIGHT(亿光电子)收入产品分布
2012-2015年EVERLIGHT(亿光电子)收入产品分布
2005-2015年EVERLIGHT(亿光电子)收入下游应用分布
2013-2014年EVERLIGHT(亿光电子)产能与产能利用率
2012年4月-2014年4月亿光月度收入与增幅
2004-2011年亿光产能
晶元光电组织结构
2004-2014年晶元光电收入与运营利润率
2012年4月-2014年4月晶元光电月度收入与增幅
2012-2015年EPISTAR 产品应用领域销售分布
2012-2015年EPISTAR 产品销售分布
2010-2012年晶元光电收入产品分布
2012年EPISTAR 销售分布(分客户)
2003-2014年新世纪光电收入与毛利率
2002-2012年华上光电收入与毛利率
2010年5月-2012年5月华上光电月度收入与增幅
2002-2014年璨圆光电收入与运营利润率
2012年4月-2014年4月璨圆光电月度收入与增幅
2009-2013年璨圆光电收入产品分布
2012-2013年璨圆光电产能
2012年4月-2014年4月佰鸿工业月度收入与增幅
2004-2014年光磊收入与毛利率
2012年4月-2014年4月光磊月度收入
2008-2013年光磊收入产品分布
2013-Q1/2014年光磊系统产品除外收入地域分布
2013-Q1/2014年光磊系统产品收入地域分布
2000-2014年宏齐收入与运营利润率
2012年4月-2014年4月宏齐月度收入
2005-2014年泰谷收入与毛利率统计及预测
2012年4月-2014年4月泰谷月度收入与增幅
2004-2014年东贝收入与运营利润率
2012年4月-2014年4月东贝月度收入与增幅
2004-2012年广稼收入与运营利润统计
2010年5月-2012年5月广稼月度收入与增幅
2009-2014年隆达电子收入与运营利润率
2012年4月-2014年4月隆达月度收入与增幅
Tyntek 组织机构
2004-2014年鼎元光电收入与运营利润率
2012年4月-2014年4月鼎元光电月度收入与增幅
2006-2014年艾笛森收入与运营利润率
2012年4月-2014年4月艾笛森月度收入与增幅
2008-2012年上海市蓝光科技收入与净利润
2006-2014年士兰微电子收入与运营利润率
2007-2011年士兰明芯收入与净利润
2005-2010年三安光电收入与毛利率
2009-2012年三安光电收入业务分布
三安光电各子公司2013年收入与净利润
2007-2014年国星光电收入与运营利润率
2007-2013年国星光电收入产品分布
2013年国星光电前5大客户
2013年国星光电前5大供应商
2004-2013年AXT收入与运营利润率
2006-2013年AXT收入产品分布
2006-2013年AXT收入地域分布
2007-2014年干照光电收入与运营利润
2010-2013年干照光电Epitaxy收入与毛利率
2013年干照光电主要子公司财务数据
2013年德豪润达主要子公司财务数据
2006-2014财年真明丽收入与毛利率
2009-2013财年真明丽收入产品分布
2012-2013财年真明丽收入地域分布
2009-2014年华灿光电收入与运营利润
2004-2014财年CREE收入与运营利润率
FY2011-FY2014 CREE收入产品分布
FY2011-FY2014 CREE 产品毛利率
CREE全球分布
2009-2013财年CREE收入地域分布
2008-2015财年丰田合成 收入与运营利润率
2008-2015财年丰田合成LED业务收入与运营利润率
2003-2014年日亚化学收入与运营利润率
2004-2013年日亚化学LED部门收入与运营利润率
2012年1季度-2014年1季度OSRAM季度收入与EBITA Margin
2012-2014年OSRAM收入部门分布
2012-2014年OSRAM EBITA部门分布
2012-2014年OSRAM收入地域分布
2011年4季度-2013年4季度飞利浦照明收入与EBITDA
2013年飞利浦照明收入业务分布
2013年飞利浦照明收入应用分布
2013年飞利浦照明收入地域分布
首尔半导体产品分布
2003-2014年Seoul Semiconductor收入与运营利润率
2011年1季度-2014年1季度Seoul Semiconductor季度毛利率
2011年1季度-2014年1季度Seoul Semiconductor季度营业利润率
2011年1季度-2014年1季度首尔半导体收入下游应用分布
2006-2014年LG INNOTEK收入与运营利润率
2011年1季度-2014年1季度LG INNOTEK收入与运营利润率
2011-2014年LG INNOTEK 收入业务分布
2011-2013年LG INNOTEK 运营利润业务分布
2011年4季度-2014年1季度LG INNOTEK LED业务季度收入
2005-2012年三星LED收入
2010年三星LED收入下游应用
2007-2014年LUMENS收入与EBITDA率
2012-2014年Lumens 销售分布(按应用领域)
Global LED Market Size, 2008-2016E
Distribution of LED Market Size by Application, 2013-2018E
Distribution of Global Lighting Market by Technology, 2009-2017E
LED Chips Volume of Lighting by Application, 2011-2016E
Polices of Various Countries on Lighting Energy Saving
Price Trend of 40W and 60W LED Light Bulbs, May, 2012-Jan. 2014
ASP of LED Bulb in Japan, 2012-2014
Bulbs Sales Growth Rate in Japan, 2012-2014
Market Share of Major Manufacturers in Japan’s LED Lighting Market, 2013
Proportion of Large-size Applications of BLU, 2009-2015E
Global Mobile Phone Shipments, 2007-2014
Geographical Distribution of Global 3G/4G Mobile Phone Shipments, 2011-2014
Global Smartphone Sales to End Users by Vendor in 2013
Global Smartphone Sales to End Users by Operating System in 2013
Global Mobile Phone Sales to End Users by Vendor in 2013
Global LED Automotive Lighting Market Size, 2010-2016E
Costs and Illuminance Trend of Five Automotive Light Sources, 2007-2014
LED Structure
LED Costs
COB Packaging
Sapphire Ingot Demand Volume, 2012-2016E
Sapphire Ingot Demand Value, 2012-2016E
Capacity Trend of Major Global Sapphire Ingot Companies, 2012-2016E
Sapphire Ingot Price by Size, 2012-2016E
Sapphire Substrate Demand by Country/Region, 2012-2016E
Sapphire Substrate Demand by Size, 2012-2016E
Revenue and Operating Margin of Rubicon Technology, 2005-2014
Production Flow of Rubicon Technology
Revenue of Rubicon Technology by Region, 2009-2013
Revenue of Rubicon Technology by Product, 2009-2013
Market Size of LED Front-end Equipment, 2009-2017E
Market Share of Major MOCVD Manufacturers,1999-2013
Global Distribution of Aixtron
Revenue and EBIT Margin of Aixtron, 2003-2014
Quarterly Revenue\New Order\Backlog of Aixtron
Revenue of Aixtron by Application and Region, 2010
Revenue of Aixtron by Application and Region, Q1 2014
Revenue of Aixtron by Application ,1999-2013
Revenue and Operating Margin of VEECO, 2004-2014
Revenue of VEECO by Business, 2011-2013
VEECO’s Main Customers
Distribution of Global LED Output Value by Region, 2013&2014
Taiwanese LED Enterprise Relationship Graph
Operating Margin of Taiwanese LED Companies, 2012-2014
Organizational Structure of Everlight Electronics
Revenue and Operating Margin of Everlight Electronics, 2003-2014
Revenue of Everlight Electronics by Product, 2008-2011
Revenue of Everlight Electronics by Product, 2012-2015E
Revenue of Everlight Electronics by Application, 2005-2015E
Capacity and Utilization Rate of Everlight Electronics, 2013-2014
Monthly Revenue and Growth Rate of Everlight Electronics, Apr. 2012-Apr. 2014
Capacity of Everlight Electronics, 2004-2011
Organizational Structure of Epistar
Revenue and Operating Margin of Epistar, 2004-2014
Monthly Revenue and Growth Rate of Epistar, Apr. 2012-Apr. 2014
Sales of Epistar by Application, 2012-2015E
Sales of Epistar by Product, 2012-2015E
Revenue of Epistar by Product, 2010-2012
Sales of Epistar by Customer, 2012
Revenue and Gross Margin of Genesis Photonics, 2003-2014
Revenue and Gross Margin of Arima Optoelectronics, 2002-2012
Monthly Revenue and Growth Rate of Arima Optoelectronics, May 2010-May 2012
Revenue and Operating Margin of Formosa Epitaxy, 2002-2014
Monthly Revenue and Growth Rate of Formosa Epitaxy, Apr. 2012-Apr. 2014
Revenue of Formosa Epitaxy by Product, 2009-2013
Capacity of Formosa Epitaxy, 2012-2013
Monthly Revenue and Growth Rate of Bright LED Electronics, Apr. 2012-Apr. 2014
Revenue and Gross Margin of Opto Tech, 2004-2014
Monthly Revenue of Opto Tech, Apr. 2012-Apr. 2014
Revenue of Opto Tech by Product, 2008-2013
Revenue of Opto Tech Except System Products by Region, 2013-Q1/2014
Revenue from System Products of Opto Tech, 2013-Q1/2014
Revenue and Operating Margin of Harvatek, 2000-2014
Monthly Revenue of Harvatek, Apr. 2012-Apr. 2014
Revenue and Gross Margin Statistics and Forecast of Tekcore, 2005-2014
Monthly Revenue and Growth Rate of Tekcore, Apr. 2012-Apr. 2014
Revenue and Operating Margin of Unity Opto, 2004-2014
Monthly Revenue and Growth Rate of Unity Opto, Apr. 2012-Apr. 2014
Revenue and Operating Profit of Huga Optotech, 2004-2012
Monthly Revenue and Growth Rate of Huga Optotech, May 2010-May 2012
Revenue and Operating Margin of Lextar Electronics, 2009-2014
Monthly Revenue and Growth Rate of Lextar Electronics, Apr. 2012-Apr. 2014
Organizational Structure of Tyntek
Revenue and Operating Margin of Tyntek, 2004-2014
Monthly Revenue and Growth Rate of Tyntek, Apr. 2012-Apr. 2014
Revenue and Operating Margin of Edison Opto, 2006-2014
Monthly Revenue and Growth Rate of Edison Opto, Apr. 2012-Apr. 2014
Revenue and Net Income of Epiligh Technology, 2008-2012
Revenue and Operating Margin of Silan Microelectronics, 2006-2014
Revenue and Net Income of Silan Azure, 2007-2011
Revenue and Gross Margin of Sanan Optoelectronics, 2005-2010
Revenue of Sanan Optoelectronics by Business, 2009-2012
Revenue and Net Income of Sanan Optoelectronics’ Subsidiaries, 2013
Revenue and Operating Margin of Nationstar Optoelectronics, 2007-2014
Revenue of Nationstar Optoelectronics by Product, 2007-2013
Top 5 Customers of Nationstar Optoelectronics, 2013
Top 5 Suppliers of Nationstar Optoelectronics, 2013
Revenue and Operating Margin of AXT, 2004-2013
Revenue of AXT by Product, 2006-2013
Revenue of AXT by Region, 2006-2013
Revenue and Operating Profit of Xiamen Changelight, 2007-2014
Revenue from Epitaxy of Xiamen Changelight, 2010-2013
Financial Data of Xiamen Changelight’s Key Subsidiaries, 2013
Financial Data of Elec-tech International’s Key Subsidiaries, 2013
Revenue and Gross Margin of Neo-Neon Holdings, FY2006-FY2014
Revenue of Neo-Neon Holdings by Product, FY2009-FY2013
Revenue of Neo-Neon Holdings by Region, FY2012-FY2013
Revenue and Operating Profit of HC SemiTek, 2009-2014
Revenue and Operating Margin of Cree, FY2004-FY2014
Revenue of Cree by Product, FY2011-FY2014
Product Gross Margin of Cree, FY2011-FY2014
Global Distribution of Cree
Revenue of Cree by Region, FY2009-FY2013
Revenue and Operating Margin of Toyoda Gosei, FY2008-FY2015
Revenue from and Operating Margin of LED Business of Toyoda Gosei, FY2008-FY2015
Revenue and Operating Margin of Nichia, 2003-2014
Revenue and Operating Margin of Nichia’s LED Division, 2004-2013
Quarterly Revenue and EBITA Margin of OSRAM, Q1 2012- Q1 2014
Revenue of OSRAM by Division, 2012-2014
EBITA of OSRAM by Division, 2012-2014
Revenue of OSRAM by Region, 2012-2014
Revenue and EBITDA of Philips Lumileds Lighting, Q4 2011-Q4 2013
Revenue of Philips Lumileds Lighting by Business, 2013
Revenue of Philips Lumileds Lighting by Application, 2013
Revenue of Philips Lumileds Lighting by Region, 2013
Product Distribution of Seoul Semiconductor
Revenue and Operating Margin of Seoul Semiconductor, 2003-2014
Quarterly Gross Margin of Seoul Semiconductor, Q1 2011- Q1 2014
Quarterly Operating Margin of Seoul Semiconductor, Q1 2011- Q1 2014
Revenue of Seoul Semiconductor by Application, Q1 2011- Q1 2014
Revenue and Operating Margin of LG Innotek, 2006-2014
Revenue and Operating Margin of LG Innotek, Q1 2011- Q1 2014
Revenue of LG Innotek by Business, 2011-2014
Operating Profit of LG Innotek by Business, 2011-2013
Quarterly Revenue from LED Business of LG Innotek, Q4 2011- Q1 2014
Revenue of Samsung LED, 2005-2012
Revenue of Samsung LED by Application, 2010
Revenue and EBITDA Margin of Lumens Digital Optics, 2007-2014
Sales of Lumens Digital Optics by Application, 2012-2014
如果这份报告不能满足您的要求,我们还可以为您定制报告,请 留言说明您的详细需求。
|