|
|
|
报告导航:研究报告—
制造业—化工
|
|
2013-2016年全球及中国丙烯酸及酯行业研究报告 |
 |
字数:2.8万 |
页数:118 |
图表数:137 |
|
中文电子版:8500元 |
中文纸版:4250元 |
中文(电子+纸)版:9000元 |
|
英文电子版:2450美元 |
英文纸版:2600美元 |
英文(电子+纸)版:2750美元 |
|
编号:CYH028
|
发布日期:2014-06 |
附件:下载 |
 |
|
|
丙烯酸及酯(Acrylic Acid & Esters)是丙烯酸及丙烯酸酯类的总称;其中丙烯酸酯类主要以通用丙烯酸酯为主,包括丙烯酸甲酯(MA)、丙烯酸乙酯(EA)、丙烯酸丁酯(BA)和丙烯酸辛酯(EHA)等。
受化工行业疲软等影响,2013年全球酯化级丙烯酸和通用丙烯酸酯产能增幅均略有下降,同比增幅分别达5.7%和5.8%,分别较2012年下降5.9个百分点和13.9个百分点。
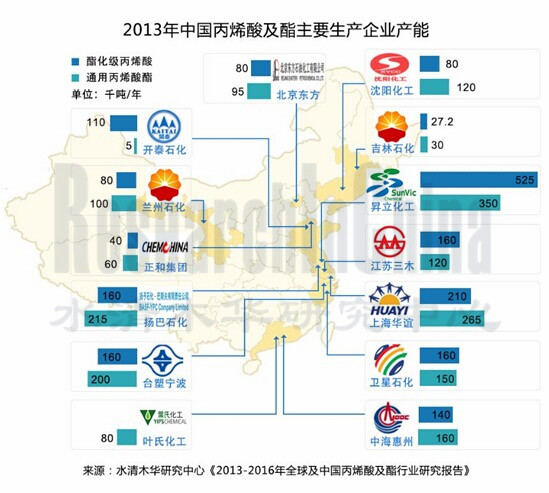
中国是全球最大的丙烯酸及酯生产国,2013年其酯化级丙烯酸和通用丙烯酸酯产能分别占全球的30.8%(193.2万吨/年)和32.3%(195.0万吨/年)。预计至2016年底,中国酯化级丙烯酸和通用丙烯酸酯产能分别有望达352万吨/年和373万吨/年。
高吸水性树脂(SAP)、涂料油漆及胶粘剂等是中国丙烯酸及酯主要下游市场,2013年这两者合计需求量占中国丙烯酸及酯总需求量的68%。
水清木华研究中心《2013-2016年全球及中国丙烯酸及酯行业研究报告》着重研究了以下内容:
 全球丙烯酸及酯市场供需、竞争格局及地区结构等; 全球丙烯酸及酯市场供需、竞争格局及地区结构等;
中国丙烯酸及酯市场供需、进出口、竞争格局及价格等;
丙烯、高吸水性树脂、涂料及胶粘剂等丙烯酸及酯上下游产品发展情况等;
巴斯夫、陶氏化学、阿科玛等4家全球丙烯酸及酯企业经营情况及在华发展等;
昇立化工、上海华谊、卫星石化等8家中国丙烯酸及酯企业经营情况及发展战略等。
巴斯夫:全球最大的丙烯酸及酯生产企业,2013年其酯化级丙烯酸和通用丙烯酸酯产能分别占全球的19.0%和20.8%。2014年5月,巴斯夫在中国南京新建16万吨/年的丙烯酸项目投产;并正在巴西新建16万吨/年的丙烯酸项目(计划于2014年底投产)。预计2014年底,巴斯夫丙烯酸产能有望达到151万吨/年。
阿科玛:全球第三大丙烯酸及酯生产企业。2014年,阿科玛与中国丙烯酸龙头企业昇立化工宣布组建合资企业——昇科(由阿科玛控股),并将昇立化工泰兴丙烯酸生产基地归入昇科旗下。泰兴生产基地第三条年产能16万吨的丙烯酸生产线预计于2015年第一季度投产,届时,阿科玛在中国将具备32万吨/年的丙烯酸生产能力。
昇立化工:中国最大的丙烯酸及酯生产企业,2013年其酯化级丙烯酸和通用丙烯酸酯产能分别占中国市场的27.2%和17.9%。
上海华谊:中国第二大酯化级丙烯酸和通用丙烯酸酯生产企业,2013年其产能分别达21万吨/年和26.5万吨/年。2014年,公司正在积极推进上海化工区32万吨/年丙烯酸及酯项目的建设。该项目分两期进行,其中一期丙烯酸及酯项目(含16万吨/年丙烯酸装置、16万吨/年丙烯酸丁酯、8.4万吨/年冰晶型丙烯酸和3.33万吨/年高吸水性树脂)已于2013年10月底开工,计划2015年投产。
Acrylic acid & esters is the general term for acrylic acid (AA) and acrylic esters (AE), wherein, AE mainly refers to common acrylic esters (CAE), inclusive of methyl acrylate (MA), ethyl acrylate (EA), butyl acrylate (BA), ethyl hexyl acrylate (EHA), etc..
Impacted by the weak chemical industry and other factors, the global capacity of both crude acrylic acid (CAA) and common acrylic esters (CAE) presented a downward trend in 2013, with year-on-year growth rates up to 5.7% and 5.8%, which fell by 5.9 percentage points and 13.9 percentage points from 2012, respectively.
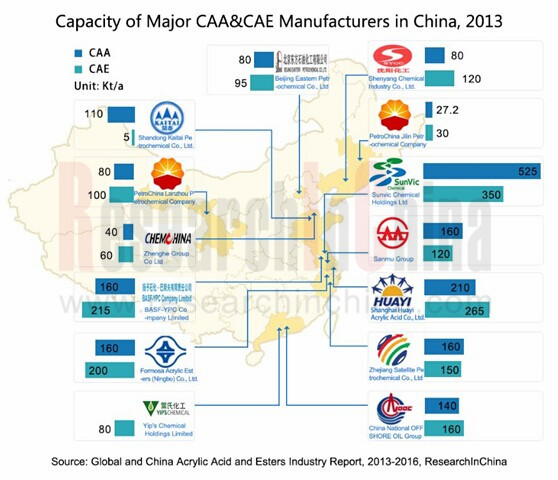
As the world's largest producer of AA & AE, China contributed 30.8% (1,932 kt/a) and 32.3% (1,950 kt/a) to the global CAA and CAE capacity respectively in 2013. It is expected that by the end of 2016, its CAA and CAE capacities are expected to reach 3,520 kt/a and 3,730 kt/a, separately.
Super absorbent polymer (SAP), paint and adhesive are major downstream markets for AA & AE in China. In 2013, 68% of China’s aggregate demand for AA & AE came from them.
The report mainly covers the followings:
Supply & demand, competitive landscape, geographical distribution, etc. of the global AA & AE industry;
Supply & demand, import & export, competition pattern, prices, etc. of Chinese AA & AE industry;
Development of propylene, SAP, paint and adhesives;
Operation and development in China of four global AA & AE enterprises such as BASF, Dow Chemical and Arkema;
Operation and development strategies of eight Chinese AA & AE enterprises including SunVic Chemical Holdings Limited, Shanghai Huayi Acrylic Acid Co., Ltd. and Zhejiang Satellite Petrochemical Co., Ltd.
BASF: The largest AA & AE manufacturer in the world contributed 19.0% and 20.8% of the global CAA and CAE capacity respectively in 2013. In May 2014, BASF's new 160 kt/a Acrylic Acid Project in Nanjing, China went into operation. Meanwhile, it is working on the 160 kt/a Acrylic Acid Project (scheduled to be put into operation at the end of 2014) in Brazil. By the end of 2014, BASF’s acrylic acid capacity is expected to attain 1,510 kt/a.
Arkema: As the world's third-largest AA & AE manufacturer, Arkema in 2014 announced that it would cooperate with the Chinese acrylic acid giant – SunVic Chemical to establish a joint venture dubbed Sunke (controlled by Arkema), which was to take over SunVic Chemical's acrylic acid production base in Taixing. The third 160 kt/a acrylic acid production line of Taixing Base is scheduled to go into operation in the first quarter of 2015, by then Arkema will boast acrylic acid capacity of 320 kt/a in China.
SunVic Chemical: The largest AA & AE manufacturer in China shared 27.2% and 17.9% of China’s CAA and CAE capacity respectively in 2013.
Shanghai Huayi Acrylic Acid: The second largest CAA & CAE manufacturer in China, with CAA & CAE capacities amounting to 210 kt/a and 265 kt/a in 2013, respectively. In 2014, the company is actively promoting its 320,000 tons/a AA & AE Project (located in Shanghai Chemical Industry Zone) which is implemented by two phases, of which, the Phase I Project (including 160 kt/a AA device, 160 kt/a BA, 84 kt/a GAA and 33.3 kt/a SAP) was commenced at the end of October 2013 and would go into operation in 2015 as planned.
第一章 丙烯酸及酯概述
1.1 定义
1.2 生产工艺
1.3 产业链
第二章 全球丙烯酸及酯市场
2.1 市场供给
2.2 市场需求
2.3 企业格局
2.3.1 酯化级丙烯酸
2.3.2 通用丙烯酸酯
2.4 地域分布
第三章 中国丙烯酸及酯市场
3.1 市场供给
3.1.1 产能
3.1.2 产量
3.2 市场需求
3.2.1 消费结构
3.2.2 消费量
3.3 进出口
3.4 竞争格局
3.5 市场价格
第四章 丙烯酸及酯上下游产业
4.1 丙烯
4.1.1 市场供给
4.1.2 市场需求
4.1.3 竞争格局
4.1.4 价格
4.1.5 发展趋势
4.2 高吸水性树脂(SAP)
4.2.1 市场供给
4.2.2 市场需求
4.2.3 竞争格局
4.2.4 发展趋势
4.3 涂料
4.3.1 市场供给
4.3.2 市场需求
4.3.3 发展趋势
4.4 胶粘剂
4.4.1 市场供给
4.4.2 市场需求
4.4.3 产品结构
4.4.4 竞争格局
4.4.5 发展趋势
第五章 全球重点企业
5.1 巴斯夫
5.1.1 企业简介
5.1.2 经营情况
5.1.3 营收构成
5.1.4 研发与投资
5.1.5 丙烯酸及酯业务
5.1.6 在华发展
5.2 陶氏化学
5.2.1 企业简介
5.2.2 经营情况
5.2.3 营收构成
5.2.4 毛利润
5.2.5 研发
5.2.6 丙烯酸及酯业务
5.2.7 在华发展
5.3 阿科玛
5.3.1 企业简介
5.3.2 经营情况
5.3.3 营收构成
5.3.4 研发与在建项目
5.3.5 丙烯酸及酯业务
5.3.6 在华发展
5.3.7 发展战略
5.4 日本触媒
5.4.1 企业简介
5.4.2 经营情况
5.4.3 营收构成
5.4.4 丙烯酸及酯相关业务
5.4.5 在华发展
5.4.6 发展战略
第六章 中国重点企业
6.1 台湾塑胶工业股份有限公司
6.1.1 企业简介
6.1.2 经营情况
6.1.3 营收构成
6.1.4 毛利润
6.1.5 研发
6.1.6 丙烯酸及酯业务
6.2 沈阳化工股份有限公司(000698)
6.2.1 企业简介
6.2.2 经营情况
6.2.3 营收构成
6.2.4 毛利率
6.2.5 研发与在建项目
6.2.6 丙烯酸及酯业务
6.2.7 发展前景
6.3 浙江卫星石化股份有限公司(002648)
6.3.1 企业简介
6.3.2 经营情况
6.3.3 营收构成
6.3.4 毛利率
6.3.5 研发与在建工程
6.3.6 丙烯酸及酯业务
6.3.7 发展前景
6.4 昇立化工控股有限公司(A7S)
6.4.1 企业简介
6.4.2 经营情况
6.4.3 营收构成
6.4.4 毛利润
6.4.5 丙烯酸及酯业务
6.4.6 发展前景
6.5 山东开泰石化股份有限公司
6.5.1 企业简介
6.5.2 经营情况
6.5.3 营收构成
6.5.4 在建项目
6.5.5 丙烯酸及酯业务
6.6 杨子石化-巴斯夫有限责任公司
6.6.1 公司简介
6.6.2 经营情况
6.6.3 丙烯酸及酯业务
6.7 上海华谊丙烯酸有限公司
6.7.1 企业简介
6.7.2 经营情况
6.7.3 丙烯酸及酯业务
6.7.4 丙烯酸及酯项目规划
6.8 北京东方石油化工有限公司
6.8.1 企业简介
6.8.2 丙烯酸及酯业务
第七章 结论与预测
7.1 结论
7.2 预测
1. Acrylic Acid (AA) & Acrylic Ester (AE)
1.1 Definition
1.2 Production Technology
1.3 Industry Chain
2. Global AA&AE Market
2.1 Supply
2.2 Demand
2.3 Enterprise Pattern
2.3.1 Crude Acrylic Acid (CAA)
2.3.2 Common Acrylic Ester (CAE)
2.4 Regional Distribution
3. China AA&AE Market
3.1 Supply
3.1.1 Capacity
3.1.2 Output
3.2 Demand
3.2.1 Consumption Structure
3.2.2 Consumption Volume
3.3 Import & Export
3.4 Competition Pattern
3.5 Price
4. Upstream-Downstream Industries of AA&AE
4.1 Propylene
4.1.1 Supply
4.1.2 Demand
4.1.3 Competition Pattern
4.1.4 Price
4.1.5 Trends
4.2 Super Absorbent Polymer (SAP)
4.2.1 Supply
4.2.2 Demand
4.2.3 Competition Pattern
4.2.4 Trends
4.3 Paint
4.3.1 Supply
4.3.2 Demand
4.3.3 Trends
4.4 Adhesive
4.4.1 Supply
4.4.2 Demand
4.4.3 Product Structure
4.4.4 Competition Pattern
4.4.5 Trends
5. Global Key AA&AE Companies
5.1 BASF
5.1.1 Profile
5.1.2 Operation
5.1.3 Revenue Structure
5.1.4 R&D and Investment
5.1.5 AA&AE Business
5.1.6 Development in China
5.2 DOW
5.2.1 Profile
5.2.2 Operation
5.2.3 Revenue Structure
5.2.4 Gross Profit
5.2.5 R&D
5.2.6 AA&AE Business
5.2.7 Development in China
5.3 Arkema
5.3.1 Profile
5.3.2 Operation
5.3.3 Revenue Structure
5.3.4 R&D and Projects under Construction
5.3.5 AA&AE Business
5.3.6 Development in China
5.3.7 Development Strategy
5.4 NIPPON SHOKUBAI
5.4.1 Profile
5.4.2 Operation
5.4.3 Revenue Structure
5.4.4 AA&AE Related Business
5.4.5 Development in China
5.4.6 Development Strategy
6. Key Chinese AA&AE Companies
6.1 Formosa Plastics Corporation
6.1.1 Profile
6.1.2 Operation
6.1.3 Revenue Structure
6.1.4 Gross Profit
6.1.5 R&D
6.1.6 AA&AE Business
6.2 Shenyang Chemical Co., Ltd (000698)
6.2.1 Profile
6.2.2 Operation
6.2.3 Revenue Structure
6.2.4 Gross Margin
6.2.5 R&D and Projects under Construction
6.2.6 AA&AE Business
6.2.7 Development Prospect
6.3 Zhejiang Satellite Petrochemical Co., Ltd (002648)
6.3.1 Profile
6.3.2 Operation
6.3.3 Revenue Structure
6.3.4 Gross Margin
6.3.5 R&D and Projects under Construction
6.3.6 AA&AE Business
6.3.7 Development Prospects
6.4 SunVic Chemical Holdings Limited (A7S)
6.4.1 Profile
6.4.2 Operation
6.4.3 Revenue Structure
6.4.4 Gross Profit
6.4.5 AA&AE Business
6.4.6 Development Prospect
6.5 Shandong Kaitai Petrochemical Co., Ltd.
6.5.1 Profile
6.5.2 Operation
6.5.3 Revenue Structure
6.5.4 Projects under Construction
6.5.5 AA&AE Business
6.6 BASF-YPC Company Limited
6.6.1 Profile
6.6.2 Operation
6.6.3 AA&AE Business
6.7 Shanghai Huayi Acrylic Acid Co., Ltd.
6.7.1 Profile
6.7.2 Operation
6.7.3 AA&AE Business
6.7.4 AA&AE Project Planning
6.8 Beijing Eastern Petrochemical Co.,Ltd
6.8.1 Profile
6.8.2 AA&AE Business
7. Conclusion and Forecast
7.1 Conclusion
7.2 Forecast
表:通用丙烯酸酯(分种类)性质
图:丙烯酸及酯上下游产业链
图:2007-2014年全球酯化级丙烯酸及通用丙烯酸酯产能
表:2014-2016年全球丙烯酸部分企业新增产能及投产时间
图:全球(分产品)丙烯酸及酯消费构成
图:2013-2014E全球酯化级丙烯酸TOP10企业产能构成
图:2013-2014E年全球通用丙烯酸酯TOP10企业产能构成
表:2013年全球丙烯酸及酯(分国家/地区)产能
图:2006-2014年中国酯化级丙烯酸产能及同比增长
图:2010-2014年中国通用丙烯酸酯产能及同比增长
图:2010-2016年中国通用丙烯酸酯(分产品)产能构成
图:2008-2014年中国丙烯酸及酯产量
图:中国丙烯酸及酯(分产品)消费构成
表:2008-2013年中国丙烯酸表观消费量
表:2008-2013年中国丙烯酸酯表观消费量
表:2008-2014年中国丙烯酸及酯(分产品)进出口量
图:2008-2014年中国丙烯酸及酯(分产品)进口价格
图:2008-2014年中国丙烯酸及酯(分产品)出口价格
表:2013年中国丙烯酸及酯(分企业/分产品)产能
表:2014-2016年中国主要丙烯酸及酯生产企业(分产品)扩建项目
图:2010-2014年中国丙烯酸及酯(分产品)月度市场均价
图:2006-2016年中国丙烯产量及同比增长
表:2006-2013年中国丙烯产量、进出口及表观消费量
表:2013年中国丙烯主要企业产能
图:2008-2014年中国丙烯市场均价
图:2008-2014年全球SAP产能及同比增长
图:2013年全球SAP(分国家/地区)产能构成
图:中国SAP(分产品)需求构成
表:2013年全球SAP重点企业产能及市场占有率
表:2013-2014年中国SAP(分企业)产能
表:2014-2016年中国SAP(分企业)新增产能
图:2006-2014年中国涂料产量及同比增长
图:2012年中国涂料(分类型)产量占比
表:2006-2013年中国涂料产量、进出口量及表观消费量
图:中国粉末涂料(分用途)需求占比
图:未来中国涂料发展趋势
表:中国胶粘剂(按成分)分类及性质
图:2006-2014年中国胶粘剂产量及同比增长
图:2006-2014年中国胶粘剂销售额及同比增长
表:2011-2013年中国胶粘剂(分用途)消费量构成
表:2012年中国胶粘剂(分产品)销量及构成
表:2013年中国结构胶粘剂主要企业核心产品、营业收入及下游应用
图:巴斯夫(分业务)结构
图:2008-2013年巴斯夫销售额及净利润
图:2012-2013年巴斯夫(分业务)销售额
图:2010-2013年巴斯夫(分地区)销售额及构成
图:2008-2013年巴斯夫研发支出及占比
图:2013年巴斯夫(分部门)研发费用构成
表:2013年巴斯夫公司化工业务(分产品/分地区)产能分布
表:2009-2015年巴斯夫丙烯酸产能
表:2013年巴斯夫公司丙烯酸及酯相关业务在建项目竣工时间及产能
表:2014年巴斯夫在中国的主要企业及地域分布
图:2007-2013年巴斯夫在中国销售收入及同比增长
表:2014年巴斯夫在中国建成或在建主要项目
图:2009-2014年陶氏化学净销售额与净利润
图:2008-2013年陶氏开工率
图:2010-2013年陶氏化学(分部门)销售额及构成
图:2009-2013年陶氏化学(分地区)销售额构成
图:2009-2013年陶氏化学毛利润及同比增长
图:2008-2013年陶氏化学研发支出及占比
表:截止到2013年底陶氏化学(分部门)专利
表:2013年陶氏化学丙烯酸及酯(分国家)产能分布
图:2013年陶氏化学Coatings and Infrastructure Solutions(分部门)销售额构成
图:2013年阿科玛(分部门)产品分布
图:2009-2014年阿科玛销售额与净利润
图:2013年阿科玛(分部门/分业务)销售额构成
图:2010-2013年阿科玛(分地区)营业收入占比
表: 2014年阿科玛集团重点在建工程
表:2013年阿科玛(分国家)产能
图:2009-2013年阿科玛丙烯酸及酯业务营业收入及同比增长
表:2010-2014年阿科玛在中国主要建设工程
图:2006-2020年阿科玛业务发展目标
表:日本触媒(分部门)产品分布
图:FY2010-FY2014年日本触媒集团销售收入与净利润
图:FY2010-FY2014日本触媒集团(分部门)销售额
图:FY2009-FY2014日本触媒集团(分国家/地区)销售额构成
图:2014年触媒集团(分国家)丙烯酸和高吸水性树脂产能
表:2009-2014年台塑(分产品)产能
图:2009-2014年台塑营业收入与净利润
图:2009-2013年台塑(分产品)销售收入构成
表: 2012-2013年台塑(分地区)营业收入及构成
图:2009-2014年台塑毛利润与毛利率
图:2010-2014年台塑研发费用及占比
图:2008-2013年台塑丙烯酸及酯产品营业收入及同比增长
图:2013年台塑丙烯酸及酯(分产品)销售额构成
图:2009-2013年台塑丙烯酸及酯业务(分产品)销量
表:2009-2013年台塑丙烯酸酯产品产能、产销量、产能利用率和产销率
表:2012-2014年台塑宁波丙烯酸及酯(分产品)产能
表:2013年沈阳化工子公司分布
表:2013年底沈阳化工(分产品)产能
图:2009-2014年沈阳化工营业收入与净利润
图:2010-2013年沈阳化工(分产品)营业收入及构成
图:2008-2013年沈阳化工(分产品)毛利率
表:2008-2013年沈阳化工研发支出及占比
表:截止到2013年底沈阳化工在建项目
表:2013年沈阳化工丙烯酸及酯(分产品)产能
图:2009-2013年沈阳化工丙烯酸及酯产销量
图:2009-2013年沈阳化工丙烯酸及酯营业收入及同比增长
表:2012-2016年沈阳化工营业收入和净利润
表:2008-2014年卫星石化(分产品)产能
图:2009-2014年卫星石化营业收入与净利润
图:2008-2013年卫星石化(分产品)营业收入
图:2008-2013年卫星石化(分地区)营业收入
图:2008-2013年卫星石化(分产品)毛利率
表:2008-2013年卫星石化研发支出及占比
表:截止2013年底卫星石化主要在建项目
图:2008-2013年卫星石化丙烯酸及酯营业收入及同比增长
表:2008-2011年卫星石化丙烯酸及酯(分产品)产销量和产销率(万吨)
图:2008-2015年卫星石化丙烯酸及酯(分产品)产能
表:2012-2016年卫星石化营业收入与净利润
图:2014年昇立化工控股公司子公司
图:2009-2014年昇立化工营业收入与净利润
图:2008-2013年昇立化工(分产品)营业收入
图:2010-2013年昇立化工(分地区)营业收入
图:2009-2014年昇立化工公司毛利润及同比增长
图:2008-2013年昇立化工丙烯酸及酯产品营业收入及同比增长
图:2008-2013年昇立化工丙烯酸及酯产品销量及同比增长
表:2010-2013年昇立化工丙烯酸及酯(分产品)产能
表:2012-2016年昇立化工营业收入和净利润及同比增长
表:开泰石化子公司分布
图:2009-2012年开泰石化营业收入与净利润
图:2009-2012年开泰石化(分产品)营业收入
表:截止到2013年底开泰石化丙烯酸及酯(分产品)产能
图:2009-2012年开泰石化丙烯酸及酯产量及产销率
图:2009-2012年开泰石化(分产品)丙烯酸及酯销量
表:2014年扬子-巴斯夫公司(分产品)产能
图:2007-2013年扬巴公司销售收入及同比增长
表:2013-2014年扬巴公司丙烯酸及酯(分产品)产能
图:2009-2013年上海华谊丙烯酸公司营业收入与净利润
图:2009-2013年上海华谊丙烯酸公司丙烯酸及酯产量
表:2014年初上海华谊丙烯酸公司丙烯酸及酯(分产品)产能
表:2013年北京东方化工丙烯酸及酯(分产品)产能
表:2013-2014年中国酯化级丙烯酸(分企业)产能及构成
表:2013-2014年中国通用丙烯酸酯(分企业)产能及构成
图:2012-2016年中国酯化级丙烯酸产能及同比增长
图:2012-2016年中国通用丙烯酸酯产能及同比增长
表:全球丙烯酸及酯业务未来发展趋势
CAE Properties by Type
Upstream and Downstream Industry Chain of AA&AE
Global CAA and CAE Capacity, 2007-2014
New Capacity and Operation Time of Some Global AA Enterprises, 2014-2016E
Global AA&AE Consumption Structure by Product
Capacity Structure of Global Top 10 CAA Enterprises, 2013-2014
Capacity Structure of Global Top 10 CAE Enterprises, 2013-2014
Global AA&AE Capacity by Country/Region, 2013
China’s CAA Capacity and YoY Growth, 2006-2014
China’s CAE Capacity and YoY Growth, 2010-2014
China’s CAE Capacity Structure by Product, 2010-2016E
China’s AA&AE Output, 2008-2014
China's AA&AE Consumption Structure by Product
China’s Apparent AA Consumption, 2008-2013
China’s Apparent AE Consumption, 2008-2013
China’s AA&AE Import and Export Volume by Product, 2008-2014
China’s AA&AE Import Price by Product, 2008-2014
China’s AA&AE Export Price by Product, 2008-2014
China's AA&AE Capacity by Enterprise/Product, 2013
Expansion Projects of China's Major AA&AE Manufacturers by Product, 2014-2016E
Monthly Average Price of Chinese AA&AE Market by Product, 2010-2014
China’s Propylene Output and YoY Growth, 2006-2016E
China’s Propylene Output, Import & Export and Apparent Consumption, 2006-2013
China’s Propylene Capacity Breakdown by Enterprise, 2013
Average Propylene Price in China, 2008-2014
Global SAP Capacity and YoY Growth, 2008-2014
Global SAP Capacity Structure by Country / Region, 2013
China’s SAP Demand Structure by Product
Global SAP Capacity and Market Share by Top Enterprises, 2013
China’s SAP Capacity by Enterprise, 2013-2014
China’s New SAP Capacity by Enterprise, 2014-2016E
China’s Paint Output and YoY Growth, 2006-2014
China’s Paint Output Structure by Type, 2012
China’s Paint Output, Import & Export Volume and Apparent Consumption, 2006-2013
China’s Powder Paint Demand Structure by Purpose
Future Development of China Paint Industry
Classification and Properties of Adhesives in China, by Composition
China’s Adhesive Output and YoY Growth, 2006-2014
China’s Adhesive Sales and YoY Growth, 2006-2014
China’s Adhesive Consumption Structure by Purpose, 2011-2013
China’s Adhesive Sales Volume and Structure by Product, 2012
Core Products, Revenue and Downstream Application of Major Structural Adhesive Enterprises in China, 2013
BASF’s Structure by Business
BASF’s Sales and Net Income, 2008-2013
BASF’s Sales by Business, 2012-2013
BASF’s Sales Breakdown and Percentage by Region, 2010-2013
BASF’s R&D Expenses and % of Revenue, 2008-2013
BASF’S R&D Expenses Structure by Segment, 2013
Capacity Breakdown of BASF’s Chemical Business by Product / Region, 2013
BASF’s AA Capacity, 2009-2015E
Completion Time and Capacity of BASF’s AA&AE Related Projects under Construction, 2013
BASF’s Main Subsidiaries in China, by Region, 2014
BASF’s Sales in China and YoY Growth Rate, 2007-2013
BASF’s Major Completed and Ongoing Projects in China, 2014
Net Sales and Net Income of Dow Chemical, 2009-2014
Operation Rate of Dow Chemical, 2008-2013
Sales Breakdown of Dow Chemical by Department, 2010-2013
Sales Structure of Dow Chemical by Region, 2009-2013
Gross Profit and YoY Growth of Dow Chemical, 2009-2013
R&D Expenses and % of Total Revenue of Dow Chemical, 2008-2013
Patents of Dow Chemical by Segment, as of end-2013
AA&AE Capacity Breakdown of Dow Chemical by Country, 2013
Sales Structure of Dow Chemical’s Coatings and Infrastructure Solutions Business by Segment, 2013
Product Distribution of Arkema by Department, 2013
Sales and Net Income of Arkema, 2009-2014
Sales Structure of Arkema by Department/Business, 2013
Revenue Structure of Arkema by Region, 2010-2013
Key Constructions in Process of Arkema, 2014
Capacity of Arkema by Country, 2013
AA&AE Business Revenue and YoY Growth of Arkema, 2009-2013
Arkema’s Major Construction Projects in China, 2010-2014
Business Development Target of Arkema, 2006-2020
Product Distribution of NIPPON SHOKUBAI by Segment
Sales and Net Income of NIPPON SHOKUBAI, FY2010-FY2014
Sales of NIPPON SHOKUBAI by Segment, FY2010-FY2014
Sales Structure of NIPPON SHOKUBAI by Country/Region, FY2009-FY2014
AA and SAP Capacity of NIPPON SHOKUBAI by Country, 2014
Capacity Breakdown of Formosa Plastics Corporation by Product, 2009-2014
Revenue and Net Income of Formosa Plastics Corporation, 2009-2014
Sales Structure of Formosa Plastics Corporation by Product, 2009-2013
Formosa Plastics Corporation’s Revenue Breakdown and Percentage by Region, 2012-2013
Gross Profit and Gross Margin of Formosa Plastics Corporation, 2009-2014
R&D Costs and % of Total Revenue of Formosa Plastics Corporation, 2010-2014
Revenue and YoY Growth of AA&AE Products of Formosa Plastics Corporation, 2008-2013
AA&AE Sales Structure of Formosa Plastics Corporation by Product, 2013
Sales Volume Breakdown of AA&AE Business of Formosa Plastics Corporation by Product, 2009-2013
Capacity, Output, Sales Volume, Capacity Utilization and Sales-Output Ratio of AE Products of Formosa Plastics Corporation, 2009-2013
AA&AE Capacity of Formosa Ningbo by Product, 2012-2014
Subsidiary Distribution of Shenyang Chemical, 2013
Capacity of Shenyang Chemical by Product, at the End of 2013
Revenue and Net Income of Shenyang Chemical, 2009-2014
Shenyang Chemical’s Revenue Breakdown and Percentage by Product, 2010-2013
Gross Margin of Shenyang Chemical by Product, 2008-2013
R&D Costs and % of Total Revenue of Shenyang Chemical, 2008-2013
Projects under Construction of Shenyang Chemical by the End of 2013
AA&AE Capacity of Shenyang Chemical by Product, 2013
AA&AE Output and Sales Volume of Shenyang Chemical, 2009-2013
AA&AE Revenue and YoY Growth of Shenyang Chemical, 2009-2013
Revenue and Net Income of Shenyang Chemical, 2012-2016E
Capacity of Zhejiang Satellite Petrochemical by Product, 2008-2014
Revenue and Net Income of Zhejiang Satellite Petrochemical, 2009-2014
Revenue of Zhejiang Satellite Petrochemical by Product, 2008-2013
Revenue of Zhejiang Satellite Petrochemical by Region, 2008-2013
Gross Margin of Zhejiang Satellite Petrochemical by Product, 2008-2013
R&D Costs and % of Revenue of Zhejiang Satellite Petrochemical, 2008-2013
Key Projects under Construction of Zhejiang Satellite Petrochemical as of the End of 2013
AA&AE Revenue and YoY Growth of Zhejiang Satellite Petrochemical, 2008-2013
AA&AE Output, Sales Volume and Sales-output Ratio of Zhejiang Satellite Petrochemical by Product, 2008-2011 (10 kilotons)
AA&AE Capacity of Zhejiang Satellite Petrochemical by Product, 2008-2015E
Revenue and Net Income of Zhejiang Satellite Petrochemical, 2012-2016E
Subsidiaries of SunVic Chemical, 2014
Revenue and Net Income of SunVic Chemical, 2009-2014
Revenue of SunVic Chemical by Product, 2008-2013
Revenue of SunVic Chemical by Region, 2010-2013
Gross Profit and YoY Growth of SunVic Chemical, 2009-2014
Revenue and YoY Growth of AA&AE Products of SunVic Chemical, 2008-2013
Sales Volume and YoY Growth of AA&AE Products of SunVic Chemical, 2008-2013
AA&AE Capacity of SunVic Chemical by Product, 2010-2013
Revenue, Net Income and YoY Growth of SunVic Chemical, 2012-2016E
Subsidiary Distribution of Shandong Kaitai Petrochemical
Revenue and Net Income of Shandong Kaitai Petrochemical, 2009-2012
Revenue of Shandong Kaitai Petrochemical by Product, 2009-2012
AA&AE Capacity of Shandong Kaitai Petrochemical by Product, as of the End of 2013
AA&AE Output and Sales-Output Ratio of Shandong Kaitai Petrochemical, 2009-2012
AA&AE Sales Volume of Shandong Kaitai Petrochemical by Product, 2009-2012
Capacity of BASF-YPC by Product, 2014
Sales and YoY Growth of BASF-YPC, 2007-2013
AA&AE Capacity of Acrylic Acid & Esters by Product, 2013-2014
Revenue and Net Income of Shanghai Huayi Acrylic Acid, 2009-2013
AA&AE Output of Shanghai Huayi Acrylic Acid, 2009-2013
AA&AE Capacity of Shanghai Huayi Acrylic Acid by Product, in Early 2014
AA&AE Capacity of Beijing Eastern Petrochemical by Product, 2013
China’s CAA Capacity and Structure by Enterprise, 2013-2014
China’s CAE Capacity and Structure by Enterprise, 2013-2014
China’s CAA capacity and YoY Growth, 2012-2016E
China’s CAE capacity and YoY Growth, 2012-2016E
Future Development of Global AA&AE Business
如果这份报告不能满足您的要求,我们还可以为您定制报告,请 留言说明您的详细需求。
|